Kinematic gait analysis in the sagittal plane yields highly precise information about how movement is executed. We describe the application of these techniques to identify gait deficits for mice subjected to autoimmune-mediated demyelination. These methods may also be used to characterize gait deficits for other mouse models featuring impaired locomotion.
A subscription to JoVE is required to view this content. Sign in or start your free trial.
Method Article
Sagittal Plane Kinematic Gait Analysis in C57BL/6 Mice Subjected to MOG35-55 Induced Experimental Autoimmune Encephalomyelitis
* These authors contributed equally
In This Article
Summary
Abstract
Kinematic gait analysis in the sagittal plane has frequently been used to characterize motor deficits in multiple sclerosis (MS). We describe the application of these techniques to identify gait deficits in a mouse model of MS, known as experimental autoimmune encephalomyelitis (EAE). Paralysis and motor deficits in mice subjected to EAE are typically assessed using a clinical scoring scale. However, this scale yields only ordinal data that provides little information about the precise nature of the motor deficits. EAE disease severity has also been assessed by rotarod performance, which provides a measure of general motor coordination. By contrast, kinematic gait analysis of the hind limb in the sagittal plane generates highly precise information about how movement is impaired. To perform this procedure, reflective markers are placed on a hind limb to detect joint movement while a mouse is walking on a treadmill. Motion analysis software is used to measure movement of the markers during walking. Kinematic gait parameters are then derived from the resultant data. We show how these gait parameters can be used to quantify impaired movements of the hip, knee, and ankle joints in EAE. These techniques may be used to better understand disease mechanisms and identify potential treatments for MS and other neurodegenerative disorders that impair mobility.
Introduction
Gait is a series of repetitive movements of the limbs used to achieve locomotion. Gait is comprised of step cycles, which are divided into two phases: the stance phase, which is when the foot is moving backwards on the ground to propel the body forwards; and the swing phase, where the foot is off the ground and moving forwards. Disturbances of gait are hallmark features of many neurodegenerative disorders, such as spinal cord injury (SCI), multiple sclerosis (MS), amyotrophic lateral sclerosis (ALS), Parkinson's disease (PD), and stroke; preclinical rodent models of these disorders often recapitulate their respective gait impairments1. The basic control mechanisms of locomotion in mice have been intensively studied2,3. Additionally, there are mouse models of many human neurological disorders4. Gait analysis in mice is therefore an attractive approach to measure multiple aspects of motor deficits that have known anatomical correlates. The study of gait in mouse models may provide insights into the neuropathological bases of locomotor deficits in neurodegenerative disorders, and enable the identification of potential treatments.
Some techniques that have been used to measure gait in rodents include visual inspection (e.g., the Basso mouse scale5 and open field test6) and analysis of gait from the ventral plane7. More recently, methods to measure sagittal plane kinematics of hindlimb movements have gained popularity because they provide more information about the execution of movement and consequently are more sensitive to subtle changes in gait8,9,10,11. Kinematic techniques developed to study hindlimb movement in sagittal plane while walking on a treadmill9,12 have been extensively studied in the context of SCI, ALS, traumatic cortical injuries, stroke, and Huntington's disease8,9,10,11,13,14,15,16. In contrast, these techniques have seen limited use in the study of locomotor deficits for mouse models of multiple sclerosis17.
Experimental autoimmune encephalomyelitis (EAE) is the most commonly used mouse model of MS18. The two main methods of inducing EAE is via active or passive inoculation. In active EAE, mice are immunized with myelin antigens, causing autoreactive T cell-mediated neuroinflammation and demyelination in the spinal cord and cerebellum. Passive EAE, on the other hand, is induced by transferring autoreactive T cells from a mouse with active EAE to a naïve mouse19. As described elsewhere, the disease course and neuropathology are influenced by the central nervous system (CNS) antigen and mouse strain20,21,22,23,24,25. In EAE experiments, control mice are injected with complete Freund's adjuvant (CFA) without the myelin antigen. EAE is characterized by ascending paralysis that begins with tail weakness and can potentially involve the forelimbs, resulting in ataxia and paralysis20. We have recently characterized gait changes in C57Bl/6 mice subjected to myelin oligodendrocyte glycoprotein 35-55 (MOG35-55)-induced EAE. These studies have shown gait analysis to be superior than classical behavioral analysis because deviations from normal ankle movement are highly correlated with the degree of white matter loss in the lumbar spinal cord of EAE mice26. By contrast, the strength of the correlation between white matter loss and two other traditional behavioral measures (clinical scoring and rotarod) was much weaker26.
We describe here the use of kinematic gait analysis to detect movement deficits in the sagittal plane of EAE mice walking on a treadmill. Five reflective markers were placed on a hindlimb to identify movement of the hip, knee, and ankle joints in high-speed video recordings. Motion analysis software was used to extract kinematic data about joint excursions. The utility of these techniques to quantify movement deficits for the MOG35-55 model of EAE are discussed. These techniques are also applicable to the study of gait deficits in other mouse models of neurodegenerative disorders.
Access restricted. Please log in or start a trial to view this content.
Protocol
This protocol is in accordance with the Canadian Council on Animal Care guidelines and was approved by the Dalhousie University Committee on Laboratory Animals.
1. Construct Reflective Markers:
- Using a hand-held hole punch, punch the desired number of small circles from a sheet of reflective paper. Each animal requires 5 markers for a single recording; two large and three small markers.
- Using fine scissors, make a straight cut extending from the perimeter to the center of the circle.
- Remove the paper backing of the marker to reveal the adhesive surface. Using fine forceps, grip the marker firmly and curl it in on itself using your finger to form a cone shape. To make a small marker, curl the cone tightly. To make a large marker, curl the cone loosely.
- Using a hand-held glue gun, fill the inside of the cone-shaped marker with glue while gripping the tip of the cone with forceps and adhere the marker to a flat piece of cardboard. The glue will prevent the marker from collapsing and bending during recording to ensure optimal reflection of light. When the glue is dry (approximately 10 min), remove the marker from the cardboard with a scalpel (Figure 1A).
2. Prepare the Animal for Recording
- Anesthetize the mouse with isoflurane gas (2.5%; 2 liters/min O2) by placing the mouse into an induction chamber. Once the mouse is unconscious, place it into a nose cone positioned on top of a recirculating water heating blanket. The purpose of anesthetization is to immobilize the mouse for marker placement; the procedure is not painful. Therefore, depth of anesthesia does not need to be assessed.
- Apply a topical eye lubricant to both eyes.
- Shave the desired hindlimb using electric clippers. Begin at the ankle and extend to the spine and bottom of the ribs; ensure no fur is left as this will impair marker adhesion.
Note: Here, the right hindlimb was recorded; however, either hindlimb can be used. - Using a permanent marker, indicate the location of the iliac crest and the hip joint. The iliac crest is just below the bottom of the ribs and is easily palpable by bringing the knees together under the mouse's body.
Note: The hip joint can be found by flexing and extending the leg to find the articulation point between the pelvis and femur. - Using fine forceps, grasp the pointed end of a small marker and dip the base in fast-acting adhesive glue, or an equivalent alternative. Place the marker on the tip of the fourth digit and hold in place for 2-3 s to allow the glue to dry. Place the other two small markers on the metatarsophalangeal joint and ankle in the same manner (Figure 1B).
- Place large markers on the iliac crest and hip joint (Figure 1B) in the same manner as the small markers.
- Remove the mouse from the nose cone and immediately transfer to the recording room using a transfer cage. Place the mouse on the stationary treadmill and allow for full recovery from anesthesia.
3. Gait Recording
- Prior to recording the mouse's gait, take a picture of a calibration block with known dimensions on the treadmill.
Note: This will allow the pixels in the video to be converted to real measurements. The camera should be placed approximately 120 cm from the treadmill.- Position the camera at the same height and level as the treadmill. Maintain the same camera position for the recordings following the calibration image.
- Once the mouse has fully recovered from anesthesia, turn the treadmill to a low speed (5 cm/s) to let the mouse begin walking. Ensure that the treadmill belt direction is such that the markers on the mouse are facing towards the camera.
- Increase the treadmill speed gradually up to 20 cm/s; this is the ideal speed for a consistent gait in most healthy mice.
Note: Although it is ideal to have all mice walking at the same speed, some may be unable to consistently reach this speed.- If the mouse is unable to walk at 20 cm/s, reduce the speed as necessary and be sure to make a note of this. Reduce the speed of the treadmill until consistent step cycles are achieved.
Note: Later data analysis can adjust for differences in speeds.
- If the mouse is unable to walk at 20 cm/s, reduce the speed as necessary and be sure to make a note of this. Reduce the speed of the treadmill until consistent step cycles are achieved.
- Begin recording the video once the mouse is walking steadily (i.e., walking at a consistent pace, not rearing or weaving side to side). Continue recording until 8 to 12 consecutive step cycles have been recorded. For every video, record the speed of the treadmill and the side of the mouse recorded.
- Once recording is complete, turn off the treadmill and return the mouse to its cage. Clean the treadmill thoroughly between recordings as scents left behind by other mice may alter the behavior of incoming mice. To reduce stress and skin damage, do not remove the markers; allow the mice to remove them on their own.
4. Analysis
- Process the videos using motion analysis software.
Note: In our experiments, we used custom scripts designed for imaging and statistical software (see Table of Materials) that were written by Dr. Nicolas Stifani. The following steps are performed using the selected motion analysis software.- Extract the pixel coordinates of the markers from the videos, and using the calibration video, transform the pixel values to centimeters and calculate the joint angles at each frame.
- Identify the beginning and end of each step cycle, thereby obtaining information about step duration and length.
- Normalize the step cycle duration to 200 normalized frames, such that swing and stance are represented by 100 frames, respectively.
- Using the normalized frames, calculate kinematic parameters for data analysis using spreadsheet software (see Table of Materials).
- To establish the average angle of a particular joint, take the mean of all angles within a normalized frame as:
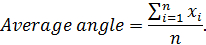
Note: Here x represents the angle value at a given normalized frame, and n represents the normalized frame number. - To establish the range of motion of a particular joint for a given mouse, subtract the smallest angle from the largest angle in a set of normalized frames as follows:
Range of motion = Anglemaximum - Angleminimum.
Note: Here Anglemaximum and Angleminimum are the greatest and smallest angles achieved within the normalized step cycle, respectively. - To establish RMS difference, first subtract the average angle of each experimental time-point from the baseline recording. Next, square each difference, take the mean of all squared values and square root the mean. The equation is as follows:
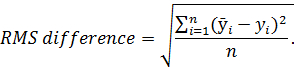
Note: Here represents the average angle from the baseline recording; y represents the average angle from each experimental time-point; n and represents the number of normalized frames. Root mean squared (RMS) difference is a measurement used to assess deviation in gait from baseline recordings.
- To establish the average angle of a particular joint, take the mean of all angles within a normalized frame as:
- Use scientific graphing and statistics software to analyze and present the data (see Table of Materials).
Access restricted. Please log in or start a trial to view this content.
Results
Figure 1 is a schematic representation of the procedure used for kinematic gait analysis. First, reflective markers are made and placed on a mouse at 5 anatomical points. Gait is then recorded while the mouse is walking on a treadmill. Motion analysis software is used to extract kinematic data for subsequent analysis.
Figure 2A-C represent the step cycle of a control CFA mouse for the hip, knee, and ankle joint angles...
Access restricted. Please log in or start a trial to view this content.
Discussion
In mice with EAE, the two most common methods of measuring motor deficits are clinical scoring and fall latency from a rotarod27,28. These techniques have several limitations. Although convenient and widely used, clinical scoring is limited by yielding only ordinal level data, meaning that the magnitude of the differences between clinical scores are not known. Clinical scoring also suffers from being unable to provide precise information about the nature of the m...
Access restricted. Please log in or start a trial to view this content.
Disclosures
The authors declare that they have nothing to disclose.
Acknowledgements
We would like to acknowledge Sid Chedrawe for his technical assistance with filming. This work was supported by funding from the MS Society of Canada (EGID 2983).
Access restricted. Please log in or start a trial to view this content.
Materials
| Name | Company | Catalog Number | Comments |
|---|---|---|---|
| Camera | Nikon | Nikon D750 | Used to film the video |
| Reflective tape | B&L Engineering | MKR-Tape-2 | |
| Fine scissors | Fine Science Tools | 15023-10 | |
| Forceps | Fine Science Tools | 11252-20 | |
| Glue gun | Craftsmart | E231647 | |
| scalpel handle #4 | Roboz | R5-9884 | |
| Scalpel Blade No.10 | Feather | 2020-12 | |
| C57BL/6 mice | Charles River Laboratories | ||
| Anesthetic machine | EZ Anesthesia | EZ-AF9000 Auto Flow System | |
| Recirculating water heating blanket | Androit | HTP-1500 | |
| topical eye lubricant | Refresh | DIN00210889 | |
| Shaver | Oster | 78997-010 | |
| High speed camera | Fastec | Fastec IL3-100 | |
| High power light | Smith Victor Corporation | Model 700 SG (600 Watt quartz light, 120 Volts) | |
| Light Stand | Promaster | LS1 | |
| Treadmill | Custom built at the Zoological Institute, University of Cologne | ||
| Microsoft Excel 2016 | Microsoft | Version 2016 | |
| KinemaJ | Nicolas Stifani | This is a script generated for use with ImageJ | |
| KinemaR | Nicolas Stifani | This is a script generated for use with Rstudio | |
| Vicon Motus | Vicon Motus | Version 9.00 | |
| GraphPad Prism | GraphPad | Version 6.00 |
References
- Giladi, N., Horak, F. B., Hausdorff, J. M. Classification of gait disturbances: distinguishing between continuous and episodic changes. Mov Disord. 28 (11), 1469-1473 (2013).
- Kiehn, O. Decoding the organization of spinal circuits that control locomotion. Nat Rev Neurosci. 17 (4), 224-238 (2016).
- Akay, T., Tourtellotte, W. G., Arber, S., Jessell, T. M. Degradation of mouse locomotor pattern in the absence of proprioceptive sensory feedback. Proc Natl Acad Sci U S A. 111 (47), 16877-16882 (2014).
- Hafezparast, M., Ahmad-Annuar, A., Wood, N. W., Tabrizi, S. J., Fisher, E. M. Mouse models for neurological disease. Lancet Neurol. 1 (4), 215-224 (2002).
- Basso, D. M., et al. Basso Mouse Scale for locomotion detects differences in recovery after spinal cord injury in five common mouse strains. J Neurotrauma. 23 (5), 635-659 (2006).
- Tatem, K. S., et al. Behavioral and locomotor measurements using an open field activity monitoring system for skeletal muscle diseases. J Vis Exp. (91), e51785(2014).
- Hetze, S., Romer, C., Teufelhart, C., Meisel, A., Engel, O. Gait analysis as a method for assessing neurological outcome in a mouse model of stroke. J Neurosci Methods. 206 (1), 7-14 (2012).
- Preisig, D. F., et al. High-speed video gait analysis reveals early and characteristic locomotor phenotypes in mouse models of neurodegenerative movement disorders. Behav Brain Res. 311, 340-353 (2016).
- Leblond, H., L'Esperance, M., Orsal, D., Rossignol, S. Treadmill locomotion in the intact and spinal mouse. J Neurosci. 23 (36), 11411-11419 (2003).
- Ueno, M., Yamashita, T. Kinematic analyses reveal impaired locomotion following injury of the motor cortex in mice. Exp Neurol. 230 (2), 280-290 (2011).
- Zorner, B., et al. Profiling locomotor recovery: comprehensive quantification of impairments after CNS damage in rodents. Nat Methods. 7 (9), 701-708 (2010).
- Pearson, K. G., Acharya, H., Fouad, K. A new electrode configuration for recording electromyographic activity in behaving mice. J Neurosci Methods. 148 (1), 36-42 (2005).
- Balkaya, M., Krober, J. M., Rex, A., Endres, M. Assessing post-stroke behavior in mouse models of focal ischemia. J Cereb Blood Flow Metab. 33 (3), 330-338 (2013).
- Akay, T. Long-term measurement of muscle denervation and locomotor behavior in individual wild-type and ALS model mice. J Neurophysiol. 111 (3), 694-703 (2014).
- Taylor, T. N., Greene, J. G., Miller, G. W. Behavioral phenotyping of mouse models of Parkinson's disease. Behav Brain Res. 211 (1), 1-10 (2010).
- Chen, K., et al. Differential Histopathological and Behavioral Outcomes Eight Weeks after Rat Spinal Cord Injury by Contusion, Dislocation, and Distraction Mechanisms. J Neurotrauma. 33 (18), 1667-1684 (2016).
- de Bruin, N. M., et al. Multiple rodent models and behavioral measures reveal unexpected responses to FTY720 and DMF in experimental autoimmune encephalomyelitis. Behav Brain Res. 300, 160-174 (2016).
- Steinman, L., Zamvil, S. S. How to successfully apply animal studies in experimental allergic encephalomyelitis to research on multiple sclerosis. Ann Neurol. 60 (1), 12-21 (2006).
- Emerson, M. R., Gallagher, R. J., Marquis, J. G., LeVine, S. M. Enhancing the ability of experimental autoimmune encephalomyelitis to serve as a more rigorous model of multiple sclerosis through refinement of the experimental design. Comp Med. 59 (2), 112-128 (2009).
- Bittner, S., Afzali, A. M., Wiendl, H., Meuth, S. G. Myelin oligodendrocyte glycoprotein (MOG35-55) induced experimental autoimmune encephalomyelitis (EAE) in C57BL/6 mice. J Vis Exp. (86), (2014).
- Beeton, C., Garcia, A., Chandy, K. G. Induction and clinical scoring of chronic-relapsing experimental autoimmune encephalomyelitis. J Vis Exp. (5), e224(2007).
- Barthelmes, J., et al. Induction of Experimental Autoimmune Encephalomyelitis in Mice and Evaluation of the Disease-dependent Distribution of Immune Cells in Various Tissues. J Vis Exp. (111), (2016).
- Shaw, M. K., Zhao, X. Q., Tse, H. Y. Overcoming unresponsiveness in experimental autoimmune encephalomyelitis (EAE) resistant mouse strains by adoptive transfer and antigenic challenge. J Vis Exp. (62), e3778(2012).
- Stromnes, I. M., Goverman, J. M. Passive induction of experimental allergic encephalomyelitis. Nat Protoc. 1 (4), 1952-1960 (2006).
- Stromnes, I. M., Goverman, J. M. Active induction of experimental allergic encephalomyelitis. Nat Protoc. 1 (4), 1810-1819 (2006).
- Fiander, M. D., Stifani, N., Nichols, M., Akay, T., Robertson, G. S. Kinematic gait parameters are highly sensitive measures of motor deficits and spinal cord injury in mice subjected to experimental autoimmune encephalomyelitis. Behav Brain Res. 317, 95-108 (2017).
- Jones, M. V., et al. Behavioral and pathological outcomes in MOG 35-55 experimental autoimmune encephalomyelitis. J Neuroimmunol. 199 (1-2), 83-93 (2008).
- van den Berg, R., Laman, J. D., van Meurs, M., Hintzen, R. Q., Hoogenraad, C. C. Rotarod motor performance and advanced spinal cord lesion image analysis refine assessment of neurodegeneration in experimental autoimmune encephalomyelitis. J Neurosci Methods. 262, 66-76 (2016).
- Sasaki, M., Lankford, K. L., Brown, R. J., Ruddle, N. H., Kocsis, J. D. Focal experimental autoimmune encephalomyelitis in the Lewis rat induced by immunization with myelin oligodendrocyte glycoprotein and intraspinal injection of vascular endothelial growth factor. Glia. 58 (13), 1523-1531 (2010).
- Merkler, D., Ernsting, T., Kerschensteiner, M., Bruck, W., Stadelmann, C. A new focal EAE model of cortical demyelination: multiple sclerosis-like lesions with rapid resolution of inflammation and extensive remyelination. Brain. 129 (Pt 8), 1972-1983 (2006).
- Franco-Pons, N., Torrente, M., Colomina, M. T., Vilella, E. Behavioral deficits in the cuprizone-induced murine model of demyelination/remyelination. Toxicol Lett. 169 (3), 205-213 (2007).
- Goldberg, N. R., Hampton, T., McCue, S., Kale, A., Meshul, C. K. Profiling changes in gait dynamics resulting from progressive 1-methyl-4-phenyl-1,2,3,6-tetrahydropyridine-induced nigrostriatal lesioning. J Neurosci Res. 89 (10), 1698-1706 (2011).
Access restricted. Please log in or start a trial to view this content.
Reprints and Permissions
