Multiple sclerosis is an inflammatory demyelinating disease with no cure. Analysis of brain tissue provides important clues to understanding the pathogenesis of the disease. Here we discuss the methodology and downstream analysis of MS brain tissue collected through a unique rapid autopsy program in operation at the Cleveland Clinic.
Method Article
Comprehensive Autopsy Program for Individuals with Multiple Sclerosis
* These authors contributed equally
In This Article
Summary
Abstract
We describe a rapid tissue donation program for individuals with multiple sclerosis (MS) that requires scientists and technicians to be on-call 24/7, 365 days a year. Participants consent to donate their brain and spinal cord. Most patients were followed by neurologists at the Cleveland Clinic Mellen Center for MS Treatment and Research. Their clinical courses and neurological disabilities are well-characterized. Soon after death, the body is transported to the MS Imaging Center, where the brain is scanned in situ by 3 T magnetic resonance imaging (MRI). The body is then transferred to the autopsy room, where the brain and spinal cord are removed. The brain is divided into two hemispheres. One hemisphere is immediately placed in a slicing box and alternate 1 cm-thick slices are either fixed in 4% paraformaldehyde for two days or rapidly frozen in dry ice and 2-methylbutane. The short-fixed brain slices are stored in a cryopreservation solution and used for histological analyses and immunocytochemical detection of sensitive antigens. Frozen slices are stored at -80 °C and used for molecular, immunocytochemical, and in situ hybridization/RNA scope studies. The other hemisphere is placed in 4% paraformaldehyde for several months, placed in the slicing box, re-scanned in the 3 T magnetic resonance (MR) scanner and sliced into centimeter-thick slices. Postmortem in situ MR images (MRIs) are co-registered with 1 cm-thick brain slices to facilitate MRI-pathology correlations. All brain slices are photographed and brain white-matter lesions are identified. The spinal cord is cut into 2 cm segments. Alternate segments are fixed in 4% paraformaldehyde or rapidly frozen. The rapid procurement of postmortem MS tissues allows pathological and molecular analyses of MS brains and spinal cords and pathological correlations of brain MRI abnormalities. The quality of these rapidly-processed postmortem tissues (usually within 6 h of death) is of great value to MS research and has resulted in many high-impact discoveries.
Introduction
One of the best ways to study a disease is to examine the diseased tissue itself. This presents challenges to those who study diseases of the central nervous system (CNS). Biopsies of diseased brain and spinal cord are extremely rare and usually involve atypical cases. Autopsy rates for individuals with CNS diseases have decreased dramatically in recent years, and when performed, they often do not provide rapid procurement of tissues. These challenges have resulted in the establishment of disease-centered brain banks, including several focused on collecting tissues from individuals with multiple sclerosis (MS). MS is an inflammatory-mediated disease of the CNS that destroys myelin, oligodendrocytes (myelin forming cells), neurons, and axons. The majority of MS patients have a bi-phasic disease course that starts with bouts of neurological disability with variable recovery that eventually evolves into a gradually-progressive disease that is likely neurodegenerative in nature1. For the majority of donated MS brains, postmortem intervals (PMI) between death and tissue processing exceed 24 h. While these tissues have provided valuable information regarding pathological changes in MS brains, they are not suited for more advanced molecular studies that can provide powerful insights into disease pathophysiology. This is particularly the case for gene profiling studies, which require intact RNA.
To overcome the limitations discussed above, we have developed a rapid tissue donation program that allows for MRI/pathological correlations. This protocol provides well-preserved tissues suitable for modern molecular studies and allows direct comparison of brain pathology and MRI abnormalities in MS brains. The Cleveland Clinic Multiple Sclerosis Tissue Donation Program has been in existence for over 20 years. This rapid tissue donation program procures brains and spinal cords from individuals with MS and other associated autoimmune neurological conditions. The program aims to obtain in situ MRIs within 6 h of death, followed by removal of brain and spinal cord for tissue processing.
Recruitment
Donations are obtained through either ante-mortem consent obtained directly from patients (pre-consented) or from next of kin after death. Pre-consented patients are typically identified from the clinical population at the Mellen Center for Multiple Sclerosis Treatment and Research in Cleveland, Ohio. Although preference in recruitment in the rapid tissue donation program is given to patients who have been followed in longitudinal research studies, it is open to all patients seen at the center. Participants who enroll prior to death are given instructions for family members or care providers to contact the research team, either at the time of death or when death is thought to be imminent. The second method for individuals to enter the tissue donation program is at the time of death through consent by next of kin. The State of Ohio requires deaths to be referred to a federally-mandated organ procurement organization named LifeBanc, which operates in 20 counties of northeastern Ohio. LifeBanc screens all deaths for a diagnosis of MS, which is an exclusion for organ donation. Arrangements were made for LifeBanc to notify investigators from the MS tissue donation program for all deaths with an associated diagnosis of MS occurring within a 75-mile radius from the Cleveland Clinic. Next of kin and hospital staff are then contacted by the Tissue Donation Program Staff and consent is obtained for donation of brain and spinal cord tissues. These two methods of recruitment ante-mortem and post-mortem through LifeBanc result in approximately 10-12 brain donations per year. Adjustments are made to the upper age limit of death to manage the number of referrals derived from LifeBanc.
Procurement of donations
The program requires 24 h coverage, 365 days a year by members of the tissue donation program for tissue procurement. A centralized tissue donation notification email/pager/mobile device text notification system is used by the clinical team covering tissue donations. LifeBanc is provided numbers to contact on-call personnel for the tissue donation program. Members are notified of death by hospital providers/next of kin (pre-consented) or by LifeBanc and other referral sources. First, a determination of time of death and feasibility to tissue donation is made. Deaths are then screened for conditions that potentially result in poor-quality tissue, including prolonged pre-mortem hypoxia, massive destructive brain tissue (e.g., large intracranial hemorrhage, extensive bi-hemispheric strokes, extensive tumor burden), prolonged ventilator support (>3 days), and prolonged use of vasoactive agents (>3 days) prior to death. When a medical examiner is involved in a death, the study neurologist can speak with the medical examiner to explore a way to receive timely tissues without compromising the medical examiner's responsibility. If viable tissue is felt to be present, then written consent is obtained (if not obtained pre-mortem) and preparations are made for body transportation. A previously-contracted decedent transportation service is then contacted for transport to the MRI facilities at Cleveland Clinic. Care is taken to ensure that the body remains at room temperature and is not placed into refrigeration, as lower body temperatures are associated with alterations in MRI signal characteristics.
Clinical history
Clinical history includes details on diagnosis of MS, onset of symptoms, treatments used, results of clinical and para-clinical testing (evoked potentials, cerebrospinal fluid results, optical coherence tomography), multiple sclerosis functional composite, and expanded disability status scale (EDSS; actual or estimated), which are collected from the medical record (where available), and direct interview of next of kin. Pre-mortem MRI are also collected.
Protocol
This protocol has been approved by the Cleveland Clinic Institutional Review Board and follows guidelines of the Cleveland Clinic human research ethics committee.
1. In Situ MRI
- Take the donor body to the MRI suite and conduct a 2 h MRI imaging protocol at the MS Imaging Facility. Conduct MRI on a 3 T or 7 T imager.
NOTE: Priority is given to 3T as the majority of legacy data has been performed on 3 T, but when not available, imaging is conducted with 7T. Designated core sequences are performed for all cases (Table 1) and additional sequences that depend upon current research interests are performed if time permits (constrained by achieving tissue fixation less than 12 h after death). Table 1 describes the core sequences.
2. Autopsy
NOTE: Following the in situ MRI, the body is transported to the morgue for brain and spinal cord extraction by a diener and tissue processing by lab members.
- Perform the following steps prior to body arrival at the morgue. Two hours prior, prepare 3 L of 4% paraformaldehyde (PFA) and label containers and bags for tissue storage. Prepare 3 L of 8% PFA and dilute 1.5 L of 8% PFA to 4% PFA. Place the remaining 8% PFA in 4 °C for day 2.
- Prior to traveling to the morgue, fill 2 traveling coolers to 50% capacity with dry ice (large blocks broken to fit and small pellets).
- At the morgue, fill a stainless-steel container halfway with 2-methylbutane and dry ice and cover with a lid in preparation for snap freezing the tissue.
- Weigh and photograph the brain once removed by the diener.
- Place any attached dura in a container filled with PFA.
- Separate the cerebellum and brainstem from the cerebrum and photograph the cerebrum.
- Identify the optic nerves, chiasm, and tracts and separate using a probe and tweezers. Resect the structure with a scalpel.
NOTE: The distal segment of one side of the optic nerve is marked using Higgins ink for identification. - Separate the cerebral hemispheres longitudinally and photograph each hemisphere individually.
- Ink the primary motor cortex (PMC) for the left hemisphere, re-photograph it, and place it in a 3.3 L container for long-fixation. Document the start time for brain fixation.
- The PMC for the right hemisphere may be inked or excised.
- If being excised, first remove the covering meninges.
- Re-photograph inked or excised PMC.
- If PMC is excised, cut into 6 equally-sized sections.
- Ink the rostral aspect of each section.
- Place odd-numbered sections into PFA-filled containers for short-fixation.
- Snap-freeze even-numbered sections and place in sealed freezer bags into cooler #1.
- Cut the right hemisphere anterior to posterior into 1 cm-thick coronal sections.
- Document gross abnormalities (e.g., cutting artifact, hemorrhage, and lesions).
- Place odd-numbered sections into containers filled with PFA for short-fixation.
- Snap-freeze even-numbered sections and place in sealed freezer bags.
- Document end of brain fixation time.
- Separate the brainstem from the cerebellum and place in a PFA-filled container for short-fixation.
- Separate cerebellar hemispheres longitudinally.
- Cut each hemisphere into 4 equally thick sagittal sections.
- Photograph medial and lateral views.
- Place left cerebellar hemispheric slices into a container filled with PFA for short-fixation.
- Snap-freeze right cerebellar hemispheric slices and place in sealed freezer bags into cooler #1.
- Obtain the spinal cord with nerve roots from the diener.
- Remove spinal cord dura mater and store dura in a container with PFA.
- Separate left and right anterior and posterior nerve roots. Cut the left anterior and posterior nerve roots cut from the spinal cord and place in a PFA filled container for short-fixation.
- Cut the right anterior and posterior nerve roots from the spinal cord, snap-freeze, place in sealed freezer bags, and then place in cooler #2.
- Photograph the caudal-most 20 cm of the spinal cord. Document the location of the lumbar enlargement.
- Cut 2 cm transverse sections of the cord proceeding from caudal to rostral.
- Ink the rostral aspect of each cut section.
- Place odd-numbered sections into containers filled with PFA for short-fixation.
- Snap-freeze even-numbered sections, place into sealed freezer bags, and then place in cooler #2.
- Document the start time for spinal cord fixation and any gross abnormalities.
- Photograph the remaining rostral portion of the spinal cord.
- Document the position of the cervical enlargement. Follow steps 2.13.5–2.13.8 for the remaining spinal cord.
- Following the morgue place frozen tissue in labeled boxes in -80 °C freezers. Store fixed tissue at 4 °C.
- At 24 h post-autopsy (day 2) dilute the remaining 8% PFA to 4%.
- Replace 4% PFA in fixation containers with freshly diluted 4% PFA.
- At 60 h post-autopsy prepare solutions of 2.5% glutaraldehyde in 4% PFA from glutaraldehyde, PFA, dH2O and Sorenson’s buffer (prepared by mixing in sequence: 0.2 M phosphate buffer pH 7.4, polyvinylpyrolidone 1% w/v, sucrose 30% w/v, and ethylene glycol 30% v/v).
- Remove used 4% PFA from short-fixation containers.
- Rinse tissue in Sorenson’s buffer and place it in cryoprotection solution (glycerol 20%, 0.4 M Sorenson’s buffer 20%, and 0.02% sodium azide in dH2O).
- Photograph short-fixed brain slices, cerebellum, brainstem and motor cortex (if applicable).
- With a scalpel blade cut 2 mm thick transverse sections from each 2 cm short-fixed spinal cord section.
- Place sections in 2 mL scintillation vials and fill with solution of 2.5% glutaraldehyde in 4% PFA.
- Return the remaining section to the original 20 mL scintillation vial. Rinse section with Sorenson’s buffer and replace with cryoprotection solution.
3. Pathology
NOTE: Short-fixed slices of the right hemisphere as well as the long-fixed left hemisphere (placed in 4% PFA for several months) are either cut into 30 µm sections (referred to as free-floating) or embedded in paraffin and cut as 12–14 µm sections (referred to as paraffin-embedded). These sections are processed usually with proteolipid protein (PLP) for detecting demyelinating lesions and major histocompatibility complex II (MHC-II) for immune activity using the diaminobenzidine (DAB) method. These protocols have been standardized and used in several publications2,3,4,5,6,7,8,9,10,11,12.
- Free-Floating (30 µm) DAB-Avidin-Biotin Complex (ABC) Tissue Staining
- Remove sections from cryostorage solution, transfer sections to a six-well plate, and wash them 3x for 5 min each in 2 mL of 1x phosphate buffered saline pH 7.0 (PBS). When transferring to the next well in the six-well plate use care not to tear the tissue. During each wash and incubation step, place the six-well plate on a shaker and allow tissue to gently shake.
NOTE: Tissue sections incubated in smaller volumes and in larger plates (i.e., 12- and 24-well plates) tend to exhibit surface and edge tearing. - Perform antigen retrieval by microwaving sections in a glass beaker containing roughly 30 mL of 10 mM citrate buffer (pH 6.0). Ensure tissues are not folded by manipulating with a paintbrush and microwave sections for 2–3 min or until citrate buffer comes begins to boil. Allow sections to cool to room temperature (~20 min).
- Transfer sections back to a six-well plate and wash sections 3x for 5 min each in 2 mL of PBS/0.3% Triton X-100. Block endogenous peroxidases by incubating sections in 2 mL of 3% H2O2/0.3% Triton X-100/PBS for 30 min at room temperature (RT).
- Wash sections 3x for 5 min each in 2 mL of PBS/0.3% Triton X-100. Block sections in 2 mL of 3% normal goat serum/0.3% Triton X-100/1x PBS for 1 h at RT.
- Incubate sections overnight to 5 days (depending on the antibody) in primary antibodies directed against microglia and myelin epitopes to detect inflammation (MHCII) and demyelination (PLP) (see the Table of Materials) at 4 °C.
NOTE: Ensure that sections are not folded when incubating in this step or subsequent steps as this will lead to areas within the sections being void of stain. - Wash sections 3x for 5 min each in 2 mL of 1x PBS. Then incubate sections in secondary biotinylated antibodies (see the Table of Materials) for 1 h at RT. Prepare Avidin-Biotin Complex (ABC) solution during incubation roughly 45 min prior to the next wash step to allow ABC complexes to form.
- Wash sections 3x for 5 min each in 2 mL of 1x PBS. Then incubate sections in ABC for 1 h at RT.
- Wash sections in 2 mL of 1x PBS three times for 5 min each. Incubate sections in filtered DAB (2 mL/well/section) containing H2O2 (1:500 dilution of 30% H2O2 in DAB) until color develops adequately (~3–8 min).
- Wash sections 3x for 5 min each in 2 mL of 1x PBS. To enhance signal (optional), osmicate using 0.04% OsO4 (~30 s).
- Wash sections three times for 5 min each in 1x PBS. Individually, transfer each section from the six-well plate to a small container full of 1x PBS and position the tissue section on a glass slide as flat as possible.
- Gently lift the slide out of the PBS while ensuring the tissue section is as flat as possible. Using two paint brushes, gently flatten and stretch the tissue out on the slide and dab away the excess water with paper towel. Mount tissue sections with glycerol (or an equivalent mounting media) and seal the coverslip with clear nail polish.
- Remove sections from cryostorage solution, transfer sections to a six-well plate, and wash them 3x for 5 min each in 2 mL of 1x phosphate buffered saline pH 7.0 (PBS). When transferring to the next well in the six-well plate use care not to tear the tissue. During each wash and incubation step, place the six-well plate on a shaker and allow tissue to gently shake.
4. Paraffin-embedded Hemispheric Sections: DAB Staining
- Melt paraffin off the slides in a 60 °C oven for 5–10 min.
- De-paraffinize sections by incubating in xylene 3x for 5 min each.
- Rehydrate tissue in graded ethanol at 100% (2x for 5 min each), 95% (2x for 5 min), 70% (2x for 5 min each), and 50% (1x for 5 min each). Cover slides in PBS.
- Antigen retrieve by microwaving slides in a beaker of 10 mM citrate buffer (pH 6.0).
- Wash slides in 1x PBS (3x for 5 min each) once cooled to room temperature. Block endogenous peroxidases by incubating tissue in 3% H2O2/1% Triton-X 100/PBS for 30 min.
- Wash tissue in 1x PBS three times for 5 min each. Block tissue with 6% normal goat serum in PBS for 1 h.
- Incubate sections in primary antibody (see the Table of Materials) in PBS at room temperature (RT) overnight (max 20 h).
- Wash sections 3x for 5 min each in 1x PBS. Then incubate sections in corresponding secondary antibody (see the Table of Materials) in PBS for 1 h at RT.
- Prepare ABC solution roughly 45 min prior to the next wash step during incubation.
- Wash sections 3x for 5 min each in 1x PBS and then incubate in ABC for 1 h at RT.
- Wash section 3x for 5 min each in 1x PBS.
- Incubate sections in filtered (0.45 µm filter pore size) DAB containing H2O2 (1:500 dilution of 30% H2O2 in DAB) until color develops adequately (~3-8 min).
- Wash sections (3x 5 min) in 1x PBS. To enhance signal, osmicate using 0.04% osmium tetroxide (OsO4; approximately 30 s).
- Wash sections (3x 5min) in 1x PBS.
- Dehydrate tissue in a graded series of ethanol 50% (1x 5min), 70% (1x 5min), 95% (2x 5min), 100% (2x 5 min), and 100% xylene (1x 5min). Allow xylenes to evaporate.
- Mount sections with toluene-based rapid dry mounting media. Formulations that contain anti-oxidants are recommended to prevent stain bleaching. Remove excess mounting media from slide edges with a razor for subsequent storage.
5. MRI/Pathology Correlations
NOTE: For correlating MRI with pathology, we first perform ex vivo MRI of the long-fixed intact brain hemisphere (step 2.9 above) in an adjustable box with MRI-visible markers indicating slicing slots. We then slice the brain and photograph the 1 cm slices to enable co-registration of in situ MRIs to the individual brain slices. We can then perform MRI-guided analyses, where regions of interest (ROIs) are identified on MRI to direct tissue analysis. We can also perform histopathology-guided analyses, where ROIs are identified on tissue (e.g., white matter lesions, white matter without demyelination, etc.) and then characterized by the co-localized MRI measures (Table 1).
- Identification of MRI-based ROIs
NOTE: In previous studies, we have identified ROIs in white matter11,12,13,14,15 and gray matter16,17,18. The example below is for white-matter analysis.- Segment T2 hyperintense lesions on in situ MRIs (from step 1.1), initially processed by an automatic algorithm, and then corrected manually by experienced users.
- Segment T1 hypointense lesions within T2 lesions as voxels with a signal intensity less than or equal to 80% of the signal intensity of the surrounding normal-appearing brain tissue.
- Segment hypointense areas in magnetization transfer ratio (MTR) maps with an 80% threshold.
- Create three classifications using the above segmentations: (a) T2-only lesions which are abnormal on T2-weighted/FLAIR scans but normal on T1-weighted or MTR scans, (b) T2T1MTR lesions, which are abnormal on all T2-weighted/FLAIR, T1-weighted, and MTR scans; and (c) normal-appearing white matter (NAWM), which are normal on all T2-weighted/FLAIR, T1-weighted, and MTR scans.
NOTE: Our selection of slices is based on the existence of all three regions-of-interest types (T2-only, T2T1MTR, and NAWM) on the same slices. - Calculate normalized intensities for each ROI to minimize variability arising from different brains and different brain locations.
- Co-registration of in situ MRI to brain slices
- Scan the fixed brain hemisphere in a custom slicing box with four rows of MRI-sensitive markers localizing the slots where a knife can be inserted to slice the brain. Perform a T1-weighted 3D MPRAGE acquisition with 1 mm isotropic resolution covering the fixed brain and all of the markers.
NOTE: This is called post-fixation MRI and is only used as an intermediate step for co-registration of the in situ MRIs to the brain slices. - Immediately after scanning, slice the brain hemisphere in slots located 1 cm apart, resulting in approximately 15 slices.
- Photograph the brain slices on both the anterior and posterior sides.
- Co-register the in situ MRI and photographs of brain slices with the following steps.
- For segmentation of post-fixation and in situ MPRAGE, pre-process both post-fixation and in situ MPRAGE MRIs for intensity non-uniformity19.
- Segment the brain and four rows of markers from preprocessed post-fixation MPRAGE.
- Segment the hemisphere corresponding to the post-fixation MRI20,21 from the pre-processed in situ MPRAGE.
- Co-register the brain-extracted in situ and post-fixation MRIs through a series of linear registration processes up to 12 degrees-of-freedom (affine registration) using FSL FLIRT22. The scaling and shearing components account for the effect of fixation shrinkage.
- Find the slicing plane’s normal direction by minimizing the sum of maximum projected intensities using the segmented markers. These re-orientation angles are incorporated in the transformation matrix obtained from the previous step.
- Visually match MRI images to photographs of fixed posterior brain slices using an in-house image viewer that allows for changing the depth and orientation of the normal vectors. Small modifications are needed because the brain slicing is imperfect.
- Apply AFFINE image transformation13 for each slice to transform the in situ MRIs to the same slicing locations as the photographs of the brain slices.
- For segmentation of post-fixation and in situ MPRAGE, pre-process both post-fixation and in situ MPRAGE MRIs for intensity non-uniformity19.
- Scan the fixed brain hemisphere in a custom slicing box with four rows of MRI-sensitive markers localizing the slots where a knife can be inserted to slice the brain. Perform a T1-weighted 3D MPRAGE acquisition with 1 mm isotropic resolution covering the fixed brain and all of the markers.
Results
As mentioned above, almost half of the cerebral hemisphere is frozen and available for molecular studies using DNA, RNA, or protein. Historically, studies using postmortem brain tissues have been shown to be affected by pre-mortem conditions, age, sex, tissue pH, mRNA integrity (RIN), postmortem interval (PMI), diagnostic certainty, comorbidsubstance use, and prior medication treatment status23. Based on studies using brain tissues, DNA and protein appears to be affected by lesser extent as compared to RNA. Based on our experience, RNA isolation and downstream analysis have, however, been found to be most affected by the pre-mortem conditions and postmortem interval of the brain tissue. We therefore discuss some of the conditions to be followed for conducting RNA based analysis using postmortem MS tissues.
For all our studies, after the brain is collected at autopsy, it is sliced (1 cm thick) and then either fixed in 4% paraformaldehyde for morphological studies or rapidly frozen for biochemical analysis. All tissue blocks are characterized for demyelination by immunostaining using PLP as described above. A representative analysis scheme is shown in Figure 1. Tissue sections are examined for the presence of white-matter lesions (Figure 1A). Selected regions are stained for immune activity (Figure 1B) and demyelination (Figure 1C). The frozen tissue is mounted on the cryostat (Figure 1D) and frozen 30 µm sections are cut. This is followed by collection of 3-4 subsequent sections, separation from the adjoining tissues, and storage for DNA, RNA, or protein isolation. Using this protocol, we have successfully isolated DNA24, 25, RNA5,6,7,8,9 as well as proteins26. While major findings from some of the studies analyzing RNA from MS brains are discussed, here are some of the issues related to analysis of RNA postmortem MS brains.
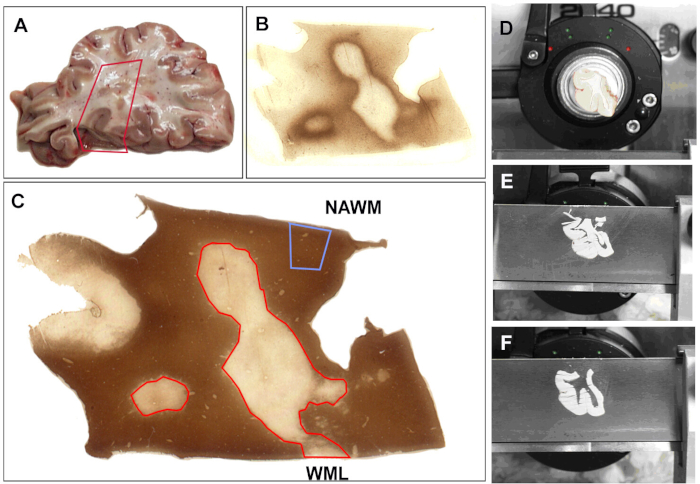
Figure 1: Sample collection for mRNA analysis. (A) Autopsy tissue is selected for analysis. Areas of tissue are selected and a portion of tissue is excised. All sections are stained with (B) MHC-II (Major histocompatibility complex (MHC) class II HLA-DR CR3/43) antibody to detect inflammatory activity and with (C) proteolipid protein (PLP) to determine myelin status using published protocols. Based on the myelin status, the block is scored by a scalpel (D). Sections (60 µm) are cut (E) and the areas that have been previously scored are removed, separated in tubes, and labeled (F). PLP and MHC-II stains are repeated after every 5 sections to ensure proper collection of tissue. Normal appearing white matter (NAWM) is noted and white matter lesions (WML) are outlined in red. Please click here to view a larger version of this figure.
Axonal transection in the lesions of MS10. An initial scientific focus of this program was on the characterization of cellular components of demyelinated white-matter lesions. Among the antigens localized was non-phosphorylated neurofilaments (NFs). Most NFs are phosphorylated in myelinated axons. Upon demyelination, axons are dephosphorylated. We detected the expected expression of non-phosphorylated NFs in demyelinated axons. In acute MS lesions, many of these demyelinated axons ended as axonal retraction bulbs (Figure 2A), which reflect the proximal ends of transected axons. Transected axons exceed 11,000 mm3 in the acute lesions compared to adjacent normal regions10. These observations helped catalyze a paradigm shift in MS research that moved the field toward characterizing neurodegeneration as the major cause of permanent neurological disability in individuals with MS.
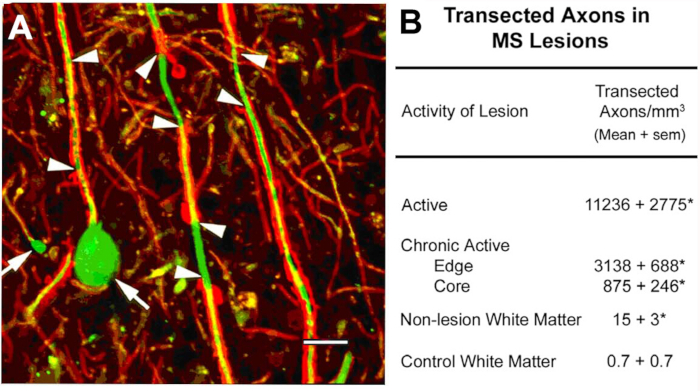
Figure 2: Axonal transection during inflammatory demyelination. Axonal transection occurs during inflammatory demyelination (A, arrowheads) and induces formation of terminal axonal ovoids (A, arrows). When quantified (B), transected axons are abundant in MS lesions and appear to correlate with inflammatory activity of the lesion. Panel A reproduced from Trapp et al.10 with permission. Red: proteolipid protein, green: Anti nonphosphorylated neurofilament. Please click here to view a larger version of this figure.
Remyelination in chronic MS brains3. Remyelination can be robust during early stages of MS. Many chronic MS lesions, however, are not remyelinated. We investigated whether the presence of oligodendrocyte progenitor cells (OPCs) or the generation of new oligodendrocytes limits remyelination of chronically demyelinated white-matter lesions. While OPC density was often decreased, they were present in all chronically-demyelinated lesions3. Newly-generated oligodendrocytes were also present in many chronic MS lesions. Oligodendrocyte processes associated with, but did not myelinate demyelinated axons (Figure 3). These studies indicate that OPCs and their ability to produce new oligodendrocytes are not limiting remyelination of chronic white-matter lesions. We hypothesized that the chronically-demyelinated axons, which often appeared dystrophic, were not receptive to remyelination by newly-produced oligodendrocytes.
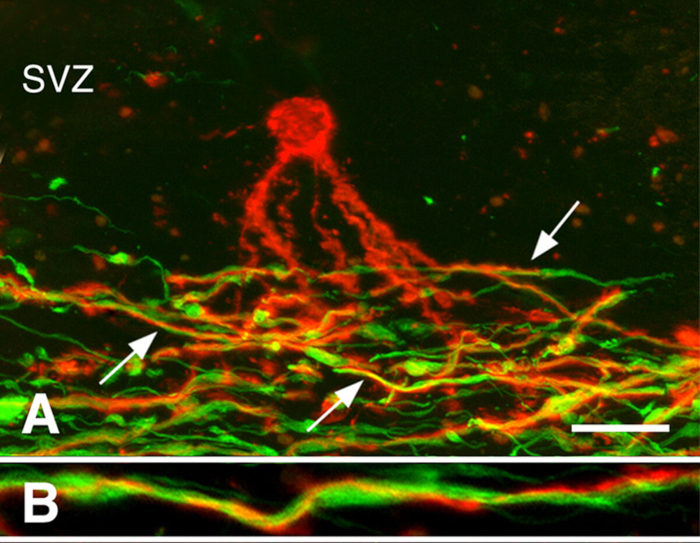
Figure 3: Processes of pre-myelinating oligodendrocytes associated with axons. Confocal micrographs of MS lesions stained with PLP antibodies (red in Panels A, B) and neurofilament antibodies (green in Panels A, B) are shown. A pre-myelinating oligodendrocyte (red in Panel A) in the subventricular zone (SVZ) extended processes into the region of demyelinated axons (green in Panel A) in a chronic MS lesion. Many of these processes (arrows in Panel A) spiraled around axons, as shown at higher magnification (Panel B). Scale bars represent 20 µm (A) and 5 µm (B). Reproduced from Chang et al.3 with permission. Please click here to view a larger version of this figure.
Mitochondrial dysfunction in MS6. We performed an unbiased search for neuronal gene changes in rapidly-frozen motor cortex obtained from chronic MS patients (Figure 4A). An unbiased search of this data set identified significant reductions in 23 nuclear-encoded mitochondrial mRNAs in MS (Figure 4B). Credentialing studies using immunocytochemistry and in situ hybridization indicated that these genes were highly enriched in cortical projection neurons (Figure 4C) and that mitochondria isolated from projection axons display reduced glycolysis (Figure 4D). This paper catalyzed a focus on mitochondrial dysfunction and reduced ATP production as a major contributor to axonal degeneration in MS.
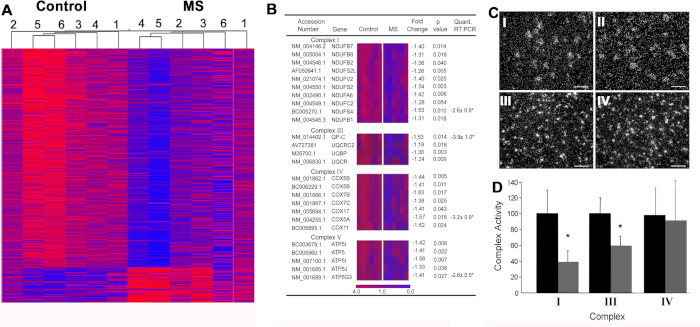
Figure 4: Microarray data and downstream validation techniques performed in MS motor cortex. (A) Hierarchical clustering of significantly altered transcripts from control (C1-C6) and SPMS (MS1-MS6) motor cortex samples, separately supporting disease-related gene expression patterns. Among the decreased transcripts in MS motor cortex, twenty-six belonged to the electron transport chain (B). Mitochondrial complex I (NDUFA6) mRNA was decreased in neurons (n = 55-130) in MS motor cortex (CII) compared to control (CI), whereas PLP mRNA densities were similar between control (CIII) and MS (CIV) cerebral cortex. Activity of electron transport complexes I and III were decreased in mitochondrial-enriched fractions from motor cortex of MS patients (n = 3) (D). Reprinted from Dutta et al.6 with permission. Error bars represent SEM; Scale bar in CI-IV are 25 µm. * p < 0.05 Students's t-test. Please click here to view a larger version of this figure.
Pathogenesis of cognitive dysfunction in MS8. Forty to 60% of MS patients have cognitive decline and reduced executive function. We identified the hippocampus, which is a functional site of memory/learning, as a common site for demyelination in MS. We next compared neuronal gene expression in myelinated and demyelinated hippocampi and found significant reductions in neuronal mRNAs encoding proteins involved in memory/learning. We extended these data by demonstrating that select microRNAs are increased in demyelinated hippocampus and that these microRNAs can decrease the expression of glutamate receptors. We have reproduced and extended these observations in rodent models. We next compared neuronal gene expression in myelinated and demyelinated hippocampi and found significant reductions in neuronal mRNA encoding proteins involved in memory/learning.

Figure 5: Tissue collection, histological analysis, and gene expression studies in MS hippocampus. Brain slices containing hippocampus are selected during autopsy (A) and the hippocampus and adjoining region is removed (red box) for further analysis. Immunostaining for PLP showed preservation of myelin in all control (B) and 40% of MS hippocampi (C). Extensive demyelination was detected in ~60% of MS hippocampi (D). When compared to control hippocampi (E, G, I), significant neuronal loss was not detected in CA1, CA3, or CA4 regions of demyelinated MS hippocampi (F, H, J) as shown by HuR immunohistochemistry. Double-labeling immunofluorescence for myelin (myelin basic protein (MBP), green) and axons (SMI32, red) showed loss of myelin (L) with relative preservation of axons (N) in MS demyelinated hippocampus compared to control hippocampus (MBP, K; SMI32, M). Dual clustering of mRNA expression levels arranged samples into discrete clusters based on myelin status (myelinated and demyelinated) and location (hippocampus vs. motor cortex) (O). High mRNA levels are indicated by red and blue denotes low expression levels. Panels C-O Adapted from Dutta et al.8 with permission. B-D: 2 mm, E-J: 100 µm, K-N: 50 µm. Please click here to view a larger version of this figure.
Pathological correlates of MRI changes12. While MRI is a valued indicator of MS diagnosis and response to treatment, and is also a predictor of MS disease progression, the pathological correlates of MRI changes are poorly understood. Our postmortem MRI studies have focused on two MRI ROIs. Cerebral white-matter ROIs that were only T2 hyperintense (T2 only) and ROIs that had a combination of T1 hypointensity, T2 hyperintensity, and reduced magnetization transfer ratio (MTR) (T2T1MTR). Approximately 45% of cerebral white-matter T2-only ROIs were myelinated, confirming their non-specific nature. In contrast, 83% of the T2T1MTR ROIs were chronically demyelinated and appeared as black holes. T1 and MTR values are semi-quantitative and their values varied extensively in the T2T1MTR ROIs. If loss of myelin is the only contributor to these MRI changes, then the values should be constant. Swollen demyelinated axons correlated with both T1 and MTR values.
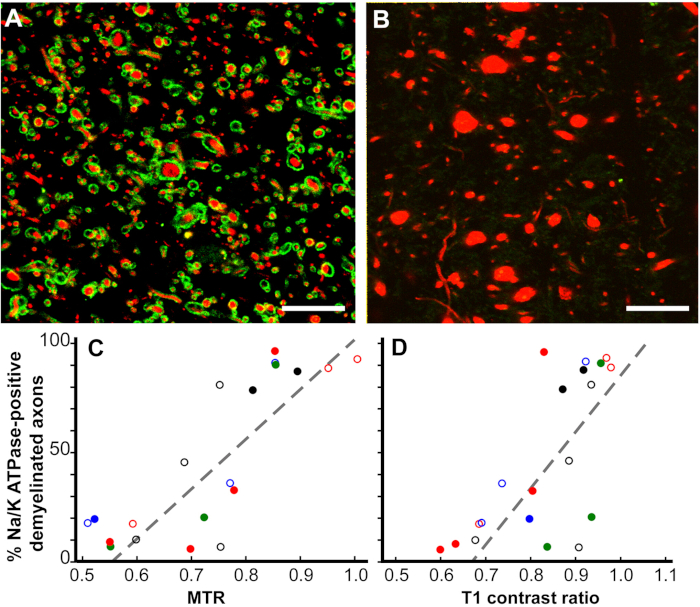
Figure 6: Magnetization transfer ratios (MTR) and T1 contrast ratios linearly correlate with the percentage of Na+/K+ ATPase-positive axons in chronic MS lesions. Chronically-demyelinated lesions stained for Na+/K+ ATPase (green) varied from nearly 100% (A) to zero (B) in neurofilament (red). Many axons without Na+/K+ ATPase had increased diameters (B). A comparison of the percentage of Na+/K+ ATPase-positive axons in chronically-demyelinated MS lesions correlated with quantitative postmortem MTR (p < 0.0001, C) and T1 contrast ratios (p < 0.0006, D). Each data point is from a single lesion and each unique color-symbol combination denotes one of the brains studied. Scales bars = 5 µm. Reproduced from Young et al.12 with permission. Please click here to view a larger version of this figure.
Neurodegeneration independent of demyelination11. Historically, neurodegeneration in MS has been thought to result from demyelination. Brain imaging studies, however, have raised the possibility that neurodegeneration and demyelination can be independent events. We recently identified a subpopulation of MS patients that have demyelination of the spinal cord and cerebral cortex, but not of the cerebral white matter. We coined this MS subtype as myelocortical MS (MCMS). MCMS cases provided a platform to investigate the relationship between cerebral white-matter demyelination and cortical neuronal loss. Compared to control cortices, cortical neuronal loss was significantly greater in MCMS cortices than in typical MS cortices. Control brain tissue was obtained from the Pathology Department at the Cleveland Clinic. This study provides the first pathological evidence for neurodegeneration in the absence of demyelination.
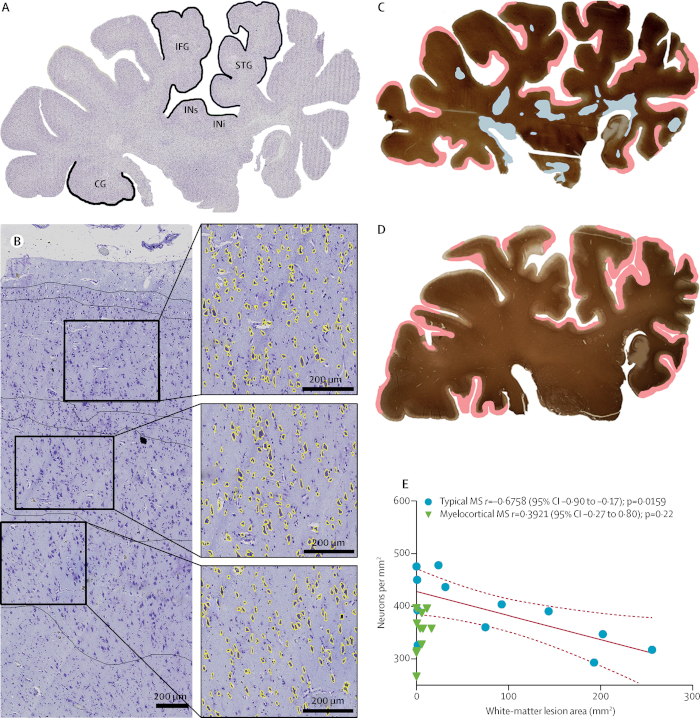
Figure 7: Neuronal loss in the absence of cerebral white-matter demyelination. A cresyl violet -stained coronal hemispheric section from an individual classed as having typical MS (A). Neuronal densities were compared in cortical layers III, V, and VI in each of the five labelled areas. Neurons with an area greater than 60 µm2 (yellow) are shown in a representative image from the superior temporal cortex (B). Labelling for PLP and the distribution of demyelinated lesions (white-matter demyelination is highlighted in blue; subpial demyelination is highlighted in pink) in hemispheric sections from individuals with typical MS (C) and myelocortical MS (D) are shown. A significant correlation between reduced cortical neuronal density and increased cerebral white-matter lesion volume was found in typical MS, but not in myelocortical MS (E); dashed lines indicate 95% confidence interval (CI). IFG = inferior frontal gyrus. STG = superior temporal gyrus. INi = inferior insula. INs = superior insula. CG = cingulate gyrus. Reproduced from Trapp et al.11 with permission. Please click here to view a larger version of this figure.
| Sequence Duration | Sequence Description | Sequence use |
| 0:09 | Localizer | Localization for subsequent sequences |
| 9:14 | 3D Magnetization prepared rapid gradient echo (MPRAGE) | Structural Imaging Volumetric estimation of brain structures |
| 5:14 | 3D Fluid attenuated inversion recovery (FLAIR) | Lesion identification Lesion segmentation Volumetric lesion assessment |
| 2:35 | 2D T2 weighted | Lesion identification Lesion segmentation Volumetric lesion assessment |
| 5:12 | 3D gradient-recalled echo with magnetization transfer pre-pulse , (MT-ON) | Purported measure of myelin content in normal appearing and lesional tissue |
| 5:12 | 3D gradient-recalled echo without magnetization transfer pre-pulse , (MT-OFF) | |
| 0:27 | Diffusion Tensor Imaging (DTI) field mapping | Measure of water diffusion in brain tissue thought to reflect brain tissue integrity. |
| 10:27 | Diffusion Tensor Imaging (DTI) multi-shell | |
| 1:18 | Diffusion Tensor Imaging (DTI) multi-shell | |
| 39:48:00 | SUBTOTAL: CORE |
Table 1: Postmortem imaging protocol.
Discussion
We describe a protocol that has been used to rapidly procure and process tissue from over 150 individuals with MS. An important feature of this protocol is that the scientists that utilize the tissue are also in charge of establishing the protocol and performing the tissue collection. This provides flexibility in meeting the scientific needs of individual research projects. Several aspects of this protocol enhance its utility. The patients are usually well-characterized prior to death, as many of them have been followed by neurologists at our center. A critical step is the processing of tissue donations soon after death, which increases the quality of the frozen tissue compared to some other brain banks. This enables molecular studies that are of great value in describing changes in transcriptional and translational gene products, which are essential for substantiation of histological and immunocytochemical observations. Leveraging of morphological/immunocytochemical and molecular data across multiple cases enhances the reliability of conclusions. This is best illustrated by our description of mitochondrial gene changes in cerebral cortex and neuronal gene changes in demyelinated hippocampi. Novel gene profiling protocols are being developed at a rapid rate and the frozen tissue in our bank should provide high-quality RNA for tissue and single-cell analysis.
Another valued aspect of our protocol is the short-fixed brain slices. These tissues are cut into 30 µm-thick, free-floating sections. These sections are ideal for using confocal microscopy to analyze two or more antigens in three dimensions. Good examples include the interaction of pre-myelinating oligodendrocyte processes with dystrophic axons in chronic MS lesions, as well as the identification of single axonal connections to transected axonal retraction bulbs. This is in contrast to the routine use of 7 µm-thick paraffin sections, where 3D images are not feasible. Paraffin-embedded tissues have great value for some questions, especially the quantification of neuronal densities in hemispheric 7 µm-thick sections. Our tissue processing protocols, therefore, are diverse and provide flexibility to assure fixed and rapidly-frozen tissues.
Another unique feature of our protocol is the postmortem in situ brain MRI. Brain MRIs are an irreplaceable biomarker of MS disease. It is essential, therefore, to establish the pathological correlates of abnormal MRI signals. Our studies established that both T2 only and T2T1MTR ROIs are often myelinated. This finding supports the need for more specific imaging modalities that reliably distinguish between myelinated and demyelinated cerebral white matter. MRI appears to be sensitive for detection of myelin, but our studies demonstrate that even a combination of T1/T2/MTR is not specific for identifying myelination. Our postmortem protocol provides an ideal platform for testing the ability of new imaging modalities to distinguish between myelinated and demyelinated cerebral white matter. MRI also provides the ideal vehicle for translation of basic science results into clinical practice, given the use of MRI in our translational research and its widespread clinical use in living patients.
While cutting short- and long-fixed as well as frozen slices offers an advantage for processing tissue in multiple modes for different studies, there are some limitations with this method. Evaluating the entirety of a structure may be limited as portions of it may be processed differently on adjacent slices. The large volume of the tissue bank, however, offers the ability to investigate a structure of interest in multiple subjects to improve sampling. Another general limitation to studies utilizing postmortem tissues is that they are cross-sectional. Conclusions regarding timing and progression of changes need to be interpreted within this context. There may be a selection bias to patients that donate their tissues, which may limit generalization of data to all patients with MS. Since most donors die from complications of advanced MS, it may not be appropriate to extrapolate findings from these patients to those in earlier stages of MS. Nonetheless, we have received tissues from younger patients who died from non-MS-related conditions (i.e., acute myocardial infarction, drug overdose, suicide). The scope of our protocol does not include sampling of other organs (e.g., gastrointestinal and bone marrow) which have been implicated in MS. We believe that the strengths of the program greatly outweigh its limitations.
Disclosures
The authors declare no conflicts of interest.
Acknowledgements
The authors would also like to thank Dr. Christopher Nelson for editorial assistance. The autopsy program is supported in part by R35 grant NS097303 to BDT. Work in the laboratory of RD is supported by grants from NINDS (NS096148) and the National Multiple Sclerosis Society, USA (RG 5298).
Materials
| Name | Company | Catalog Number | Comments |
|---|---|---|---|
| Antibodies | |||
| Biotinylated goat anti-mouse IgG | Vector Laboratories | BA-9200 | 1:500 dilution for hemispheric; 1:1,000 for 30µm free-floating. RRID: AB_2336171 |
| Biotinylated goat anti-rabbit IgG | Vector Laboratories | BA-1000 | 1:500 dilution. |
| Biotinylated goat anti-rat IgG | Vector Laboratories | BA-9400 | 1:500 dilution for hemispheric; 1:1,000 for 30µm free-floating. RRID: AB_2336208 |
| Glial fibrillary acid protein (GFAP) | Dako | Z0334 | 1:700 dilution for hemispheric. RRID: AB_10013382 |
| HuR, mouse IgG, 3A2 clone | Santa Cruz | SC-5261 | 1:500 for 30µm free floating. RRID: AB_627770 |
| Major histocompatibility complex (MHC) class II HLA-DR CR3/43 | Dako | Mo746 | 1:250 dilution for hemispheric; 1:500 for 30 µm free floating. RRID: AB_2313661 |
| Non-phosphorylated neurofilament (SMI32) | Biolegend | 801701 | 1:5,000 dilution for hemispheric; 1:2,500 for 30 µm free-floating. RRID: AB_2564642 |
| Phosphorylated neurofilament (SMI31) | Biolegend | 801601 | 1:5,000 dilution for hemispheric; 1:2,500 for 30 µm free-floating. RRID: AB_2564641 |
| Proteolipid protein (PLP) | Gift from Wendy Macklin | 1:250 dilution for IHC; alternative anti-PLP antibodies commercially available. | |
| Reagents | |||
| 125 mm filter paper | Whatman | 1452-125 | For filtering PFA. |
| 50% Glutaraldehyde | Electron Microscopy Sciences | 16320 | Electron microscopy grade. |
| Cytoseal | ThermoScientific | 8310-16 | |
| Ethylene glycol | Fisher Chemical | BP230-4 | |
| Glycerol | Sigma-Aldrich | G7893 | 400 mL/2 L Cryoprotection solution. |
| Millex-HV Syringe Filter Unit, 0.45 µm, PVDF, 33 mm, gamma sterilized | Millipore-Sigma | SLHV033RB | |
| Paraformaldehyde | Electron Microscopy Sciences | 19200 | Prills form. |
| Polyvinylpyrolidone (PVP-40) | Fisher Chemical | BP220-212 | |
| Sodium azide | Fisher Chemical | S227I | 2 g/2 L Sorenson's buffer. |
| Sodium phosphate dibasic | Sigma-Aldrich | S0876 | 98.8 g/2 L Sorenson's buffer. |
| Sodium phosphate mono basic monohydrate | Sigma-Aldrich | S9638 | 14.352 g/2 L Sorenson's buffer. |
| Sucrose | Sigma-Aldrich | PVP40-500G | |
| VectaStain ABC Kit | Vector Laboratories | PK-6100 | 1:1,000 dilution of A and B. RRID: AB_2336819 |
| Waterproof drawing black ink | Higgins | 44201 | |
| Xylene | Fisher Chemical | X3S | Histological grade. |
| Equipment | |||
| 3T MRI Magnetom Prisma | Siemens Healthineers | ||
| 7T MRI Agilent 830AS | Siemens Healthineers |
References
- Trapp, B. D., Nave, K. A. Multiple sclerosis: an immune or neurodegenerative disorder? Annual Review of Neuroscience. 31, 247-269 (2008).
- Chang, A., Nishiyama, A., Peterson, J., Prineas, J., Trapp, B. D. NG2-positive oligodendrocyte progenitor cells in adult human brain and multiple sclerosis lesions. Journal of Neuroscience. 20, 6404-6412 (2000).
- Chang, A., Tourtellotte, W. W., Rudick, R., Trapp, B. D. Premyelinating oligodendrocytes in chronic lesions of multiple sclerosis. New England Journal of Medicine. 346, 165-173 (2002).
- Chang, A., et al. Neurogenesis in the chronic lesions of multiple sclerosis. Brain. 131, 2366-2375 (2008).
- Chang, A., et al. Cortical remyelination: A new target for repair therapies in multiple sclerosis. Annals of Neurology. 72, 918-926 (2012).
- Dutta, R., et al. Mitochondrial dysfunction as a cause of axonal degeneration in multiple sclerosis patients. Annals of Neurology. 59, 478-489 (2006).
- Dutta, R., et al. Activation of the ciliary neurotrophic factor (CNTF) signalling pathway in cortical neurons of multiple sclerosis patients. Brain. 130, 2566-2576 (2007).
- Dutta, R., et al. Demyelination causes synaptic alterations in hippocampi from multiple sclerosis patients. Annals of Neurology. 69, 445-454 (2011).
- Dutta, R., et al. Hippocampal demyelination and memory dysfunction are associated with increased levels of the neuronal microRNA miR-124 and reduced AMPA receptors. Annals of Neurology. 73, 637-645 (2013).
- Trapp, B. D., et al. Axonal transection in the lesions of multiple sclerosis. New England Journal of Medicine. 338, 278-285 (1998).
- Trapp, B. D., et al. Cortical neuronal densities and cerebral white matter demyelination in multiple sclerosis: a retrospective study. Lancet Neurology. 17, 870-884 (2018).
- Young, E. A., et al. Imaging correlates of decreased axonal Na+/K+ ATPase in chronic multiple sclerosis lesions. Annals of Neurology. 63, 428-435 (2008).
- Fisher, E., et al. Imaging correlates of axonal swelling in chronic multiple sclerosis brains. Annals of Neurology. 62, 219-228 (2007).
- Moll, N. M., et al. Imaging correlates of leukocyte accumulation and CXCR4/CXCL12 in multiple sclerosis. Archieves of Neurology. 66, 44-53 (2009).
- Moll, N. M., et al. Multiple sclerosis normal-appearing white matter: pathology-imaging correlations. Annals of Neurology. 70, 764-773 (2011).
- Nakamura, K., Chen, J. T., Ontaneda, D., Fox, R. J., Trapp, B. D. T1-/T2-weighted ratio differs in demyelinated cortex in multiple sclerosis. Annals of Neurology. 82, 635-639 (2017).
- Chen, J. T., et al. Clinically feasible MTR is sensitive to cortical demyelination in MS. Neurology. 80, 246-252 (2013).
- Nakamura, K., Fox, R., Fisher, E. CLADA: cortical longitudinal atrophy detection algorithm. Neuroimage. 54, 278-289 (2011).
- Sled, J. G., Zijdenbos, A. P., Evans, A. C. A nonparametric method for automatic correction of intensity nonuniformity in MRI data. IEEE Transactions of Medical imaging. 17, 87-97 (1998).
- Fisher, E., Cothren, J. R. M., Tkach, J. A., Masaryk, T. J., Cornhill, J. F. Knowledge-based 3D segmentation of the brain in MR images for quantitative multiple sclerosis lesion tracking. Proc. SPIE 3034, Medical Imaging. , 19-25 (1997).
- Avants, B. B., Epstein, C. L., Grossman, M., Gee, J. C. Symmetric diffeomorphic image registration with cross-correlation: evaluating automated labeling of elderly and neurodegenerative brain. Medical Image Analysis. 12, 26-41 (2008).
- Jenkinson, M., Bannister, P., Brady, M., Smith, S. Improved optimization for the robust and accurate linear registration and motion correction of brain images. Neuroimage. 17, 825-841 (2002).
- Lewis, D. A. The human brain revisited: opportunities and challenges in postmortem studies of psychiatric disorders. Neuropsychopharmacology. 26, 143-154 (2002).
- Chomyk, A. M., et al. DNA methylation in demyelinated multiple sclerosis hippocampus. Scientific Reports. 7, 8696(2017).
- Huynh, J. L., et al. Epigenome-wide differences in pathology-free regions of multiple sclerosis brains. Nature Neuroscience. , (2014).
- Ishii, A., et al. Human myelin proteome and comparative analysis with mouse myelin. Proceedings of the National Academy of Sciences. U. S. A. 106, 14605-14610 (2009).
Reprints and Permissions
