This article presents a modified cochlear surface preparation method that requires decalcification and use of a cell and tissue adhesive to adhere the pieces of cochlear epithelia to 10 mm round cover slips for immunohistochemistry in adult mouse cochleae.
Method Article
Cochlear Surface Preparation in the Adult Mouse
In This Article
Summary
Abstract
Auditory processing in the cochlea depends on the integrity of the mechanosensory hair cells. Over a lifetime, hearing loss can be acquired from numerous etiologies such as exposure to excessive noise, the use of ototoxic medications, bacterial or viral ear infections, head injuries, and the aging process. Loss of sensory hair cells is a common pathological feature of the varieties of acquired hearing loss. Additionally, the inner hair cell synapse can be damaged by mild insults. Therefore, surface preparations of cochlear epithelia, in combination with immunolabeling techniques and confocal imagery, are a very useful tool for the investigation of cochlear pathologies, including losses of ribbon synapses and sensory hair cells, changes in protein levels in hair cells and supporting cells, hair cell regeneration, and determination of report gene expression (i.e., GFP) for verification of successful transduction and identification of transduced cell types. The cochlea, a bony spiral-shaped structure in the inner ear, holds the auditory sensory end organ, the organ of Corti (OC). Sensory hair cells and surrounding supporting cells in the OC are contained in the cochlear duct and rest on the basilar membrane, organized in a tonotopic fashion with high-frequency detection occurring in the base and low-frequency in the apex. With the availability of molecular and genetic information and the ability to manipulate genes by knockout and knock-in techniques, mice have been widely used in biological research, including in hearing science. However, the adult mouse cochlea is miniscule, and the cochlear epithelium is encapsulated in a bony labyrinth, making microdissection difficult. Although dissection techniques have been developed and used in many laboratories, this modified microdissection method using cell and tissue adhesive is easier and more convenient. It can be used in all types of adult mouse cochleae following decalcification.
Introduction
The cochlea is dedicated to the detection of sound and responsible for hearing. The cochlear duct is coiled in a spiral shape in the bony labyrinth and holds the auditory sensory end organ, the organ of Corti (OC). The OC rests on the basilar membrane, making up the cochlear epithelium, with a length of about 5.7 mm when uncoiled in adult CBA/CaJ mice1,2. Because the OC is tonotopically organized with high frequencies detected in the base and low frequencies in the apex, the cochlear epithelium is often divided into three parts for analytical comparisons: the apical, middle, and basal turns corresponding to low, middle, and high frequency detection, respectively. In addition to an array of supporting cells, the OC is composed of one row of inner hair cells (IHCs) located medially and three rows of outer hair cells (OHCs) located laterally with respect to the cochlear spiral.
Correct auditory processing depends on the integrity of the sensory hair cells in the cochlea. Damage to or loss of sensory hair cells is a common pathological feature of acquired hearing loss, caused by numerous etiologies such as exposure to excessive noise, the use of ototoxic medications, bacterial or viral ear infections, head injuries, and the aging process3. Additionally, the integrity and function of the inner hair cell/auditory nerve synapses can be impaired by mild insults4. With the availability of molecular and genetic information and manipulation of genes by knockout and knock-in techniques, mice have been widely used in hearing science. Although the adult mouse cochlea is minuscule and the cochlear epithelium is surrounded by a bony capsule resulting in technically difficult microdissections, surface preparations of the epithelium in combination with immunolabeling or immunohistochemistry and confocal imagery have been broadly used for investigation of cochlear pathologies, including losses of ribbon synapses and hair cells, changes in levels of proteins in sensory hair cells and supporting cells, and hair cell regeneration. Cochlear surface preparations have also been used to determine the pattern of expression of reporter genes (i.e., GFP) and confirm successful transduction and identify transduced cell types. These techniques have been previously used for the study of molecular mechanisms underlying noise-induced hearing loss using adult CBA/J mice5,6,7,8,9.
Unlike immunohistochemistry using paraffin sections or cryosections to obtain small cross-sectional portions of the cochlea that contain three outer hair cells (OHCs) and one inner hair cell (IHC) on each section, cochlear surface preparations allow visualization of the entire length of the OC for counting sensory hair cells and ribbon synapses and immunolabeling of sensory hair cells corresponding to specific functional frequencies. Table 1 shows the mapping of hearing frequencies as a function of distance along the length of the cochlear spiral in adult CBA/J mouse according to studies from Muller1 and Viberg and Canlon1,2. Cochlear surface preparations have been widely used for investigation of cochlear pathologies4,5,6,7,8,9,10,11,12,13,14,15. The whole-mount cochlear dissection method was originally described in a book edited by Hans Engstrom in 196616. This technique was subsequently refined and adapted to a variety of species as described in the literature by a number of scientists in hearing science10,11,12,13,15,17 and by the Eaton-Peabody Laboratories at Massachusetts Eye and Ear18. Recently, another cochlear dissection method was reported by Montgomery et al.19. Microdissection of the cochlea is an essential and critical step for cochlear surface preparations. However, dissecting mouse cochleae is a technical challenge and requires considerable practice. Here, a modified cochlear surface preparation method is presented for use in adult mouse cochleae. This method requires decalcification and use of cell and tissue adhesive (i.e., Cell-Tak) to adhere the pieces of cochlear epithelium to 10 mm round coverslips for immunolabeling. Cell and tissue adhesive has been widely used for immunohistochemistry20. This modified cochlear microdissection method is relatively simple compared to those previously reported18,19.
Protocol
All research protocols involving male adult CBA/J mice at the ages of 10–12 weeks and C57BL/6J mice at the ages of 6–8 weeks were approved by the Institutional Animal Care and Use Committee (IACUC) at the Medical University of South Carolina (MUSC). Animal care was under the supervision of the Division of Laboratory Animal Resources at MUSC.
NOTE: For the procedures presented below, mice are anesthetized with ketamine (100 mg/kg) and xylazine (10 mg/kg) via intraperitoneal injections. Mice are decapitated after the animal no longer responds to painful stimuli, such as a toe pinch.
1. Extraction of Temporal Bones
- Decapitate the mouse immediately postmortem with surgical scissors (17 cm long) and cut the skull bone with scissors from the posterior aspect forward along the center line of the skull after exposing the skull bone by pulling the skin anteriorly.
- Remove the brain tissue using forceps and manually remove the temporal bones with the thumb and index finger for mice three months of age or older. Use small surgical scissors (11 cm long) to cut the temporal bone of mice younger than three months old.
- Put the temporal bone into a Petri dish (30 mm in diameter) containing ice-cold fresh 4% paraformaldehyde (PFA) solution dissolved in phosphate-buffered saline (PBS), pH 7.4.
NOTE: Prepare fresh 4% PFA solution and adjust the pH to 7.4 just before fixing the temporal bones, because improper pH balancing of the PFA solution will decrease the quality of the immunolabeling.
2. Fixation and Perfusion
- Remove the stapes from the oval window and puncture the round window membrane with size #5 forceps. Under a stereo dissection microscope make a small hole into the apex of the cochlea using a 27 G needle connected to a 1 mL syringe.
- Gently and slowly perfuse the cochlea with 4% PFA solution via the round and oval windows until the solution washes out of the small hole at the apex. Transfer the cochlea (one or two cochleae per vial) to 20 mL volume scintillation vials containing 10 mL of 4% PFA solution.
- Gently agitate the scintillation vials at room temperature (RT) for 2 h and leave overnight in a refrigerator (4 °C) on a rotator.
NOTE: The time of fixation can be adjusted depending on the antibody used. For example, limiting the fixation to 1.5 h will allow for successful immunolabeling of post synaptic terminals when using the GluA 2 antibody.
3. Decalcification of the Temporal Bone
- Remove the PFA solution and wash the cochleae with fresh PBS 3x for 5 min each.
- Add 20 mL of 4% ethylenediaminetetraacetic acid disodium salt (EDTA) solution (pH 7.4) to the scintillation vials and keep in a refrigerator for 48–72 h on a rotator with gentle agitation. Change the EDTA solution daily until the cochleae are decalcified. Check if the cochleae are decalcified by touching the bony vestibular portion with forceps to assess for elasticity or simply cut a small piece from the edge of the vestibular portion. If such cut results in a crushed piece, the cochlea is not decalcified.
NOTE: The EDTA solution may interfere with the immunoreaction of primary antibodies depending on the solution concentration. Prepare 4% EDTA in PBS and adjust the pH to 7.4. For consistent decalcification of temporal bones, fresh EDTA solution is used. - Change the solution to PBS for microdissection after decalcification is complete.
NOTE: If the cochleae are not sufficiently decalcified, dissection of the cochleae cannot be performed.
4. Microdissection of the Cochlear Epithelium
NOTE: Once decalcification is complete, microdissection of cochlear epithelium for immunolabeling needs to be performed as soon as possible. In a clean 30 mm Petri dish containing PBS, the inner ear is oriented in the following manner: in reference to the Petri dish's top (lid) and bottom, the cochlear round and oval windows face the top. In reference to dissector, the cochlear portion is oriented toward the front (away from dissector) and vestibular portion toward the back (near dissector). The following describes the steps in detail.
- Hold the vestibular portion of the temporal bone with forceps and cut the apical turn with the scalpel at a 45° angle as indicated by the red line (Figure 1a).
- Cut vertically along the faint line between the round window and the oval window, as indicated by the red line (Figure 1b) to separate the cochlea from the vestibular portion (Figure 1c).
NOTE: This cochlear portion contains the middle, basal, and hook portions of the epithelium. - Place the cochlear portion with the basal turn toward the bottom and the middle turn toward the top of the Petri dish and cut the bony capsule and lateral wall of the middle turn toward the end from which the apical section was removed, as indicated by the red line (Figure 1d,e).
- Continue cutting to completely separate the middle portion from the basal and hook regions (Figure 1f,g).
NOTE: The hook region of the cochlea is the end of the cochlear epithelium corresponding to sensitivity to tones 48 kHz and higher in mice. - Put the basal and hook portion with the basilar membrane site oriented toward the bottom of the dish and vertically cut the modiolus off the hook region to remove the modiolus as indicated by the vertical red line (Figure 1g).
NOTE: The modiolus is the conical-shaped central axis of the cochlea that consists of spongy bone and cochlear nerve as well as the spiral ganglion. It may be preferable to perform this cut with scissors. - Cut the basal and hook regions as the other red line indicates in Figure 1g to separate the hook portion (Figure 1h).
NOTE: The cochlea has now been separated into apical, middle, basal, and hook portions. The next steps will be the final dissection of each of the individual turns, using the middle turn as an example. - Cut away the relatively large portions of bony capsule and lateral wall tissue of the middle turn as indicated by the red line (Figure 1i).
NOTE: The lateral wall of the cochlear duct is formed by the spiral ligament and the stria vascularis. - Hold the lateral wall with forceps to align the bony capsule and lateral wall with the bottom of the Petri dish and cut these tissues from the basilar membrane side. Then flatten the specimen to orient the sensory hair cell surface side up. Trim away the rest of the bony capsule and lateral wall (Figure 1j).
- Remove the tectorial membrane using forceps to completely separate the middle region (Figure 1k).
- Repeat steps 4.7−4.9 for the final dissections of the remaining turns or regions as shown in Figure 1l.
- Prepare a 10 mm round coverslip for adhesion of the sensory epithelium. Use a pipette to hand-spread 0.5 µL of cell and tissue adhesive on the center of the round coverslip. After drying (3–5 min at RT), put the coverslips in PBS in Petri dishes.
- Stick all four pieces of the sensory epithelium on the 10 mm round coverslip in the Petri dish. Then hold one edge of the coverslip to transfer it to a four-well dish for immunolabeling or immunohistochemistry (Figure 1m).
NOTE: Figure 2 illustrates the location of the major cuts.
5. Immunolabeling for Cochlear Synapses
NOTE: The protocol for immunolabeling for cochlear synapses followed in this study has been previously described13. Presynaptic ribbons were labeled with a CtBP2 antibody (mouse anti-carboxyl-terminal binding protein 2 IgG1, labeling the B domain of the RIBEYE scaffolding protein). Post synaptic terminals were labeled with GluA2 antibody (mouse anti-glutamate receptor 2 IgG2a, labeling subunits of the AMPA receptor).
- Wash the sensory epithelium with PBS 3x for 5 min each wash in a four-well dish and then add 2 mL of 2% nonionic surfactant (i.e., Triton-X 100) into the dish for 30 min at RT on a rotator.
- Remove the nonionic surfactant solution from the dish using a pipette and add 100 µL of blocking solution containing 10% normal goat serum to each well for 1 h on a rotator with gentle agitation at RT.
- Remove the blocking solution from each well, wash with PBS 3x for 5 min each wash under gentle agitation at RT.
- Add 100 µL of the primary antibodies diluted with PBS to each well: mouse anti-GluA2 IgG2a (1:2,000), mouse anti-CtBP2 IgG1 (1:400). Cover each four-well dish with its lid and place into a large humidified container that protects from light. Incubate at 37 °C for 24 h.
NOTE: As an option, rabbit anti-myosin VIIa (1:400) for immunolabeling sensory hair cells can be added. - Wash 3x with PBS for 5 min each wash with gentle agitation at RT.
- Add 100 µL of the secondary antibodies Alexa 594 goat anti-mouse IgG1a (1:1,000), Alexa 488 goat anti-mouse IgG2a (1:1,000) diluted with PBS to each well. Cover each four-well dish with its lid and place into a large humidified container that protects from light. Incubate at 37 °C for 2 h.
NOTE: If myosin VIIa is used, add Alexa 350 goat anti-rabbit (1:200). - Wash 3x with PBS for 5 min. Then, transfer the 10 mm round coverslip onto a slide with the samples on top.
- Carefully add 8 µL of Fluoro-Gel with Tris buffer into the center of the coverslip. Then hold the edge of another 10 mm round coverslip with forceps to mount on top, sandwiching the two coverslips together.
- Use nail polish to seal the slides, put them in a cardboard slide folder, and store in the refrigerator.
NOTE: If some Fluoro-Gel leaks out between the coverslips during mounting, clean the edges of the coverslips before sealing the slide with nail polish. Confocal images need to be taken within 7 days.
Results
Surface preparations of the cochlear epithelium, in combination with immunolabeling and confocal imaging, have been used broadly in hearing science for the investigation of cochlear pathologies, such as quantification of ribbon synapses, sensory hair cells, and protein expression in sensory hair cells5,6,7,8. Although the dissection of adult mouse cochleae for surface preparations is not simple, new graduate students are able to learn this modified method after practicing with 10–15 ears (Figure 1 and Figure 2). With this technique, in combination with immunolabeling for CtBP2 (a marker for presynaptic ribbons) and GluA2 (a marker for post synaptic terminals), counting IHC/auditory nerve synapses using confocal images under Z projections with 0.25 µm intervals, based on the size of mouse ribbon synapses, is possible21. This is consistent with published results4,6,13. Surface preparations of CBA/J mice (without treatment) at the age of 10–12 weeks immunolabeled with CtBP2 (red) and GluA2 (green) showed that both presynaptic ribbons and post synaptic terminals are located below the IHC nuclei and are juxtaposed, indicating functional synapses (Figure 3)6,13.
By immunolabeling surface preparations with different antibodies, assessment of molecular signaling and structure in sensory hair cells is possible. For example, Figure 4 shows the results for immunolabeling for myosin VIIa and counterstaining with phalloidin and 4’,6-diamidino-2-phenylindole (DAPI). Parallel immunolabeling experiments with and without the cell and tissue adhesive using identical solutions have been conducted to assess if the adhesive used interferes with the immunoreactions. Cochlear surface preparations were immunolabeled with myosin VIIa and counterstained with phalloidin. Confocal images were taken with a 63x magnification lens under identical conditions and equal parameter settings for laser gains and photomultiplier tube (PMT) gains. There was no difference in immunoreactions or uniformity with and without the cell and tissue adhesive (Figure 5). Using different fixatives, surface preparations have provided the basis for scanning electron microscopy (SEM) images for visualization of cochlear stereocilia9. C57BL/6J mice (without treatment) at the age of 6–8 weeks show well-organized V-shaped stereocilia of OHCs in three rows (Figure 6). Additionally, cochlear surface preparations have been used to determine the pattern of expression of a report gene (i.e., GFP) and confirm successful transduction and identify transduced cell types.

Figure 1: Depiction of the steps for adult mouse surface preparations. (a) The cochlear bony capsule of the temporal bone faces up. The red line indicates the first cut to separate the apical turn. RW = round window, OW = oval window. (b) The apex is separated from the cochlea as indicated by the arrow. The red line between round window and oval window indicates the second cut made in the cochlea. (c) The cochlear portion that contains the middle, basal, and hook regions is separated from the vestibular portion. (d) The cochlear portion is situated facing up. The red line indicates the third cut, directed towards the end from which the apical section was removed. (e) The arrow indicates the gap left after the completion of the third cut. (f) This image shows the middle region. (g) This image shows the combined basal and hook regions. The vertical red line indicates the cut between the modiolus and hook region. The cut between the basal and hook regions is indicated by the other red line. (h) Basal and hook regions are separated as indicated by the arrows. (i) The middle region of the bony capsule is cut as indicated by the red line. (j) The image shows the middle region after one side of the bony capsule is removed. (k) This image shows the middle region after completion of dissection. (l) All four regions are completely dissected. (m) Cochlear turns affixed to a 10 mm round coverslip transferred to a four-well Petri dish with the four regions as indicated. All images were taken under a stereo-dissection microscope at 1.2x, 2.5x, and 0.6x magnifications. Scale bars are indicated in each image. Please click here to view a larger version of this figure.

Figure 2: Location of the major cuts. The entire cochlear bony capsule was removed. The locations of the major cuts are indicated. 1) The location where the apical turn is cut. 2) The site where the middle turn is separated. 3) The critical cut to remove the modiolus. 4) The line to divide the basal and hook regions. Scale bar = 0.5 mm. Please click here to view a larger version of this figure.

Figure 3: Confocal images reveal immunolabeling for CtBP2 and GluA2 on adult mouse surface preparations. The apical, middle, and basal regions are labelled. The lower magnification confocal images were taken with a 10x lens. Red = CtBP2, green = GluA2. Scale bar = 100 µm. Confocal images of 5-, 16-, and 32-kHz regions were taken with a 63x lens. Enlarged views of the areas indicated by the white rectangles in the apex, middle, and base portions. Scale bar = 10 µm. Please click here to view a larger version of this figure.
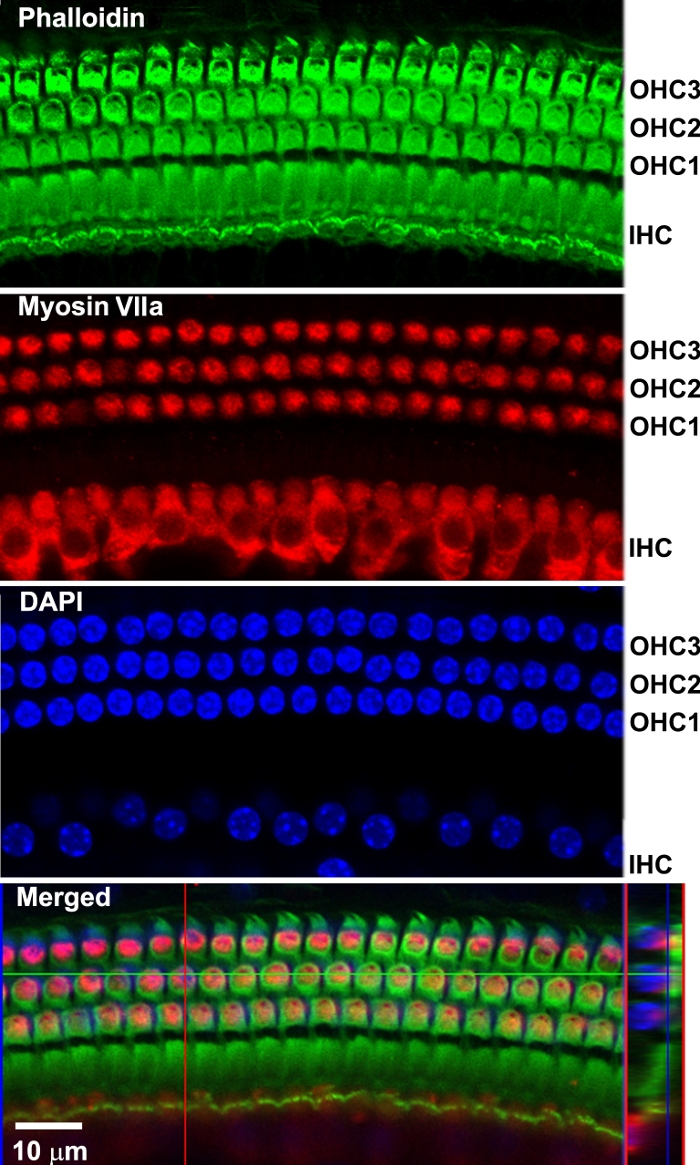
Figure 4: Confocal images reveal immunolabeling of sensory hair cells of a surface preparation from the 32-kHz region. All images were merged Z-stack projections. Phalloidin (green) stained the structure of the three rows of OHCs and one row of IHCs. Myosin VIIa (red) immunolabeled three rows of OHCs and one row of IHCs. DAPI-stained hair cell nuclei. Merged confocal images were reconstructed for side views of sensory hair cells. Scale bar = 10 µm. Please click here to view a larger version of this figure.

Figure 5: Cochlear surface preparations with and without the cell and tissue adhesive were processed in parallel, immunolabeled for myosin VII (red), and counterstained with phalloidin (green) using identical solutions. The cell and tissue adhesive used does not interfere with immunoreactions. Confocal images were taken with a 63x magnification lens under identical conditions and equal parameter settings. Images were taken from the 32 kHz region. Immunolabeling for myosin VIIa and staining for phalloidin in OHCs was similar with and without the cell and tissue adhesive. Scale bar = 10 µm. Please click here to view a larger version of this figure.

Figure 6: Scanning electron microscopy shows three rows of OHC stereocilia from C57BL/6J mice. Images were taken from the middle region. (a) A low-magnification view of three rows of OHCs. (b) Enlarged images show three rows of well-organized OHC stereocilia that appear in “V” shapes. Scale bar = 10 µm. Please click here to view a larger version of this figure.
| Name | ||||||||
| Distance from the apex (mm) | 0.4 | 1 | 2.4 | 3.3 | 3.9 | 4.7 | 5.7 | |
| Distance from the apex (%) | 7.7 | 18 | 43 | 54 | 68 | 82 | 100 | |
| Frequencies (kHz) | 6 | 8 | 16 | 22 | 32 | 48 | ||
Table 1: Mapping of the CBA/J mouse cochlear frequency sensitivity as a function of distance from the apex according to Muller1 and Viberg and Canlon2.
Discussion
Cochlear microdissection of whole-mount surface preparations in combination with immunolabeling provides a basic tool for investigation of inner ear pathologies and molecular mechanisms. This modified adult mouse cochlear dissection method using the cell and tissue adhesive simplifies this difficult procedure.
Although this modified cochlear surface preparation method is relatively easy and accessible, it still requires practice in order to achieve proficiency. To make the correct cuts, the dissector needs careful concentration. Because the cochlear sensory hair cells in the basal turn are so close to the spiral limbus, it is difficult to fully remove the limbus tissue to allow the surface preparation to lie completely flat, but confocal Z-projections can compensate for this issue. Additionally, the hook region of the cochlea is still the most difficult portion to dissect. Separations between OHCs and IHCs of the hook region may occur. The hook region displays large anatomic variations in humans and is important for bone-conduction hearing22,23. Based on the cochlear frequency mapping reported by Muller1 and Viberg and Canlon2, the hook region, beginning around 4.7 mm from the apex, corresponds to sensitivity to 48 kHz tones and higher (Table 1), whereas auditory functional assessments of acquired hearing loss in mice, including noise-induced, aminoglycoside-induced hearing loss, and age-related hearing loss, are generally measured at 8, 16, and 32 kHz with auditory brainstem response (ABR)5,6,7,9,24 and from 6–45 kHz with distortion product otoacoustic emission (DPOAE)25. In agreement with Montgomery et al., distortion of the epithelium is not commonly seen when the spiral is divided into 3–4 pieces19.
The modified method presented here involves dissecting the cochlear spiral into only four pieces (apex, middle, basal turns, and the hook region), whereas the Eaton-Peabody technique produces six pieces18. The Eaton-Peabody technique starts with a cochlear bisection, which avoids making tangential cuts through the epithelium to first separate the apical turn from the rest of the spiral, as described in this modified technique. By producing smaller pieces, the Eaton-Peabody technique is designed to minimize the flattening required to view a large piece with an immersion objective. In fact, the larger portions of tissue facilitate measurement of frequency mapping from the apical to the basal turn, in line with Montgomery et al.19. Additionally, a difference between this method and Montgomery et al.19 is that the modified cochlear dissection method described here employs a scalpel for most cuts and only one step is done with scissors (i.e., the separation of basal and hook regions as illustrated in the third cut in Figure 2), whereas Montgomery et al.19 used scissors with a silicone elastomer-coated dissection dish for surface preparations. To avoid distortion of the tissue, disconnection of the basilar membrane to remove the modiolus is critical.
This protocol uses a cell and tissue adhesive (Table of Materials) for adhesion of the pieces of cochlear epithelium to the 10 mm round coverslip for immunolabeling or immunohistochemistry, which makes the processes more convenient and avoids loss of epithelium tissues during the multiple washes of immunolabeling procedures. Cell and tissue adhesive is a formulation of polyphenolic proteins that adheres to cells and tissues and has been widely used in many common in-vitro techniques, including immunohistochemistry, in-situ hybridization, and immunoassays20. Consistent with the notion that the cell and tissue adhesive does not interfere with immunoreactions, parallel immunolabeling of myosin VIIa with surface preparations shows no difference of immunoreactions or uniformity with and without the cell and tissue adhesive. Comparing these three dissection methods (Eaton-Peabody Laboratories, Montgomery et al.19, and the modified method described), the graduate students in the lab agree that this modified method using the cell and tissue adhesive is easier to learn and master.
In summary, producing whole-mount adult mouse surface preparations is a basic skill for evaluation of cochlear pathologies. The described modified protocol for adult mice surface preparations simplifies this difficult procedure.
Disclosures
The authors have nothing to disclose.
Acknowledgements
The research project described was supported by grant R01 DC009222 from the National Institute on Deafness and Other Communication Disorders, National Institutes of Health. This work was conducted in the WR Building at MUSC in renovated space supported by grant C06 RR014516. Animals were housed in MUSC CRI animal facilities supported by grant C06 RR015455 from the Extramural Research Facilities Program of the National Center for Research Resources. The authors thank Dr. Jochen Schacht for his valuable comments and Andra Talaska for proofreading of the manuscript.
Materials
| Name | Company | Catalog Number | Comments |
|---|---|---|---|
| 10 mm Rund Coverslips | Microscopy products for science and industry | 260367 | |
| Alexa Fluor 488 Goat Anti-mouse IgG2 | Thermo Fisher Scientific | A-21131 | |
| Alexa Fluor 488 Phalloidin | Thermo Fisher Scientific | A12379 | |
| Alexa Fluor 594 Goat Anti-mouse IgG1 | Thermo Fisher Scientific | A-21125 | |
| Alexa Fluor 594 Goat Anti-rabbit IgG (H+L) | Thermo Fisher Scientific | A11012 | |
| Carboard Micro Slide Trays | Fisher Scientific | 12-587-10 | |
| Cell-Tak | BD Biosciences | 354240 | |
| Corning Petri Dishes | Fisher Scientific | 353004 | |
| DAPI | Thermo Fisher Scientific | 62247 | |
| Dumont #5 Forceps | FST fine science tools | 11251-20 | |
| EDTA Disodium Salt | Sigma-Aldrich | E5134 | |
| Fluoro-gel with Tris Buffer | Electron Microscopy Sciences | 17985-10 | |
| Four-well Cell Culture Dishes | Greiner Bio-One | 627170 | |
| Goat Anti-myosin VIIa Antibody | Proteus Biosciences | 25-6790 | |
| Microscope Slides | Fisher Scientific | 12-544-7 | |
| Mouse Anti-CtBP2 Antibody | BD Biosciences | #612044 | |
| Mouse Anti-Glu2R Antibody | Millipore | MAB397 | |
| Normal Goat Serum | Thermo Fisher Scientific | 31872 | |
| Paraformaldehyde | Sigma-Aldrich | 441244 | |
| Phosphate Buffered Saline | Fisher Scientific | BP665-1 | |
| Scalpel | VWR | 100491-038 | |
| Triton X-100 | Sigma-Aldrich | X100-500ML | |
| Vannas Spring Scissors | Fine Science Tools | 15001-08 |
References
- Muller, M., von Hunerbein, K., Hoidis, S., Smolders, J. W. A physiological place-frequency map of the cochlea in the CBA/J mouse. Hearing Research. 202 (1-2), 63-73 (2005).
- Viberg, A., Canlon, B. The guide to plotting a cochleogram. Hearing Research. 197 (1-10), (2004).
- Sha, S. H., Schacht, J. Emerging therapeutic interventions against noise-induced hearing loss. Expert Opinion on Investigational Drugs. 26 (1), 85-96 (2017).
- Kujawa, S. G., Liberman, M. C. Adding insult to injury: cochlear nerve degeneration after "temporary" noise-induced hearing loss. Journal of Neuroscience. 29 (45), 14077-14085 (2009).
- Chen, F. Q., Zheng, H. W., Hill, K., Sha, S. H. Traumatic Noise Activates Rho-Family GTPases through Transient Cellular Energy Depletion. Journal of Neuroscience. 32 (36), 12421-12430 (2012).
- Hill, K., Yuan, H., Wang, X., Sha, S. H. Noise-Induced Loss of Hair Cells and Cochlear Synaptopathy Are Mediated by the Activation of AMPK. Journal of Neuroscience. 36 (28), 7497-7510 (2016).
- Xiong, H. Inhibition of Histone Methyltransferase G9a Attenuates Noise-Induced Cochlear Synaptopathy and Hearing Loss. Journal of Association for Research in Otolaryngology. 20 (3), 217-232 (2019).
- Yuan, H., et al. Autophagy attenuates noise-induced hearing loss by reducing oxidative stress. Antioxidant & Redox Signaling. 22 (15), 1308-1324 (2015).
- Wang, X. Mitochondrial Calcium Transporters Mediate Sensitivity to Noise-Induced Losses of Hair Cells and Cochlear Synapses. Frontiers in Molecular Neuroscience. 11, 469(2018).
- Bohne, B. A., Harding, G. W. Processing and analyzing the mouse temporal bone to identify gross, cellular and subcellular pathology. Hearing Research. 109 (1-2), 34-45 (1997).
- Jiang, H., Sha, S. H., Forge, A., Schacht, J. Caspase-independent pathways of hair cell death induced by kanamycin in vivo. Cell Death & Differentiation. 13 (1), 20-30 (2006).
- Johnsson, L. G., Hawkins, J. E. Sensory and neural degeneration with aging, as seen in microdissections of the human inner ear. Annals of Otology, Rhinology, and Laryngology. 81 (2), 179-193 (1972).
- Wan, G., Gomez-Casati, M. E., Gigliello, A. R., Liberman, M. C., Corfas, G. Neurotrophin-3 regulates ribbon synapse density in the cochlea and induces synapse regeneration after acoustic trauma. Elife. 3, (2014).
- Wang, L. Targeting HDAC with a novel inhibitor effectively reverses paclitaxel resistance in non-small cell lung cancer via multiple mechanisms. Cell Death & Disease. 7, 2063(2016).
- Weber, T., et al. Rapid cell-cycle reentry and cell death after acute inactivation of the retinoblastoma gene product in postnatal cochlear hair cells. Proceedings of the National Academy of Sciences of the United States of America. 105 (2), 781-785 (2008).
- Engström, H., Ades, H. W., Andersson, A. Structural pattern of the organ of Corti: a systematic mapping of sensory cells and neural elements. , Almqvist & Wiksell. Stockholm, Sweden. (1966).
- Hawkins, J. E., Linthicum, F. H., Johnsson, L. G. Cochlear and vestibular lesions in capsular otosclerosis as seen in microdissection. Annals of Otology, Rhinology, and Laryngology Supplement. 87, Pt 3 Suppl 48 1-40 (1978).
- MassEyeAndEar.org. , https://www.masseyeandear.org/research/otolaryngology/eaton-peabody-laboratories (2019).
- Montgomery, S. C., Cox, B. C. Whole Mount Dissection and Immunofluorescence of the Adult Mouse Cochlea. Journal of Visualized Experiments. (107), (2016).
- Corning Cell Culture Surfaces. , https://www.corning.com/catalog/cls/documents/brochures/CLS-C-DL-006.pdf (2019).
- Nouvian, R., Beutner, D., Parsons, T. D., Moser, T. Structure and function of the hair cell ribbon synapse. The Journal of Membrane Biology. 209 (2-3), 153-165 (2006).
- Atturo, F., Barbara, M., Rask-Andersen, H. On the anatomy of the 'hook' region of the human cochlea and how it relates to cochlear implantation. Audiology and Neurootology. 19 (6), 378-385 (2014).
- Kim, N., Steele, C. R., Puria, S. The importance of the hook region of the cochlea for bone-conduction hearing. Biophysical Journal. 107 (1), 233-241 (2014).
- Zheng, H. W., Chen, J., Sha, S. H. Receptor-interacting protein kinases modulate noise-induced sensory hair cell death. Cell Death & Disease. 5, 1262(2014).
- Brown, L. N., et al. Macrophage-Mediated Glial Cell Elimination in the Postnatal Mouse Cochlea. Frontiers in Molecular Neuroscience. 10, 407(2017).
Reprints and Permissions
