The protocol describes a novel in vivo mouse model of spinal implant infection where a stainless-steel k-wire implant is infected with bioluminescent Staphylococcus aureus Xen36. Bacterial burden is monitored longitudinally with bioluminescent imaging and confirmed with colony forming unit counts after euthanasia.
Method Article
In Vivo Mouse Model of Spinal Implant Infection
In This Article
Erratum Notice
Important: There has been an erratum issued for this article. View Erratum Notice
Summary
Abstract
Spine implant infections portend poor outcomes as diagnosis is challenging and surgical eradication is at odds with mechanical spinal stability. The purpose of this method is to describe a novel mouse model of spinal implant infection (SII) that was created to provide an inexpensive, rapid, and accurate in vivo tool to test potential therapeutics and treatment strategies for spinal implant infections.
In this method, we present a model of posterior-approach spinal surgery in which a stainless-steel k-wire is transfixed into the L4 spinous process of 12-week old C57BL/6J wild-type mice and inoculated with 1 x 10³ CFU of a bioluminescent strain of Staphylococcus aureus Xen36 bacteria. Mice are then longitudinally imaged for bioluminescence in vivo on post-operative days 0, 1, 3, 5, 7, 10, 14, 18, 21, 25, 28, and 35. Bioluminescence imaging (BLI) signals from a standardized field of view are quantified to measure in vivo bacterial burden.
To quantify bacteria adhering to implants and peri-implant tissue, mice are euthanized and the implant and surrounding soft tissue are harvested. Bacteria are detached from the implant by sonication, cultured overnight and then colony forming units (CFUs) are counted. The results acquired from this method include longitudinal bacterial counts as measured by in vivo S. aureus bioluminescence (mean maximum flux) and CFU counts following euthanasia.
While prior animal models of instrumented spine infection have involved invasive, ex vivo tissue analysis, the mouse model of SII presented in this paper leverages noninvasive, real time in vivo optical imaging of bioluminescent bacteria to replace static tissue study. Applications of the model are broad and may include utilizing alternative bioluminescent bacterial strains, incorporating other types of genetically engineered mice to contemporaneously study host immune response, and evaluating current or investigating new diagnostic and therapeutic modalities such as antibiotics or implant coatings.
Introduction
The purpose of this method is to describe a novel mouse model of spinal implant infection (SII). This model was designed to provide an inexpensive and accurate tool to flexibly assess the effect of host, pathogen, and/or implant variables in vivo. Testing potential therapeutics and treatment strategies for spinal implant infections in this model is aimed at guiding research development prior to application in larger animal models and clinical trials.
Implant related infection after spine surgery is a devastating complication and unfortunately occurs in approximately 3–8% of patients undergoing elective spine surgery1,2,3,4,5 and up to 65% of patients undergoing multilevel or revision surgery6. Treatment of spinal implant infections often requires multiple hospitalizations, multiple surgeries, and prolonged antibiotic therapy. SIIs portend poor patient outcomes including neurological compromise, disability, and an increased risk of mortality. Management of SII is extremely expensive, costing upwards of $900,000 per patient7.
Staphylococcus aureus is the most common virulent pathogen of SII8,9,10,11. Bacteria can seed the hardware directly during surgery, through the wound during the postoperative period, or later via hematogenous spread. In the presence of metal implants, S. aureus form biofilm that protects the bacteria from antibiotic therapy and immune cells. While removal of infected hardware may help effectively eradicate an infection, this is frequently not feasible in the spine without causing destabilization and risking neurologic compromise12.
In the absence of explanting infected hardware, novel approaches are needed to prevent, detect, and treat SII. Historically, there have been limited animal models of SII to efficiently assess the safety and efficacy of novel therapies. Previous animal models of SII require large numbers of animals and collection of data points requiring euthanasia including colony counting, histology, and culture13,14,15. Lacking longitudinal in vivo monitoring, these models only provide one data point per animal and are therefore expensive and inefficient.
Previous work studying a mouse model of knee arthroplasty infection established the value and accuracy of noninvasive in vivo optical imaging to longitudinally monitor infection burden16. The detection of bioluminescence allows bacterial burden to be quantified over a longitudinal time course in a single animal humanely, accurately, and efficiently. Moreover, prior studies have demonstrated a high correlation between in vivo bioluminescence and CFUs adherent to implants17. The capacity to track infection over time, has led to a more nuanced understanding of implant related infection. In addition, monitoring longitudinal infection in this way, has allowed the effectiveness of antibiotic therapy and novel antimicrobials to be accurately assessed16,17,18.
Leveraging these tools, we developed and validated a model of postoperative spinal implant infection. In the method presented, we utilize an inoculum of bioluminescent S. aureus Xen36 to establish an in vivo mouse model of SII to longitudinally monitor bacterial burden16,17,18. This novel model provides a valuable tool to efficiently test potential detection, prevention, and treatment strategies for SII prior to their application in larger animal models and clinical trials.
Protocol
All animals were handled in strict accordance with good animal practice as defined in the federal regulations as set forth in the Animal Welfare Act (AWA), the 1996 Guide for the Care and Use of Laboratory Animals, PHS Policy for the Humane Care and Use of Laboratory Animals, as well as the institution’s policies and procedures as set forth in the Animal Care and Use Training Manual, and all animal work was approved by the University of California Los Angeles Chancellor’s Animal Research Committee (ARC).
1. S. aureus bioluminescent strain choice
- Use the bioluminescent S. aureus strain Xen36 as the inoculum of interest.
NOTE: This strain was derived from the parental strain S. aureus ATCC-49525, which is a clinical isolate from a septic patient. S. aureus Xen36 uniquely utilizes a luxABCDE operon, which is optimized and integrated into the host’s native plasmid.19 As a result, the Xen36 strain is capable of producing a blue-green bioluminescent light with a peak wavelength emission of 490 nm. This emission signal is only produced by living metabolically active bacterial organisms.
2. Preparation of S. aureus for inoculation
- Add 200 μg/mL kanamycin to Luria Broth plus 1.5% agar to isolate S. aureus Xen36 from potential contaminants, utilizing the kanamycin resistance gene linked to the lux operon19.
- Streak S. aureus Xen36 bacteria onto tryptic soy agar plates (tryptic soy broth [TSB] plus 1.5% agar) and incubate at 37 °C for 12-16 h.
- Isolate single colonies of S. aureus Xen36 and individually culture in TSB for 12-16 h at 37 °C in a shaking incubator (200 rpm).
- Dilute resultant culture at a 1:50 ratio.
- Culture for additional 2 h at 37 °C to isolate midlogarithmic phase bacteria.
- Pellet, resuspend, and wash bacteria in phosphate buffered saline (PBS) three times.
- Measure the absorbance at 600 nm. The ideal OD600 is between 0.700 and 0.750 which corresponds to 4x10⁵ CFU/mL. Perform serial dilutions to achieve desired bacterial inoculum (1 x 10³ CFU/2 µL).
NOTE: The optimal concentration of Xen36 for the establishment of a chronic infection was found to be 1 x 10³ CFU. Lower dosing of bacteria was cleared by the host immune system and higher dosing caused wound breakdown. Wound breakdown does not differentiate between a deep implant infection and a superficial wound infection and is therefore avoided in this model (Figure 1)20.
3. Mice
- Use 12-week old male C57BL/6J wild-type mice.
- House mice in cages with a maximum of 4 at a time.
- Keep water available at all times. Maintain a 12-hour light/dark cycle and do not perform experimentation during the dark phase of the cycle.
- Use alfalfa-free chow for feeding due to potential interference with fluorescent signaling.
- Have research or veterinary staff assess mice daily to ensure the well-being of the animals throughout the entirety of the experiment.
4. Mouse surgical procedures
- Induce anesthesia by placing mice in an isoflurane (2%) chamber for approximately 5 minutes. Confirm appropriate depth of anesthesia by monitoring respirations to remain rhythmic and slower than when awake and not changing in response to noxious stimuli (e.g., surgical manipulation, toe pinch).
- Transfer anesthetized mice to a preparation station and remove hair from the sacrum to the upper thoracic spine with rodent clippers.
- Clean and sterilize the skin with triple washes of alternating betadine solution and isopropyl alcohol.
- Transfer anesthetized and sterilized mice in the prone position to a sterile surgical bed maintaining anesthesia with administration of inhaled isoflurane (2%) via nose cone.
- Maximally flex the hips and identify the position of the knee at the level of the spine to approximate the lumbar 4 vertebral body.
- Make a longitudinal 2 cm incision through skin with a 15-blade surgical scalpel.
- Palpate the spinous processes to confirm midline and continue the incision down to bone.
- Dissect subperiosteally on the right side of the L4 spinous process, extending laterally to the transverse process.
- Pass an absorbable braided suture size 5-0 cephalad and caudad to the L4 body through the fascia and leave open, in preparation for future closure.
- Using a 25 G spinal needle, ream the spinous process of L4 using a 25 G spinal needle and insert a 0.1 mm diameter, 1 cm long “L-shaped” surgical grade stainless-steel implant along the lamina with the long arm laying cephalad.
- Inoculate the implant with 1 x 10³ CFUs/2 µL bioluminescent S. aureus Xen36, taking care to ensure all solution contacts the implant.
- Wait approximately 10 seconds before tying the previously passed absorbable suture following inoculation to ensure containment of inoculum on the implant.
- Close skin in running fashion with absorbable suture.
- Administer pain medicine via subcutaneous injection of buprenorphine (0.1 mg/kg) immediately postop and then every 12 hours for 3 days thereafter.
- Recover mice on a heating pad and monitor for return to normal activity.
- Obtain postoperative radiographs to confirm appropriate placement of implant.
5. Longitudinal In vivo bioluminescence imaging to measure bacterial burden
- Anesthetize mice with inhaled isoflurane (2%). Confirm appropriate depth of anesthesia by monitoring respirations to remain rhythmic and slower than when awake and not changing in response to noxious stimuli (e.g., surgical manipulation, toe pinch).
- Remove hair from the sacrum to the upper thoracic spine with rodent clippers.
- Load mice onto field of view of bioluminescent imaging platform to perform in vivo bioluminescence imaging (BLI)19.
- Capture bioluminescent signal over a 5 min acquisition time. Utilize large binning settings with a 15 cm field of view (B).
- Repeat steps 5.1-5.4 on postoperative days 0, 1, 3, 5, 7, 10, 14, 18, 21, 25, 28, and 35 (or other days based on specific experimental design) to monitor bacterial burden.
- Present BLI data via color scale and overlay on a grayscale photograph. Isolate a standard ovoid region of interest (ROI) using BLI software to quantify BLI in total flux (photons per second) or mean maximum flux (photons/second/centimeter2/steradian).
6. Quantify bacteria adherent to implants and surrounding tissue
- Euthanize mice on POD 35 or an alternative post-operative date of choice with exposure to carbon dioxide in accordance with AVMA Guidelines. Confirm euthanasia with secondary cervical dislocation.
- Sterilize the dorsal skin according to Step 4.3 and position the mouse prone on a sterile surgical field.
- Sharply incise the previous incision using a 15-blade surgical scalpel.
- Use sterile scissors to bluntly dissect to the L4 spinous process and identify the surgical implant.
- Use a needle driver to gently twist and remove the implant from its position in the L4 spinous process.
- Using sterile forceps and scissors, harvest approximately 0.1 g of spinous process bone and soft tissue immediately surrounding the surgical implant and place in 1 mL of PBS in small conical rhino tube with 4 sharp homogenizing beads.
- Record weight of soft tissue by weighing conical tube before and after harvest.
- Place the implant in 0.5 mL of 0.3% Tween-80 in TSB and sonicate for 15 min.
- Vortex the resulting implant suspension for 2 min and culture overnight for 12-16 h.
- Homogenize the soft tissue and spinous processes previously placed in 1 ml PBS surrounding the implant using homogenizer.
- Vortex the resulting soft tissue suspension for 5 min and culture overnight for 12-16 h.
- After overnight culture, count CFU from the implant and surrounding tissues, respectively. Express value as total CFU/g harvested for soft tissue and CFU/mL for sonicated implant.
Results
The procedure presented here was used to assess the efficacy of antibiotic regimens in an in vivo mouse model of SII. Specifically, the efficacy of combination vancomycin and rifampin antibiotic therapy was compared to vancomycin monotherapy and untreated infected controls.
Prior to surgery, mice were randomized to either combination therapy, monotherapy, or infected control. A statistical power analysis was performed to calculate sample size. Anticipated means of mean maximum flux 1 x 10⁵ ± 3.2 x 10⁴ and 1.4 x 10⁵ were used to determine sample size, which were calculated as N=10 in each group. Mice underwent surgical implantation, inoculation with S. aureus Xen36, and were measured for in vivo S. aureus bioluminescence on POD 0, 1, 3, 5, 7, 10, 14, 18, 21, 25, 28, and 35. On POD 35, mice were sacrificed and CFUs for implant-adherent and surrounding tissue bacteria were quantified.
Mice in the monotherapy group received a therapeutic dose of vancomycin (110 mg/kg twice daily) delivered subcutaneously. This dose was selected to approximate the area under the curve for typical human exposure for vancomycin21,22,23. Mice in the combination therapy group received a therapeutic subcutaneous dose of vancomycin (110 mg/kg twice daily) and rifampin (25 mg/kg daily)24. Mice in the infected control group received sham injections of sterile saline. Treatment for all groups was performed from postoperative days 7 to 14.
Effect of antibiotic therapy on BLI
Infected control mice had BLI signals peaking on POD 10 that remained above 1.0 x 10⁵ photons/s/cm2/sr until sacrifice, successfully modeling a chronic SII (Figure 2). Mice treated with vancomycin monotherapy had significantly lower BLI signal compared to infected control, with a 2-fold reduction from POD 10–21 (p<0.03). After POD 21, there was no significant difference in BLI between monotherapy and infected control groups. Mice treated with vancomycin-rifampin combination therapy had an even lower BLI signal, which was 20-fold lower than infected control on POD 10. A significant reduction persisted until POD 28 (p<0.01). After POD 28, there was no significant difference in BLI between groups. There was no significant difference in BLI between any of the three groups at final imaging on POD35.
CFUs from implants and surrounding tissue
Mice were sacrificed on POD 35. Implants and surrounding tissue were harvested and processed for CFU counting (Figure 3). No significant difference was observed in CFUs between infected control, monotherapy, or combination therapy groups.

Figure 1: Wound breakdown in high dose S. aureus Xen36 inoculum. Images of the dorsal skin of mice inoculated with S. aureus Xen36 during a spine implant infection. (A) Mouse inoculated with 1 x 10³ CFUs, and intact dorsal skin. (B) Mouse inoculated with 1 x 10⁴ CFUs, and evidence of considerable wound breakdown. Figure adapted and reprinted with permission from Dworsky et al.25 Please click here to view a larger version of this figure.
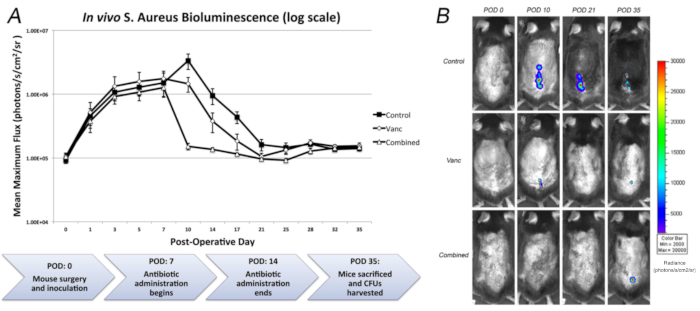
Figure 2: Measurement of bacterial burden using in vivo bioluminescence. 1 x 10³ CFU of S. aureus possessing the bioluminescent construct in a stable plasmid (Xen36) were inoculated into the L4 spinous process of mice (n = 10 mice per group) in the presence of a stainless-steel implant. (A) Bacterial counts as measured by in vivo S. aureus bioluminescence (mean maximum flux [photons/s/cm2/sr] ± sem [logarithmic scale]), with a flow diagram of the experimental protocol below. On POD 7, antibiotic administration began with vancomycin, a combination of vancomycin and rifampin or a sterile saline control. Antibiotic administration was stopped on POD 14. On POD 35, mice were sacrificed and CFUs from the implant and surrounding tissue were measured. (B) Representative in vivo S. aureus bioluminescence on a color scale overlaid on top of a grayscale image of mice. Figure adapted and reprinted with permission from Hu et al.25 Please click here to view a larger version of this figure.
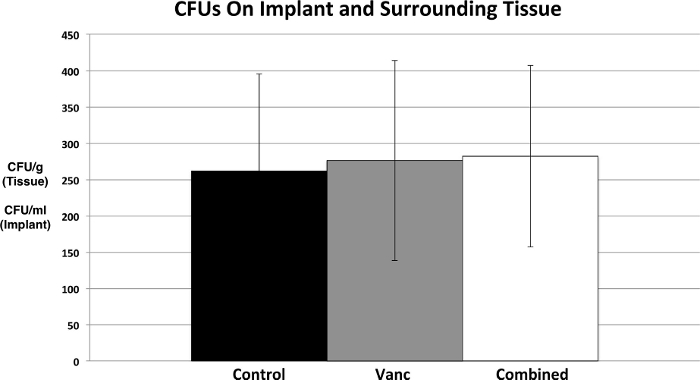
Figure 3: Confirmation of bacterial burden using CFU counts. At POD 35, mice were sacrificed, pins were sonicated, tissue was homogenized, and bacteria were cultured and counted. Figure adapted and reprinted with permission from Hu et al.25. Please click here to view a larger version of this figure.
Discussion
Implant related infections in the spine portend poor outcomes for patients1,2,3,4,5. Unlike many other areas in the body, infected hardware in the spine frequently cannot be removed due to the risk of instability and neurologic compromise. This unique challenge in the setting of biofilm bacteria resistant to systemic antibiotic therapy necessitate novel approaches to treatment12. Previous research in novel treatments for SII has been limited by expensive, inefficient animal models. To better study these infections and efficiently assess the efficacy of potential treatments, we developed a noninvasive longitudinal mouse model of SII using in vivo bioluminescence imaging.
Prior animal models of instrumented spine infection required ex vivo tissue analysis to evaluate results, requiring large cohorts and were unable to monitor infection over time13,14,26. In contrast, the mouse model of SII presented in this paper leverages BLI to reliably monitor bacterial burden over time16,17,18. This novel approach enables investigators to assess the response of bacteria and the host to antibiotics, coatings, or immune modulation.
Critical steps in the protocol include: appropriate preparation of Xen36 S. aureus and estimation of single inoculum 1 x 10³ CFUs/2 μL; precise surgical implantation, inoculation, and closure; in vivo bioluminescent imaging; and confirmation of bacterial burden using CFU counts.
Modifications to the model may include alternative bioluminescent bacterial strains, longer term time points, or the use of integration of other types of genetically engineered mice, such as those expressing green fluorescent protein in myeloid cells (Lys-EGFP) to contemporaneously measure neutrophil infiltration with in vivo fluorescence imaging20. Additional methodologies may be utilized to complement those described in the protocol to address processes such as vertebral osteolysis, disc degeneration, soft tissue infection, and implant biofilm infection. Techniques that provide quantitative outcomes in these processes may include but are not limited to: micro-computed tomography, magnetic resonance imaging, real time quantitative PCR, serology, histology, immunohistochemistry, and/or variable pressure scanning electron microscopy.
This model has several limitations. First, the model of spine surgery is a gross simplification compared to clinical practice. In contrast to extensive decompression and multilevel fusion surgeries typical of high-risk spine surgery patients, the model surgery involves minimal bone resection with a single stainless-steel implant. As clinical spine implants have multiple different materials, these may have different susceptibilities to bacterial infection and biofilm formation. In addition, as with all animal models, the host response to infection of mice is different than that of humans.
In the future, this model could be used to assess treatment of SII with other antibiotic delivery modalities including vancomycin powder, antibiotic loaded beads, or coated implants. In addition, this model may be used to study the mechanistic basis of the host response to SII.
Disclosures
The authors have no conflicts of interest to disclose.
Acknowledgements
The authors would like to acknowledge the receipt of both the Pediatric Orthopaedic Society of North America Biomet Spine Grant and the National Institutes of Health Clinical and Translational Science Institute KL2 Grant, and the HH Lee Surgical Research Grant as major funding sources for these experiments.
Materials
| Name | Company | Catalog Number | Comments |
|---|---|---|---|
| Analytical Balance ME104 | Mettler Toledo | 30029067 | 120 g capacity, 0.1 mg readability, backlit LCD, internal adjustment, metal base |
| BD Bacto Tryptic Soy Broth | Becton Dickinson (BD) | BD 211825 | BD Bacto Tryptic Soy Broth (Soybean-Casein Digest Medium) |
| Biomate 3S UV-VIS Spectrophotometer | Thermo Scientific | 840-208300 | Spectrophotometer; Thermo Scientific; BioMate 3S; Six-position cell holder; Spectral bandwidth: 1.8nm; Long-life xenon lamp; Store up to 40 test methods; 16L x 13W x 9 in. H; 19 lb.; 100/240V US line cord |
| Bioshield 720+ swinging bucket rotor | Thermo Scientific | 75003183 | Rotor, Swinging bucket; Thermo Scientific; BIOShield 720 high speed; Capacity: 4 x 180mL (0.72L); Angle: 90 deg. ; Max. speed/RCF: 6300rpm/7188 x g; Max. radius: 16.2cm |
| Branson Ultrasonics 2510R-MTH (Sonicator) | Branson Ultrasonics | CPX952217R | *similar model, our model is discontinued* Branson Ultrasonics MH Series Heated Ultrasonic Cleaning Bath, 120V, 0.75 gal |
| Bullet Blender Storm Homogenizer | Next Advance | BBY24M | The Bullet Blender Storm is the most powerful member of the Bullet Blender family. Homogenize up to 24 of your toughest samples (mouse femur, skin, cartilage, tumor, etc.) in just minutes. Air cooling™ minimizes sample heat up. Uses 1.5ml screw-cap RINO® tubes or snap-cap Eppendorf® Safe-lock™ tubes. |
| Germinator 500 | Electron Microscopy Sciences | 66118-10 | The Germinator 500 is designed to decontaminate metal micro-dissecting instruments only. It is to be used exclusively for research purposes. The Germinator 500 should not be used as a substitute for traditional methods of terminal sterilization. Effective sterilization cannot be assured due to lack of routine sterilization-efficacy monitoring methods for glass bead sterilization. The Germinator 500 has been designed and built to pass the Validation of Dry Sterilizer Spore Suspension Test: USP XXIII, Part 1211. |
| Heracell 150i CO2 Incubator | Thermo Scientific | 51026282 | Single 150L |
| IVIS Lumina X5 Imaging System | Perkin Elmer | CLS148590 | The IVIS Lumina X5 high-throughput 2D optical imaging system combines high-sensitivity bioluminescence and fluorescence with high-resolution x-ray into a compact system that fits on your benchtop. With an expanded 5 mouse field of view for 2D optical imaging plus our unique line of accessories to accelerate setup and labeling, it has never been easier or faster to get robust data—and answers—on anatomical and molecular aspects of disease. |
| MAXQ 4450 Digtial Incubating Bench Shaker | Thermo Scientific | SHKE4450 | Shaker, Incubated; Thermo Scientific; Digital; MaxQ 4450; Speed 15 to 500rpm +/-1rpm; 5 deg. C above ambient to 80 deg. C; 120V 50/60Hz |
| PBS, Phosphate Buffered Saline | Fisher Bioreagents | BP24384 | PBS, Phosphate Buffered Saline, 1X Solution, pH 7.4 |
| Sorvall Legend Micro 21 Centrifuge, Ventilated | Thermo Scientific | 75002436 | 24 x 1.5/2.0mL rotor with ClickSeal biocontainment lid |
| SORVALL LEGEND X1R 120V Centrifuge | Thermo Scientific | 75004261 | Centrifuge, Benchtop; Thermo Scientific; Sorvall Legend X1R (Refrigerated), 1L capacity; Max. Speed/RCF 15,200rpm/25,830 x g; CFC-free cooling -10C to +40C; 120V 60Hz |
| Staphylococcus aureus - Xen36 | Perkin Elmer | 119243 | Staphylococcus aureus - Xen36 bioluminescent pathogenic bacteria for in vivo and in vitro drug discovery. This product was derived from a parental strain from the American Type Culture Collection, used under license. Staph. aureus-Xen36 possesses a stable copy of the Photorhabdus luminescens lux operon on the native plasmid. |
| TUTTNAUER AUTOCLAVE 2540E 120V | Heidolph Tuttnauer | 23210401 | Sterilizer, Benchtop; Heidolph; Tuttnauer; Model 2540E; Self-contained design with refillable reservoir controls water purity for sterilization; 120V 50/60Hz; 1400w. With electronic controls |
| Tween 80 | Fisher Bioreagents | BP338-500 | Tween 80, Fisher BioReagents, Non-ionic detergent for selective protein extraction |
| Vortex mixer VX-200 | Labnet Internation | S0200 | 120V touch or continuous mixer, 230V: 0 - 2,850 rpm,120V: 0 - 3,400 rpm |
| 0.9% Sodium Chloride | Pfizer Injectables/Hospira | 00409-4888-10 | 0.9% Sodium Chloride Injection, USP |
References
- Verdrengh, M., Tarkowski, A. Role of neutrophils in experimental septicemia and septic arthritis induced by Staphylococcus aureus. Infection and Immunity. 65 (7), 2517-2521 (1997).
- Fang, A., Hu, S. S., Endres, N., Bradford, D. S. Risk factors for infection after spinal surgery. Spine. 30 (12), Phila Pa. 1460-1465 (2005).
- Levi, A. D., Dickman, C. A., Sonntag, V. K. Management of postoperative infections after spinal instrumentation. Journal of Neurosurgery. 86 (6), 975-980 (1997).
- Weinstein, M. A., McCabe, J. P., Cammisa, F. P. Postoperative spinal wound infection: a review of 2,391 consecutive index procedures. Journal of Spinal Disorders. 13 (5), 422-426 (2000).
- Picada, R., et al. Postoperative deep wound infection in adults after posterior lumbosacral spine fusion with instrumentation: incidence and management. Journal of Spinal Disorders. 13 (1), 42-45 (2000).
- Smith, J. S., et al. Rates of infection after spine surgery based on 108,419 procedures: a report from the Scoliosis Research Society Morbidity and Mortality Committee. Spine. 36 (7), Phila Pa. 556-563 (2011).
- Abbey, D. M., Turner, D. M., Warson, J. S., Wirt, T. C., Scalley, R. D. Treatment of postoperative wound infections following spinal fusion with instrumentation. Journal of Spinal Disorders. 8 (4), 278-283 (1995).
- Silber, J. S., et al. Management of postprocedural discitis. Spine Journal. 2 (4), 279-287 (2002).
- Pappou, I. P., Papadopoulos, E. C., Sama, A. A., Girardi, F. P., Cammisa, F. P. Postoperative infections in interbody fusion for degenerative spinal disease. Clinical Orthopaedics and Related Research. 444, 120-128 (2006).
- Sampedro, M. F., et al. A biofilm approach to detect bacteria on removed spinal implants. Spine. 35 (12), Phila Pa. 1218-1224 (2010).
- Pull ter Gunne, A. F., Mohamed, A. S., Skolasky, R. L., van Laarhoven, C. J., Cohen, D. B. The presentation, incidence, etiology, and treatment of surgical site infections after spinal surgery. Spine. 35 (13), Phila Pa. 1323-1328 (2010).
- Olsen, M. A., et al. Risk factors for surgical site infection in spinal surgery. Journal of Neurosurgery. 98, 2 Suppl 149-155 (2003).
- Ofluoglu, E. A., et al. Implant-related infection model in rat spine. Archives of Orthopaedic and Trauma Surgery. 127 (5), 391-396 (2007).
- Guiboux, J. P., et al. The role of prophylactic antibiotics in spinal instrumentation. A rabbit model. Spine. 23 (6), Phila Pa. 653-656 (1998).
- Stavrakis, A. I., et al. Current Animal Models of Postoperative Spine Infection and Potential Future Advances. Frontiers in Medicine (Lausanne). 2, 34(2015).
- Pribaz, J. R., et al. Mouse model of chronic post-arthroplasty infection: noninvasive in vivo bioluminescence imaging to monitor bacterial burden for long-term study. Journal of Orthopaedic Research. 30 (3), 335-340 (2012).
- Bernthal, N. M., et al. A mouse model of post-arthroplasty Staphylococcus aureus joint infection to evaluate in vivo the efficacy of antimicrobial implant coatings. PLoS One. 5 (9), 12580(2010).
- Niska, J. A., et al. Monitoring bacterial burden, inflammation and bone damage longitudinally using optical and muCT imaging in an orthopaedic implant infection in mice. PLoS One. 7 (10), 47397(2012).
- Francis, K. P., et al. Monitoring bioluminescent Staphylococcus aureus infections in living mice using a novel luxABCDE construct. Infection and Immunity. 68 (6), 3594-3600 (2000).
- Dworsky, E. M., et al. Novel in vivo mouse model of implant related spine infection. Journal of Orthopaedic Research. 35 (1), 193-199 (2017).
- Hegde, S. S., et al. Activity of telavancin against heterogeneous vancomycin-intermediate Staphylococcus aureus (hVISA) in vitro and in an in vivo mouse model of bacteraemia. Journal of Antimicrobial Chemotherapy. 65 (4), 725-728 (2010).
- Crandon, J. L., Kuti, J. L., Nicolau, D. P. Comparative efficacies of human simulated exposures of telavancin and vancomycin against methicillin-resistant Staphylococcus aureus with a range of vancomycin MICs in a murine pneumonia model. Antimicrobial Agents and Chemotherapy. 54 (12), 5115-5119 (2010).
- Reyes, N., et al. Efficacy of telavancin in a murine model of bacteraemia induced by methicillin-resistant Staphylococcus aureus. Journal of Antimicrobial Chemotherapy. 58 (2), 462-465 (2006).
- Sakoulas, G., Eliopoulos, G. M., Alder, J., Eliopoulos, C. T. Efficacy of daptomycin in experimental endocarditis due to methicillin-resistant Staphylococcus aureus. Antimicrobial Agents and Chemotherapy. 47 (5), 1714-1718 (2003).
- Hu, Y., et al. Combinatory antibiotic therapy increases rate of bacterial kill but not final outcome in a novel mouse model of Staphylococcus aureus spinal implant infection. PLoS One. 12 (2), 0173019(2017).
- Poelstra, K. A., Barekzi, N. A., Grainger, D. W., Gristina, A. G., Schuler, T. C. A novel spinal implant infection model in rabbits. Spine. 25 (4), Phila Pa. 406-410 (2000).
Reprints and Permissions
Erratum
Formal Correction: Erratum: In vivo Mouse Model of Spinal Implant Infection
Posted by JoVE Editors on 5/05/2023. Citeable Link.
An erratum was issued for: In vivo Mouse Model of Spinal Implant Infection. The Authors section was updated from:
Benjamin V. Kelley1
Stephen D. Zoller1
Danielle Greig1
Kellyn Hori1
Nicolas Cevallos1
Chad Ishmael1
Peter Hsiue1
Rishi Trikha1
Troy Sekimura2
Thomas Olson2
Ameen Chaudry2
Michael M. Le2
Anthony A. Scaduto1
Kevin P. Francis1
Nicholas M. Bernthal1
1Department of Orthopaedic Surgery, University of California Los Angeles
2David Geffen School of Medicine, University of California Los Angeles
to:
Benjamin V. Kelley1
Christopher Hamad1
Stephen D. Zoller1
Danielle Greig1
Zeinab Mamouei1
Rene Chun1
Kellyn Hori1
Nicolas Cevallos1
Chad Ishmael1
Peter Hsiue1
Rishi Trikha1
Troy Sekimura2
Brandon Gettleman3
Autreen Golzar2
Adrian Lin2
Thomas Olson2
Ameen Chaudry2
Michael M. Le2
Anthony A. Scaduto1
Kevin P. Francis1
Nicholas M. Bernthal1
1Department of Orthopaedic Surgery, University of California Los Angeles
2David Geffen School of Medicine, University of California Los Angeles
3University of South Carolina School of Medicine, University of South Carolina
