This protocol has been established to culture tetrahydrobiopterin (BH4)- and inducible nitric oxide synthase (iNOS)-deficient primary murine macrophages to study NO-redox biology. The study focuses on reducing potential contamination of BH4 and other artifacts found in traditional isolation and culture methods which may confound experimental outcomes and interpretation of results.
Method Article
Isolation and In vitro Culture of Bone Marrow-Derived Macrophages for the Study of NO-Redox Biology
* These authors contributed equally
In This Article
Summary
Abstract
Macrophages are derived from hematopoietic progenitor cells throughout the body, are central to inflammatory processes, and participate in innate and adaptive immune responses. In vitro study of macrophages can be undertaken by ex vivo culture from the peritoneum or through differentiation of myeloid bone marrow progenitor cells to form bone marrow-derived macrophages (BMDMs). A common approach to macrophage differentiation from precursors involves the use of conditioned media from L929 cells (LCM). This media is easy to self-produce but suffers from batch variability, and its constituents are undefined. Similarly, Foetal Bovine Serum (FBS) is used to support growth but contains a vast mixture of undefined molecules that may vary between batches. These methods are not adequate for the study of nitric oxide biology and redox mechanisms as they both contain substantial amounts of small molecules that either interfere with redox mechanisms or supplement levels of cofactors, such as tetrahydrobiopterin (BH4), required for the production of NO from inducible nitric oxide synthase (iNOS). In this report, we present an optimized protocol allowing for control of the NO-redox environment by reducing the levels of exogenous biopterin while maintaining conditions suitable for cell growth and differentiation. Tight control of culture media composition helps ensure experimental reproducibility and facilitates accurate interpretation of results. In this protocol, BMDMs were obtained from a GTP cyclohydrolase (GCH)- deficient mouse model. Culture of BMDMs was performed with media containing either (i) conditioned LCM, or (ii) recombinant M-CSF and GM-CSF to produce minimal artifacts while obtaining BH4 and NO-deficient culture conditions - thus allowing for the reproducible study of NO-redox biology and immunometabolism in vitro.
Introduction
Macrophages have been established as an interesting cell type in a wide variety of diseases and conditions, many seemingly unrelated to their traditional focus on innate immunity. As macrophage physiology is heavily dependent on the tissue or environment they are resident in, many methods and models have arisen to study their function and the various pathways involved. Historically, macrophage cell lines, such as RAW264.7, dominated the field, but these have been gradually replaced in favor of various primary cell models. For example, murine macrophages may be isolated from peritoneal lavage following treatment with thioglycolate. While providing a useful model for the study of tissue-resident cells, these peritoneal macrophages have been shown to demonstrate a more subdued response to various external stimuli, thereby limiting their suitability for many downstream applications1.
As an alternative, bone marrow-derived macrophages (BMDMs), derived from myeloid progenitor cells in the bone marrow, have emerged as a valuable model for studying various aspects of macrophage biology, including maturation and the various classical phenotypes associated with macrophages, M0 (naive, non-activated), M1 (pro-inflammatory, usually activated with LPS/IFN) and M2 (pro-resolution, usually activated with IL-4)2,3. However, the differentiation of myeloid progenitor cells into BMDMs is dependent on the presence of macrophage colony-stimulating factor (M-CSF) in the culture media4,5. This may be supplied either in the form of purified protein added to the media or from L929 conditioned media (LCM). The advantages of using BMDMs (cost and efficiency) must be weighed against the limitations presented by their sensitivity to various stimuli (cytokines, metabolic intermediates, and RNS/ROS).
Previous data indicate that the contents of LCM are poorly defined and intrinsically variable, resulting in their being unreliable and unsuitable for a variety of downstream applications, especially those specifically relating to NO or redox biology, as these may be heavily influenced by the presence of exogenous compounds6. As such, this detailed protocol calls for the use of well-defined DMEM: F12 media with low batch to batch variation and the addition of recombinant murine M-CSF and GM-CSF (Granulocyte-macrophage colony-stimulating factor). Furthermore, fetal bovine serum typically used as a supplement in tissue culture media provides yet another source of poorly defined compounds and inherent variability. It is, therefore, necessary to control for and optimize the use of such additives to ensure the reliable culture of BMDMs. By using a defined low-endotoxin source of FBS and ensuring single batches are bulk purchased, culture conditions are reliably defined, and reproducibility is ensured. The protocol described herein has been demonstrated to produce a macrophage culture above 95% purity when assessed for the macrophage surface markers CD45 and CD11b by flow cytometry6.
Protocol
All animal procedures were approved and carried out in accordance with the University of Oxford ethical committee and the UK Home Office Animals (Scientific Procedures) Act 1986. All procedures conformed to the Directive 2010/63/EU of the European Parliament.
1. Isolation of bone marrow cells
- Sacrifice wild-type (C57BL/6), or Gch1-deficient (R26-CreERT2Gchfl/fl) mice (10-16 weeks old) by cervical dislocation and collect the hind limbs.
NOTE: No preference for either sex is made. Age-matched females will be slightly smaller than their male counterparts, affecting the initial yield of starting material.- Spray the mice with 70% ethanol to reduce the risk of contamination.
- Make a small cut in the abdomen with dissection scissors to remove fur and skin from the body. Peel the skin off to expose the muscle on the hind limbs.
- Place the mouse on its abdomen and dislocate the hind limbs by lifting it from the knee joint and placing pressure on the hips. The dislocation can be felt at the hip joint.
- Remove the hind legs by carefully cutting through the muscle at the hip, ensuring no damage occurs to the femur.
- Cut above the ankle joint, remove the foot and clean any remaining skin from the leg.
- Place the dissected legs in a 50 mL tube with 25 mL of ice-cold PBS (no antibiotic required) and place it on ice.
NOTE: Multiple animals can be dissected, and the legs kept on ice.
- Under sterile conditions in a tissue culture hood, remove the muscles from the legs and remove the ends of the bones to expose the bone marrow.
- Place the legs in 70% ethanol for 2 min to reduce contamination and wash off any fur or residue.
- Transfer the legs to a clean, sterile, bacteriological Petri dish. Use forceps and a scalpel to firmly and carefully scrape along the bones with the side of the blade to remove the muscles. Cut through tendons to ease the process.
- Remove the epiphysis at the extremity of each bone to expose the bone marrow. The femur is cut at either end, just short of the respective joints.
- The tibia is cut at the top, just short of the knee joint, and at the bottom just above the point of intersection with the fibula.
- Flush the bone marrow from the bones with PBS and collect it in a 50 mL sterile tube.
- Fill a 10 mL syringe with 10 mL of PBS and attach to a 25 G x 0.5 x 16 mm needle. This is sufficient to flush all of the bones from one mouse.
- Insert the needle into the medullary cavity of the bone and gently flush the bone marrow out with 1-2 mL of PBS, running the needle up and down through the bone to ensure all bone marrow is dislodged.
- Repeat for all bones, collecting the flushed bone marrow in a clean Petri dish.
- Using a sterile 1 mL syringe, disaggregate the bone marrow by drawing the suspension in and out of the syringe 5-10 times until any lumps are broken up.
- Collect the disaggregated bone marrow in the 1 mL syringe and pass it through a 70 µM cell strainer into a clean 50 mL centrifuge tube. Place the collected bone marrow on ice while further samples are collected.
NOTE: See protocol scheme in Figure 1 - Part 1.
2. Selection, differentiation, and stimulation of BMDMs
- To freeze bone marrow for later use, pellet the bone marrow by centrifugation at 1000 x g for 5 min and resuspend in 2 mL of low endotoxin FBS containing 5% Dimethyl Sulfoxide (DMSO).
- Centrifuge the bone marrow suspension at 1000 x g for 5 min at room temperature (RT). A blood-red pellet will form.
- Discard the supernatant.
- Gently resuspend the pellet in 2 mL of low-endotoxin FBS containing 5% DMSO and freeze at -80 °C overnight before transferring to vapor-phase liquid nitrogen for long-term storage.
- To use bone marrow immediately, lyse the red blood cells before plating the bone marrow.
- Centrifuge the bone marrow suspension at 1000 x g for 5 min at RT. A blood-red pellet will form.
- Resuspend the pellet in 3 mL of 1x red blood cell lysis buffer and incubate at RT for 5 min.
- Add 10 mL of PBS and centrifuge at 1000 x g for 5 min at RT. Discard the supernatant.
- Plate the cells for immediate use by continuing from step 2.3.5.
- Defrost the macrophages and resuspend in 3 mL of plating media before pelleting the cells.
- Prepare DMEM: F12 containing 5% low endotoxin FBS, 1x penicillin/streptomycin, L-glutamine and 25 ng/mL M-CSF.
NOTE: M-CSF and GM-CSF can be prepared by resuspending dried protein in sterile water containing 0.1% sterile BSA, and the aliquots can be frozen at -80 °C for later use. - Defrost the frozen cell suspension rapidly at 37 °C.
- Transfer the cell suspension (0.5 mL) to a clean, sterile tube containing 3 mL of the prepared DMEM: F12 media.
- Pellet the cells by centrifugation at 1000 x g for 5 min at RT. Discard the supernatant.
- Resuspend the pellet in 3 mL of the prepared DMEM: F12 media.
- Count the cells by a preferred method.
- Prepare DMEM: F12 containing 5% low endotoxin FBS, 1x penicillin/streptomycin, L-glutamine and 25 ng/mL M-CSF.
- Day 0: Plate the cells.
- Plate the cells in non-TC-coated plastic ware in DMEM: F12 media containing 5% low endotoxin FBS, 1x penicillin/streptomycin, L-glutamine, and 25 ng/mL M-CSF.
NOTE: Representative seeding densities are described in Table 1. A complete pair of legs from one mouse provides 15-20 million precursor cells. - Incubate the cells at 37 °C with 5% CO2.
- Plate the cells in non-TC-coated plastic ware in DMEM: F12 media containing 5% low endotoxin FBS, 1x penicillin/streptomycin, L-glutamine, and 25 ng/mL M-CSF.
- Day 5: Feed the cells.
- Feed the cells by adding 50% of the original volume of DMEM: F12 media containing 5% low endotoxin FBS, 1x penicillin/streptomycin, L-glutamine, and 50 ng/mL M-CSF.
- Day 6: Stimulate the cells with GM-CSF.
- Add prepared GM-CSF to a final concentration of 50 ng/mL directly to the cell culture media on the cells.
- Replace the media with prepared DMEM: F12.
- Remove all media from the cells.
- Wash the cells briefly in pre-warmed PBS.
- Add DMEM: F12 media containing 2% low endotoxin FBS, 1x penicillin/streptomycin, L-glutamine, 25 ng/mL M-CSF and 50 ng/mL GM-CSF.
- Activate the macrophages to the M0, M1, or M2 phenotypes with the stimulations described in steps 2.7.5-2.7.7.
- M0 - No stimulation required. Incubate the cells overnight in media.
- M1 - Stimulate the cells with 100 ng/mL LPS and 10 ng/mL IFNγ (final concentrations) overnight.
- M2 - Stimulate cells with 100 ng/mL IL-4 (final concentration) overnight.
- Day 8: Harvest the cells.
- Remove media from the cells (collect media and freeze at -80 °C for downstream assays).
- Incubate the cells in ice-cold PBS (50% of media volume) for 5 min.
- Detach the cells from the plate with gentle scraping or repeated pipetting.
- Pellet the cells by centrifugation at 2500 x g for 5 min at RT. Discard the supernatant.
- Freeze the cell pellets at -80 °C for later use.
NOTE: See protocol scheme Figure 1 - Part 2.
Results
Before demonstrating the efficiency of this protocol in macrophages, nitrite, and BH4 levels were assessed in media supplemented with 10% of FBS containing either 10% of LCM or only recombinant M-CSF and GM-CSF. Nitrite, although considered for a long time as an end product of nitric oxide metabolism, is now regarded as physiological storage of nitric oxide, which can be recycled when required and thus is often used as an indicator of nitric oxide bioavailability7. BH4 is an essential cofactor of NOS for NO production. As seen in Figure 2, media supplemented with 10% FBS had similar nitrite levels regardless of M-CSF/GM-CSF or LCM. However, more variability between different LCM batches was observed. This observation also applied to the BH4 measurement. In fact, one batch of LCM (batch #3) had a significantly higher level of BH4 than the other two (batches #1 and #2). Furthermore, LCM batches contained significantly more biopterin than media supplemented with 10% FBS and recombinant cytokines. Significant variability of total biopterins between batches was also measured. These results demonstrate the importance of using a less variable source of M-CSF than LCM.
Moreover, media supplemented with 10% FBS contained significantly higher levels of nitrite compared with media containing either 2% or 5% of FBS. The difference between 10% and 5% was highly significant (p < 0.05) for BH4. However, similar levels of biopterins were quantified. In comparison, OptiMEM + 0.2% BSA was devoid of nitrite and BH4, making it a very clean and suitable media. However, as described by Bailey et al., although OptiMEM is meant to be used only once overnight when stimulating macrophages, cell death due to starvation was observed. DMEM: F12 supplemented with 2% of FBS was chosen to overcome this issue, allowing minimal nitrite and BH4 contamination while containing sufficient nutrients to obtain healthy cells. Indeed, despite some nitrite being detected, levels are negligible (~0.2 µM) compared to LPS/IFN stimulated WT macrophages (30-80 µM for 1 x 10⁶ cells; data not shown).
To validate this improved protocol with experimental data, the isolation and characterization of BMDMs from a new BH4-deficient mouse model, the R26-CreERT2Gchfl/fl is presented here. BH4 is produced by the GTP cyclohydrolase I (Gch1) gene. As shown in Figure 3A, deficiency in Gch1 leads to loss of BH4 and the resulting disappearance of NO and subsequently nitrite, and an increase in superoxide anion causing oxidative stress as demonstrated previously by McNeill et al.8. Although this protocol has already been well defined and used to culture other BH4-deficient macrophages from different Cre-system such as the Gchfl/flT2C model6,8, the R26-CreERT2Gchfl/fl model is unique as it utilizes the conditional activation of the Cre-ERT2 system to remove Gch1 gene following tamoxifen treatment (Figure 3B,C). This allows knockout at various time points and the use of internal control in the form of a vehicle vs. tamoxifen treatment. In this example, cells were treated with either vehicle (95% Ethanol) or 0.1/1.0 µM 4-OH tamoxifen on days 1 and 3 (both vehicle and tamoxifen stock diluted 1:100 in media before 0.7/7.0 µL added to 1 mL of the existing culture volume).
As seen in Figure 3D, GTPCH protein is abolished following Tamoxifen treatment in the R26-CreERT2Gchfl/fl cells but not in the Gchfl/fl one. Importantly, both R26-CreERT2Gchfl/fl and Gchfl/fl control cells are still able to produce iNOS following LPS/IFN stimulation (Figure 3B,C). These changes in Gch1 gene expression and the resulting alteration in GTPCH protein led to significantly perturbed intracellular BH4 levels and attenuated production of nitrite. As shown in Figure 4, BMDMs isolated and cultured from R26-CreERT2Gchfl/fl mice exhibited significantly diminished BH4 production and decreased nitrite accumulation in the media, compared to those from control GCHfl/fl cells in the presence of tamoxifen. Similarly, the same cells cultured in LCM media also showed abolished Gch1 expression; although these cells still produced significant amounts of both BH4 and nitrite following knockout of Gch1 expression with 4 OH tamoxifen, possibly due to the contamination of media and FBS with BH4. This represents a clear improvement of the new method, over culturing the cells in L-cell-containing media.
Further characterization of this model demonstrates no significant differences in morphology between non-activated (M0) Gchfl/fl and R26-CreERT2Gchfl/fl BMDMs at Day 8 following different concentrations of tamoxifen. As shown in Figure 5, both models display a similar amount of adherent cells made of a round shape with elongated extremities, typically the features expected of unstimulated macrophages9.
Taken together, these results demonstrate that this method of isolation and culture of BMDMs provides a pure population of cells suitable for the culture of murine macrophages. This method allows for the culture of murine macrophages without the interference of exogenous compounds present in some media formulations.

Figure 1: Schematic diagram illustrating bone marrow cells isolation (Part 1) to the selection, differentiation, and stimulation of BMDMs (Part 2). (A) Under sterile conditions, dissected legs are placed in a clean bacteriological petri dish after being washed in 70% ethanol. (B) Muscles are carefully removed using forceps and scalpel scraping along the bones. (C) The extremities of the bones are then cut off to expose the bone marrow. (D) The bone marrow is flushed from the bones using a 10 mL syringe filled with 10 mL of PBS by inserting the needle into the lumen of the bone. (E) The needle is run up and down through the bone to ensure all bone marrow is dislodged. The bone should appear white and clear at that stage with the dislodged bone marrow collected in the petri dish. (F-G) Repeat for all bones, collecting the disaggregated bone marrow in the 1 mL syringe, and pass it through a 70 µm cell strainer into a clean 50 mL centrifuge tube. Spin down and resuspend cells in freezing media for later use. Part 2 shows the selection, differentiation, and stimulation of BMDMs Please click here to view a larger version of this figure.

Figure 2: Nitrite and BH4 levels in DMEM: F12 + GM-CSF + M-CSF or DMEM: F12+ L-cell media. (A) Nitrite levels in different media were measured using the Griess Assay method. (B) BH4 and biopterins levels were measured in different media by HPLC quantification using a BH4 standard. Data are expressed as the mean (n = 3) ± SD. Data were analyzed using one-way ANOVA by multiple comparisons. Symbols represent p < 0.05 between groups. Please click here to view a larger version of this figure.
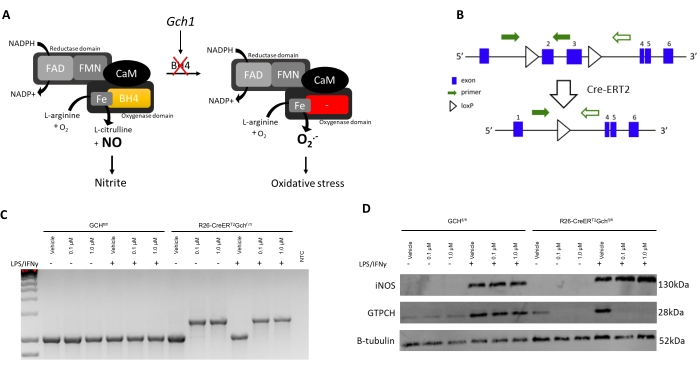
Figure 3: Introducing the R26CreERT2 model. (A) Scheme illustrating the role of BH4 as a NOS cofactor in redox biology. (B) Schematic detailing the excision of the critical exons (2 and 3) in Gch1 due to the flanking loxP sites and the conditional activation of Cre-ERT2 with tamoxifen in this murine model. (C) PCR (representative of n = 3 independent animals) demonstrating excision of the critical exon when BMDMs are treated with tamoxifen. WT mice produce a 1030 bp PCR product, while in the presence of the Cre, a 1392 bp product is produced, confirming excision of the critical exons. (D) Immunoblot of iNOS, GCH, and B-tubulin (representative of n = 3 independent animals). Please click here to view a larger version of this figure.

Figure 4: Characterization of BH4-deficiency in macrophages. (A,B) qRT-PCR confirms loss of Gch1 expression in the R26-CreERT2Gchfl/fl model treated with tamoxifen. Blue = New MCSF method, Green = classical LCM method. (C,D) Analysis of intracellular BH4 by HPLC reveals that 0.1 µM and 1.0 µM are sufficient to diminish BH4 levels significantly. (E, F) Measurement of nitrite in media using the Griess assay shows that unstimulated BMDMs do not produce detectable levels of nitrite, whereas Gchfl/fl and R26-CreERT2Gchfl/fl BMDMs produce nitrite in the presence of LPS/IFNγ. Significantly, tamoxifen treatment of R26-CreERT2Gchfl/fl significantly reduces nitrite levels in stimulated BMDMs. Data are expressed as the mean of (n = 3) ± SD. Data were analyzed using one-way ANOVA by multiple comparisons. Symbols represent p < 0.05 between groups. Please click here to view a larger version of this figure.
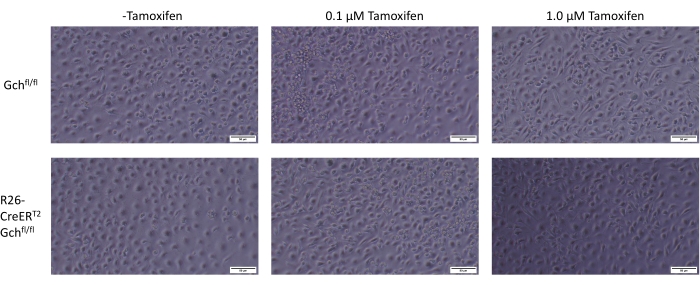
Figure 5: Comparison of BMDMs morphology. Photos obtained by optical microscopy of BMDMs at Day 8 with the varying treatment of tamoxifen. Scale is indicated in the image. Please click here to view a larger version of this figure.
| Culture Dish | Media Volume | Seeding Density |
| 12 well dish | 1 mL | 500,000 cells |
| 6 well dish | 2 mL | 1,000,000 cells |
| 100 mm dish | 10 mL | 3,000,000 cells |
| 75 cm2 flask | 15 mL | 5,000,000 cells |
Table 1: Representative seeding densities.
Discussion
This BH4- and NO-deficient BMDMs culture protocol has been designed to investigate NO-redox biology in primary macrophages through reduction of tetrahydrobiopterin (BH4) and other interfering artifacts with the aim to enhance reliability and reproducibility of results obtained from these experimental models.
Critical steps include the use of the correct plastic ware. Macrophage progenitors are adherent cells and very sticky; therefore the use of non-tissue culture (TC) treated plates is crucial in selecting and isolating them from other progenitor cells, which could otherwise attach and reduce purity. On harvest day, detaching macrophages from plates require ice-cold PBS but using EDTA or even scraping cells very gently can be performed depending on the downstream application (lysed versus live cells experiment, for instance). Particular care should also be taken regarding contamination. While flushing out the bone marrow, potential cross-contamination with bacteria or viral particles from leftover fur and skin may occur. It is then essential to be as careful and sterile as possible; hence plunging dissected legs in 70% ethanol for few minutes is encouraged. Similarly, using antibiotics while growing macrophages is highly recommended.
Another limitation of this protocol arises from the cell-plating density at Day 0. Flushed bone marrow contains a variety of cells, which can be wrongly counted and included as macrophage progenitors, thus leading to a false total cell number. To avoid the subsequent and potential variability, isolated macrophages can be gently flushed using warm PBS at Day 7 and re-plated at the correct density in 2%FBS DMEM: F12 at least 1 h before stimulation to allow adherence.
Finally, checking the nitrite levels by Griess assay using media from grown macrophages is imperative to analyze data. On the plus side, this assay is quick and inexpensive to perform.
As demonstrated herein, this customized protocol is a more defined and improved alternative to the more common protocol used to isolate and cultivate macrophages using L-cell conditioned media (LCM). Indeed, one of the main concerns using LCM when studying NO-redox biology is its significant amounts of biopterins detected, leading to potential metabolic changes10. For instance, exogenous BH4 can quickly replenish deficient models and act as a cofactor for iNOS, leading to the unwanted production of nitric oxide. Another disadvantage of using LCM lies in its production - LCM is a mixture of colony-stimulating factors, cytokines, and other by-products secreted directly by L-929 cells, which can all affect macrophage physiology6. Despite its great supply in M-CSF, essential for macrophage proliferation and survival, the variation of each component from batch to batch increases the risk of variability across experiments.
To address both issues, this new protocol uses the well-defined DMEM: F12 media containing low levels of biopterins to which a controlled amount of purified M-CSF and GM-CSF is added. Both cytokines assist in the differentiation and growth of macrophages. M-CSF especially leads to the generation of BMDMs from bone marrow progenitor cells by assuring the differentiation of hematopoietic stem cells into macrophages11. In addition, GM-CSF has been shown to boost inflammatory cytokine and NO production when added prior to stimulation, a real benefit when studying NO-redox biology12,13.
The other main factor this new method addresses is that of FBS, usually used as a source of nutrients essential for the good health and growth of cells. Similar to LCM, FBS contains significant levels of biopterin. While complete serum starvation of the cells before stimulation was initially considered using OptiMEM + 0.2% BSA, macrophages showed signs of detachment, indicative of decreased cell viability as described by Bailey et al.6. However, as macrophages demonstrated an absolute requirement for serum, the Ultra-Low Endotoxin FBS from BioWest was selected. Batches were tested for biopterins and pre-selected before the bulk purchase to ensure a reliable and well-defined supply. To go further in the aim to reduce polluting sources of biopterins, decreased concentrations of FBS were therefore tested. Instead of using 10% serum as commonly used in cell culture, the FBS level is kept to 5% throughout the 7-day differentiation of bone marrow into macrophages and further reduced to 2% during overnight stimulation on the final day. This ensures negligible levels of biopterins detected but enough nutrients for the good health and adherence of macrophages. Although this newly optimized protocol using recombinant M-CSF results in a more controlled environment for the culture and activation of primary macrophages, the main limitation is that this method is more expensive than using the LCM method.
Taking all these factors into consideration, the two methods were then directly compared. Importantly, the newly modified protocol presented herein using recombinant M-CSF and GM-CSF resulted in a more reproducible system where the media was devoid of contaminating BH4. The effects of this were two-fold; BH4-deficient cells were truly lacking BH4, which resulted in minimal detectable nitrite accumulation in the media following stimulation to M1 status with LPS. This was in contrast to those same BMDM cells cultured in LCM, where significant BH4 and nitrite were detected.
To conclude, the strength of this method lies in the effort of controlling biopterins levels by thoroughly assessing each parameter that could affect NO and redox signaling in macrophages. In particular, this ensures maximum reproducibility and standardization in the NO-redox biology field.
Disclosures
The authors declare no competing interests.
Acknowledgements
This work was supported by the British Heart Foundation Intermediate Fellowship awarded to M.J.C. (FS/14/56/31049), British Heart Foundation Programme grants (RG/17/10/32859 and RG/12/5/29576), Wellcome Trust (090532/Z/09/Z), and the NIH Research (NIHR) Oxford Biomedical Research Centre. The authors would also like to acknowledge support from the BHF Centre of Research Excellence, Oxford (RE/13/1/30181 and RE/18/3/34214)
Materials
| Name | Company | Catalog Number | Comments |
|---|---|---|---|
| 1 mL syringe | Terumo | SS+01T1 | 1mL 6% LUER syringe |
| 10 mL plastic syringe | Fisher scientific | 14955453 | |
| 6 well plate sterile non-treated | CytoOne | CC7672-7506 | Flat bottom |
| DMEM/F-12 (1:1) (1x) | Gibco, Life Technologies | 21331-020 | |
| DMSO sterile | Sigma-aldrich | D2650-100ML | |
| Easy flask 260 mL | Thermo Scientific | 156800 | |
| L-Glutamine Solution 200 mM | Sigma-aldrich | G7513-100ML | |
| Lipopolysaccharides from Escherichia coli O111:B4 | Sigma-aldrich | L4391-1MG | |
| Mutlidish 12 sterile non-treated | Thermo Scientific | 150200 | Flat bottom |
| Needle 25G, 0.5 x 16 mm | BD Microlance 3 | 300600 | |
| PBS (pH7.4, 1x) | Gibco, Life Technologies | 10010-015 | |
| Penicillin-Streptomycin | Sigma-aldrich | P0781-100ML | |
| petri dish 100 x15 mm sterile | Falcon, Corning incorporated | 351029 | |
| Recombinant murine GM-CSF | PEPROTECH | 315-03 | |
| Recombinant murine IFN-γ | PEPROTECH | 315-05 | |
| Recombinant murine M-CSF | PEPROTECH | 315-02 | |
| Scalpel n23 | Swann-Morton | 0510 | |
| Ultra-low endotoxin FBS | Biowest | S1860-500 | |
| VWR cell strainers 70 µm nylon | VWR | 732-2758 |
References
- Zajd, C. M., et al. Bone marrow-derived and elicited peritoneal macrophages are not created equal: The questions asked dictate the cell type used. Frontiers in Immunology. 11, 269(2020).
- Murray, P. J., et al. Macrophage activation and polarization: nomenclature and experimental guidelines. Immunity. 41 (1), 14-20 (2014).
- Zhao, Y. L., et al. Comparison of the characteristics of macrophages derived from murine spleen, peritoneal cavity, and bone marrow. Journal of Zheijang University Science B. 18 (12), 1055-1063 (2017).
- Nasser, H., et al. Establishment of bone marrow-derived M-CSF receptor-dependent self-renewing macrophages. Cell Death Discovery. 6, 63(2020).
- Stanley, E. R., Heard, P. M. Factors regulating macrophage production and growth. Purification and some properties of the colony stimulating factor from medium conditioned by mouse L cells. Journal of Biological Chemistry. 252 (12), 4305-4312 (1977).
- Bailey, J. D., et al. Isolation and culture of murine bone marrow-derived macrophages for nitric oxide and redox biology. Nitric Oxide. 100-101, 17-29 (2020).
- Shiva, S. Nitrite: A physiological store of nitric oxide and modulator of mitochondrial function. Redox Biology. 1 (1), 40-44 (2013).
- McNeill, E., et al. Regulation of iNOS function and cellular redox state by macrophage Gch1 reveals specific requirements for tetrahydrobiopterin in NRF2 activation. Free Radical Biology and Medicine. 79, 206-216 (2015).
- McWhorter, F. Y., Wang, T., Nguyen, P., Chung, T., Liu, W. F. Modulation of macrophage phenotype by cell shape. Proceedings of the National Academy of Sciences of the United States of America. 110 (43), 17253-17258 (2013).
- Bailey, J. D., et al. Nitric oxide modulates metabolic remodeling in inflammatory macrophages through TCA cycle regulation and itaconate accumulation. Cell Reports. 28 (1), 218-230 (2019).
- Hamilton, T. A., Zhao, C., Pavicic, P. G., Datta, S. Myeloid colony-stimulating factors as regulators of macrophage polarization. Frontiers in Immunology. 5, 554(2014).
- Na, Y. R., et al. GM-CSF induces inflammatory macrophages by regulating glycolysis and lipid metabolism. Journal of Immunology. 197 (10), 4101-4109 (2016).
- Sorgi, C. A., et al. GM-CSF priming drives bone marrow-derived macrophages to a pro-inflammatory pattern and downmodulates PGE2 in response to TLR2 ligands. PLoS One. 7 (7), 40523(2012).
Reprints and Permissions
