We describe a method to generate human motor units in commercially available microfluidic devices by co-culturing human induced pluripotent stem cell-derived motor neurons with human primary mesoangioblast-derived myotubes resulting in the formation of functionally active neuromuscular junctions.
Method Article
Generation of Human Motor Units with Functional Neuromuscular Junctions in Microfluidic Devices
In This Article
Summary
Abstract
Neuromuscular junctions (NMJs) are specialized synapses between the axon of the lower motor neuron and the muscle facilitating the engagement of muscle contraction. In motor neuron disorders, such as amyotrophic lateral sclerosis (ALS) and spinal muscular atrophy (SMA), NMJs degenerate, resulting in muscle atrophy and progressive paralysis. The underlying mechanism of NMJ degeneration is unknown, largely due to the lack of translatable research models. This study aimed to create a versatile and reproducible in vitro model of a human motor unit with functional NMJs. Therefore, human induced pluripotent stem cell (hiPSC)-derived motor neurons and human primary mesoangioblast (MAB)-derived myotubes were co-cultured in commercially available microfluidic devices. The use of fluidically isolated micro-compartments allows for the maintenance of cell-specific microenvironments while permitting cell-to-cell contact through microgrooves. By applying a chemotactic and volumetric gradient, the growth of motor neuron-neurites through the microgrooves promoting myotube interaction and the formation of NMJs were stimulated. These NMJs were identified immunocytochemically through co-localization of motor neuron presynaptic marker synaptophysin (SYP) and postsynaptic acetylcholine receptor (AChR) marker α-bungarotoxin (Btx) on myotubes and characterized morphologically using scanning electron microscopy (SEM). The functionality of the NMJs was confirmed by measuring calcium responses in myotubes upon depolarization of the motor neurons. The motor unit generated using standard microfluidic devices and stem cell technology can aid future research focusing on NMJs in health and disease.
Introduction
NMJs facilitate the communication between lower spinal motor neurons and skeletal muscle fibers through the release of neurotransmitters1. In motor neuron disorders like ALS and SMA, the NMJs degenerate, which causes a disruption in the communication with the muscles2,3,4,5,6,7. This results in patients gradually losing their muscle function, which causes them to be wheelchair-bound and eventually dependent on respiratory life-support due to progressive atrophy of vital muscle groups like the diaphragm. The exact underlying mechanisms responsible for this profound loss of NMJs in these disorders are unknown. Many studies have been done on transgenic animal models, which has given us some insights into the pathogenesis of NMJ degeneration5,6,8,9,10,11. However, to fully understand the pathology and counteract the denervation, it is important to have a human system, which allows full accessibility.
Here, the protocol describes a relatively simple way to generate human NMJs through the co-culturing of hiPSC-derived motor neurons and human primary MAB-derived myotubes using commercially available microfluidic devices. The use of microfluidics to polarize and fluidically isolate the somas and axons of neurons has been known since the first description of the 'Campenot' chambers12 in the late 1970s. Since then, more microfluidic designs have been fabricated, including commercial options. The devices used in this protocol contain two compartments, and each compartment consists of two wells connected with a channel13. The two compartments are mirrored and connected with several microgrooves. These microgrooves have a size that facilitates neurite growth while maintaining fluidic isolation between the two compartments through a capillary hydrostatic pressure13,14. Using this system, it is possible to culture motor neurons in one compartment and muscle cells in the other one, each in their specific culture medium, while still facilitating a physical connection through neurites passing through the microgrooves and engaging with the muscle cells. This model provides a fully accessible and adaptable in vitro system of a human motor unit, which can be used to study early NMJ pathology in diseases like ALS and SMA.
Protocol
Written informed consent was obtained from all subjects, who provided their samples for iPSC generation and MAB harvesting. The procedure was approved by the medical ethics committee of the University Hospital Leuven (n° S5732-ML11268) and by the UK's main research ethics committee as part of the StemBANCC project. All reagents and equipment used in this protocol are listed in the Table of Materials and should be used sterile. Media should be heated to room temperature (RT) before use unless otherwise specified. For an overview of the co-culture protocol, please see Figure 1.
1. Differentiation of motor neuron progenitors from iPSCs
- Follow the motor neuron differentiation protocol15, adapted from a previous study16, until reaching the day 10 neural progenitor (NPCs) state. According to the timeframe of the protocol, the differentiation is initiated on a Monday (day 0), which results in day 10 NPCs on a Thursday.
- Cryopreserve day 10 NPCs in knock-out serum replacement with 10% dimethyl sulfoxide (DMSO) at a density of 2 x 10⁶- 4 x 10⁶ cells per vial.
CAUTION: DMSO is toxic: handle in a fume hood with personal protective equipment.
NOTE: Approximately 50% of the day 10 NPCs are expected to be vital upon thawing. Stop the motor neuron differentiation protocol at this 'day 10 NPC' state and cryopreserve the NPCs to generate a large number of NPCs, which can be banked and used later, reducing the length of the overall timeline of the co-culture protocol from 28 days to 19 days total.
2. Derivation and maintenance of human MABs
NOTE: MABs are vessel-associated mesenchymal stem cells, which in this case have been harvested from biopsies obtained from a 58-year-old healthy donor. Alternative commercial sources are available. The protocol to obtain MABs is briefly explained. For further information, refer to the detailed protocol17. All MAB media should be heated to 37 °C before use.
- Mince the biopsy tissue and incubate on collagen (from calfskin) coated 6 cm dishes in a growth medium (Table 1) for 2 weeks. Change the medium every 4 days.
- To prepare collagen coating, dissolve 100 mg of collagen in 20 mL of 0.1 M Acetic acid. Collagen takes time to dissolve, so place the mixture on a rocking platform overnight at RT. The following day, top up with 80 mL of ddH2O to a final volume of 100 mL.
CAUTION: Acetic acid is toxic; handle in a fume hood with personal protective equipment.
NOTE: Collagen from calfskin coating can be reused up to 5x. Store at 4 °C. - Coat the entire surface of the dish or the flask with collagen, close and incubate for 20 min at RT inside a laminar flow. After 20 min, recover the collagen in a fresh container, close the empty dish/flask and leave for 10 min at RT in the laminar flow.
- Transfer the dish/flask to the incubator for overnight (or at least 6 h) incubation (37 °C, 5% CO2). Wash 5x with Dulbecco's phosphate-buffered saline without calcium or magnesium (DPBS) before plating cells.
- To prepare collagen coating, dissolve 100 mg of collagen in 20 mL of 0.1 M Acetic acid. Collagen takes time to dissolve, so place the mixture on a rocking platform overnight at RT. The following day, top up with 80 mL of ddH2O to a final volume of 100 mL.
- After 14 days, FACS (fluorescent activated cell sorting) sort the MABs for human alkaline phosphatase17 followed by further expansion. Maintain the MABs on collagen-coated T75 flasks in the growth medium and change the growth medium every 2 days (10 mL per flask).
- Cryopreserve, passage, or seed MABs in devices when reaching 70% confluence.
NOTE: MABs lose their myogenic potential due to spontaneous fusions upon cell-to-cell contact. Make sure not to exceed 70% confluence when expanding MABs. One 70% confluent T75 flask contains approximately 600,000-800,000 cells, which can be cryopreserved at 100,000 cells per vial. Each vial can later be thawed and seeded in a T75 flask for expansion. - To passage MABs, gently wash them once with 7 mL of DPBS and then incubate in 7 mL of MAB dissociation solution for 3 min at 37 °C in 5% CO2 to dissociate the cells.
- Neutralize the MAB dissociation solution with 7 mL of the growth medium, gently scrape the cells, and transfer the cell suspension to a 50 mL centrifuge tube. Gently wash the flask with an extra 5 mL of the growth medium to collect potentially remaining MABs.
- Centrifuge the cell suspension for 3 min at 300 x g, then passage directly to a new collagen-coated T75 flask for expansion, cryopreserve in knock-out serum replacement with 10% DMSO or count to seed in a microfluidic device.
NOTE: Passages are performed 1x-2x per week for cell expansion until a maximum passage number of 13. Upon dissociation, MABs appear spherical and large in shape when examined under the microscope.
3. Preparation of pre-assembled microfluidic devices - Day 9
NOTE: The protocol is adapted from the microfluidic device manufacturer's neuron device protocol and has been adjusted for the use of both pre-assembled and silicone devices. Here, pre-assembled devices are used for immunocytochemistry (ICC) and live-cell calcium transient recordings, while silicone devices are used for SEM. The timeline of the protocol follows the timeline for the motor neuron differentiation protocol.
- Prepare the microfluidic devices the day before seeding cells, as coating needs to incubate overnight. According to the motor neuron protocol, this will be a Wednesday. Add ~10 mL of 70%-100% ethanol to a 10 cm Petri dish. Use forceps to transfer the device from the shipping container to the Petri dish for sterilization.
- Submerge the device in ethanol for 10 s and transfer the device with forceps to a piece of paper to air dry in the laminar flow for ~30 min. Flip the device a few times to allow both sides to dry. When the device is dry, use forceps to move each device to an individual 10 cm Petri dish for easy handling
CAUTION: Ethanol is toxic; handle in a fume hood with personal protective equipment - Coat the device with Poly-L-ornithine (PLO) (100 µg/mL) in DPBS and incubate at 37 °C, 5% CO2 for 3 h.
- Use a P200 pipette to add 100 µL of PLO in DPBS in a top well as close to the channel opening as possible and observe the fluid passing from the top well through the channel to the bottom well. Subsequently, add 100 µL of PLO in DPBS to the bottom well.
- Repeat on the other side of the microgrooves and finish by adding 100 µL on one side of the device to create a volume gradient between the two mirrored sides of the device to coat the microgrooves (e.g., right side 200 µL, left side 300 µL). After 3 h, wash the device 3x for 5 min with DPBS. Use a suction system if required.
NOTE: Make sure to avoid any air bubble formation in the channels at any point during the coating or culturing of the cells. Even small bubbles will expand over a short time, thereby inhibiting coating, cell seeding, or media flow across the channel. If the fluid stops in the channel during coating, resuspend the PLO solution directly into the channel from both sides. If bubbles are still present, use 200 µL of DPBS to flush the channel and repeat the coating process as stated above in steps 3.3.1-3.3.2. If bubbles appear after cell seeding, it is impossible to recover the device, as flushing the channel will damage the cells.
- Coat the device with laminin (20 µg/mL) in a Neurobasal medium and incubate overnight at 37 °C, 5% CO2. Follow the same instructions for PLO coating from steps 3.3.1-3.3.2.
- The following day, use a P200 pipette and position the tip in the well opposite to the channel opening to remove the laminin coating from the wells. Add DPBS to all the wells and leave the devices with DPBS in the laminar flow at RT for cell seeding.
NOTE: From this point on, it is important not to remove liquid (laminin coating, DPBS, media, fixation solution, etc.) directly from the channels, as this might cause air bubble formation. Always inspect the devices under the microscope before seeding cells.
4. Preparation of silicone microfluidic devices - Day 9
- Prepare the silicone microfluidic devices the day before seeding cells, as coating needs to incubate overnight. According to the motor neuron protocol, this will be a Wednesday.
- Add ~10 mL of 70%-100% ethanol to a 10 cm Petri dish. Use a forceps to transfer the device from the shipping container to the Petri dish for sterilization. Submerge the device in ethanol for 10 s and transfer with forceps to a well in a 6-well plate to air dry in the laminar flow for ~30 min. Position the device on its side to allow all sides to dry.
- Cut down the SEM sheets to the size of the device (leave a few mm on each side). Repeat the sterilization as stated above in step 4.1.1. Then, transfer with forceps to a 10 cm Petri dish to dry. Two-three SEM sheets will fit in one dish.
- Coat the devices and the SEM sheets with PLO (100 µg/mL) in DPBS and incubate at 37 °C, 5% CO2 for 3 h.
- Add 1 mL of PLO in DPBS per well to each device in the 6-well plate. Ensure the device is floating on top of the PLO solution with the channel and microgroove side facing down into the liquid. Add 10 mL of PLO in DPBS per 10 cm Petri dish and use forceps to push down the SEM sheets into the liquid.
NOTE: SEM sheets will usually float on top of the coating solution. Before assembling the device and sheet, turn the SEM sheet around so that the surface, which has been in contact with the PLO, contacts the channel and microgroove surface of the device. - After 3 h, wash the device and SEM sheets 2x for 5 min with DPBS followed by another wash for 5 min with sterile water. Use a suction system if needed. Transfer each SEM sheet to an individual 10 cm Petri dish for easy handling.
NOTE: Both devices and SEM sheets have to be completely dry before assembly. The final wash with sterile water removes potential salt crystals from the DPBS, which might otherwise inhibit assembly.
- Add 1 mL of PLO in DPBS per well to each device in the 6-well plate. Ensure the device is floating on top of the PLO solution with the channel and microgroove side facing down into the liquid. Add 10 mL of PLO in DPBS per 10 cm Petri dish and use forceps to push down the SEM sheets into the liquid.
- Work under a microscope in a laminar flow. Use forceps to mount the silicone device with the channel and microgroove side down at a 90° angle onto the SEM sheet, ensuring that all sides are aligned. Press lightly down onto the device to make sure to seal not only outer edges but also around wells, channels, and microgrooves.
NOTE: Bonded areas will appear grey, while those not yet mounted will appear clear under the microscope. Ensure that all areas are well sealed without air bubbles to avoid detachment of the device during culturing. In case of debris or salt crystals blocking mounting, rewash both SEM sheet and device in sterile water and dry before retrying the mounting procedure. If the microgrooves appear distorted from pressing too hard on the device, remove the device completely from the SEM sheet and try the mounting again. Be careful when coating and changing media once the device is mounted. - Work under a microscope in a laminar flow. Coat the device with laminin (20 µg/mL) in a Neurobasal medium and incubate overnight at 37 °C, 5% CO2.
NOTE: Overnight incubation hardens the silicone device and further seals it onto the SEM sheet.- Use a P200 pipette to add 100 µL of the laminin solution in a top well as close to the channel opening as possible and observe the fluid passing from the top well through the channel to the bottom well. Check for leakage around the well and channel.
- Subsequently, add 100 µL of laminin solution to the bottom well and check for leakage. Repeat on the other side of the microgrooves and finish with an additional 100 µL on one side of the device to create a volume gradient between the two mirrored sides of the device to coat the microgrooves (e.g., right side 200 µL, left side 300 µL).
NOTE: In case of leakage, remove the laminin coating, disassemble the device and the SEM sheets and wash both in sterile water. Let them dry and repeat from step 4.3 onwards. - The following day, remove the coating from the wells with a P200 pipette by positioning the tip in the well opposite the channel opening. Add DPBS to all the wells and leave the devices with DPBS in the laminar flow at RT for cell seeding.
NOTE: From this point on, do not to remove liquid (laminin coating, DPBS, media, fixation solution, etc.) directly from the channels, as this might cause air bubble formation. Always inspect the devices under the microscope before seeding cells.
5. Plating of NPCs in microfluidic devices - Day 10
NOTE: According to the motor neuron differentiation protocol15, plating of day 10 NPCs occurs on a Thursday.
- Use freshly dissociated day 10 NPCs15, or thaw 1-2 vials of banked NPCs per 10 mL of day 10 motor neuron medium (Table 2 and Table 3) with ROCK inhibitor (10 µL/mL) solution, and centrifuge the cell suspension at 100 x g for 4 min.
- Resuspend the cell pellet in 500-1000 µL of day 10 motor neuron medium with ROCK inhibitor (10 µL/mL) solution and count the live cells using any preferred counting method.
NOTE: As stated below, make sure to resuspend the NPCs into the correct amount of media to accommodate an optimal seeding volume. - Remove DPBS from two wells on one side of the microgrooves in the device with a P200 pipette and seed 250,000 NPCs per device in 60-100 µL of day 10 motor neuron media.
- In the top right well, seed 30-50 µL of the cell suspension (125,000 cells) close to the channel opening at a 45° angle and drag the remaining fluid gently along the well floor towards the center of the well with the pipette tip.
- Pause for a few seconds to allow the cell suspension to flow through the channel before repeating this in the lower well (125,000 cells in 30-50 µL). Use a pen to mark the seeded side "NPC" or equivalent for easy orientation of the device without a microscope.
- Incubate the device at 37 °C, 5% CO2 for 5 min to allow cell attachment before topping up the two-seeded wells with an additional day 10 motor neuron medium (total 200 µL/well) and incubate again at 37 °C, 5% CO2.
NOTE: Each well can contain 200 µL. Seeding cells in both wells and channels ensures a robust structure of the culture, lowering the risk of cell detachment during media changes. It is possible to seed fewer cells in just the channel. However, this will render the culture more susceptible to the volume current through the channels during each medium change.
- Use a P200 pipette to remove DPBS from the two wells on the other side of the microgrooves opposite the freshly seeded NPCs. Add 200 µL/well of day 10 motor neuron media and wait a few seconds between top and bottom well to allow media to flow through the channel. Then, add 6 mL of DPBS per 10 cm dish around the device to prevent evaporation of the medium during incubation.
NOTE: Add additional DPBS around the device during the culture period if needed. - Perform a full motor neuron medium change in both compartments of the device on day 11 (Friday), day 14 (Monday), and day 16 (Wednesday) (Table 2 and Table 3). Add fresh media supplements on the day of the medium change.
NOTE: From this point on, perform all medium changes with a P200 pipette. Always position the pipette tip away from the channel at the edge of the well and do not remove liquid directly from the channel. Be careful not to detach the silicone devices. Removing and adding medium should be done slowly to prevent cell detachment.- Carefully remove all media in both wells with NPCs by positioning the P200 pipette tip at the bottom edge of the well wall opposite the channel opening. Slowly add 50-100 µL of fresh motor neuron medium to the top well by positioning the P200 pipette tip at the top edge of the well wall opposite the channel opening.
- Pause for a few seconds to allow the medium to flow through the channel before adding 50-100 µL of motor neuron medium to the bottom well. Repeat this process carefully until both wells contain 200 µL/well. Repeat on the side without cells.
6. Plating of MAB in microfluidic devices - Day 17
- Approximately 7 days before seeding MABs in the microfluidic devices (day 10 of motor neuron differentiation), thaw MABs and seed them in the growth medium (Table 1) in a T75 flask coated with collagen to allow for sufficient cell expansion. See section 2.
- On day 17 of the motor neuron differentiation (Thursday), dissociate MABs as explained in step 2.4, resuspend the cell pellet in ~500 µL of growth medium and count the live cells using any preferred counting method.
NOTE: As stated below, make sure to resuspend the MABs into the correct amount of media to accommodate optimal seeding volume. - Remove the motor neuron medium on the unseeded side of the microgrooves in the device with a P200 pipette, wash gently with DPBS, and seed 200,000 MABs per device in 60-100 µL of growth medium.
- In the top right well, seed 30-50 µL of cell suspension (100,000 cells) close to the channel opening at a 45° angle and drag the remaining fluid gently along the well floor towards the center of the well with the pipette tip. Pause for a few seconds to allow the flow of cells through the channel before repeating in the lower well (100,000 cells in 30-50 µL).
- Incubate the device at 37 °C, 5% CO2 for 5 min to allow cell attachment before topping up the two freshly MAB-seeded wells with additional growth medium (total 200 µL/well). Incubate again at 37 °C, 5% CO2.
NOTE: No medium change is needed on day 17 on the motor neuron side of the device. Day 17 medium change according to the previously published motor neuron differentiation method15 is instead performed on day 18 (Friday).
7. Implementation of a volumetric and chemotactic gradient to promote the growth of motor neuron neurites towards the MAB compartment
- On day 18, perform a full medium change on the motor neuron side with day 18 motor neuron medium (200 µL/well). Follow the instructions for medium changes mentioned in steps 5.5.1-5.5.2. Initiate the MAB differentiation in the MAB compartment of the device (Table 2 and Table 4).
- Carefully wash the MAB compartments once with DPBS before adding preheated MAB differentiation medium (Table 4) supplemented with 0.01 µg/mL of human agrin (200 µL/well).
NOTE: MABs will fuse and form multinucleated myotubes over the time course of one week.
- Carefully wash the MAB compartments once with DPBS before adding preheated MAB differentiation medium (Table 4) supplemented with 0.01 µg/mL of human agrin (200 µL/well).
- On day 21, according to the motor neuron differentiation protocol (Monday), initiate the chemotactic and volumetric gradient (Table 2 and Table 3).
- Add 200 µL/well of motor neuron basal medium with 30 ng/mL of brain-derived neurotrophic factor (BDNF), glial cell line-derived neurotrophic factor (GDNF) and ciliary neurotrophic factor (CNTF), human agrin (0.01 µg/mL), and laminin (20 µg/mL) to the myotube compartment (previously defined as the MAB compartment). Add motor neuron basal medium (100 µL/well) without growth factors to the motor neuron compartment.
- Repeat step 7.2 every second day until day 28 of the motor neuron differentiation. No media change is needed during weekends.

Figure 1: Schematic overview of the motor unit protocol in microfluidic devices. Differentiation timeline and co-culture overview from day 0 to day 28 according to the timeline of the motor neuron differentiation protocol22. Motor neuron differentiation from iPSCs is initiated at day 0 and performed as stated previously for the following 10 days15. On day 9, the device is sterilized and coated with PLO-laminin. MABs are thawed for expansion in T75 flasks. On day 10, the motor neuron-NPCs are plated in both wells and the channel of one compartment (light grey) of the device, where their differentiation into motor neurons is continued for a week. MABs are plated in both wells and the channel of the opposite compartment (dark grey) on day 17. On day 18, MABs differentiation into myotubes is begun. On day 21, a volumetric and chemotactic gradient is established to promote motor neuron-neurite polarization through the microgrooves of the device. The motor neuron compartment received 100 µL/well of motor neuron basal medium without growth factors (light green compartment), while the myotube compartment received 200 µL/well of motor neuron basal medium with 30 ng/mL of growth factors (dark green compartment) (Table 2 and Table 3). The culture is continued with the volumetric and chemotactic gradient for an additional 7 days until analysis at day 28. Bright-field images show cell morphology at day 0, day 11, day 18, and day 28 cultured in pre-assembled microfluidic devices. Scale bar, 100 µm. This figure has been modified from Stoklund Dittlau, K. et al.18. Cell illustrations have been modified from Smart Server medical Art22. Please click here to view a larger version of this figure.
8. Fixation and ICC
NOTE: All steps should be done carefully to prevent detachment of the neuronal cultures. Do not remove liquid from the channels during the following steps.
- Perform fixation in a fume hood or laminar flow: Carefully wash all wells in the device once with DPBS before fixation. Fix using 4 % paraformaldehyde (PFA) in DPBS for 15-20 min at RT in the laminar flow (100 µL/well).
CAUTION: PFA is toxic: handle in a fume hood with personal protective equipment.- Carefully add 100 µL to the top well of the device and wait a few seconds to allow the fixation solution to flow through the channel before adding 100 µL to the bottom well. Repeat on the other side. After incubation, remove PFA solution and gently wash 3x for 5 min with DPBS. Leave in 200 µL/well DPBS for storage and seal the 10 cm petri dish with parafilm to store at 4 °C until ICC experiment.
NOTE: Make sure the devices do not dry out during storage.
- Carefully add 100 µL to the top well of the device and wait a few seconds to allow the fixation solution to flow through the channel before adding 100 µL to the bottom well. Repeat on the other side. After incubation, remove PFA solution and gently wash 3x for 5 min with DPBS. Leave in 200 µL/well DPBS for storage and seal the 10 cm petri dish with parafilm to store at 4 °C until ICC experiment.
- Incubate the cells with a permeabilization solution (100 µL/well) of 0.1% Triton X-100 in DPBS for 20 min at RT on day 1 of the ICC procedure. Remove the permeabilization solution, and add 5% normal donkey serum in 0.1% Triton X-100/DPBS solution (100 µL/well) for 30 min at RT.
- Remove the 5% normal donkey serum solution, and incubate devices with primary antibodies (Table of Materials) in 2% normal donkey serum in 0.1% Triton X-100/DPBS solution and incubate at 4 °C overnight.
- Implement a volume gradient. Add 100 µL/well of antibody solution on one side of the microgrooves and 150 µL/well on the other (500 µL total per device).
NOTE: It is possible to use different antibodies on either side of the microgrooves. In this case, do not implement a volume gradient with primary or secondary antibodies across microgrooves to sustain the fluidic isolation between compartments. The neurites in the microgrooves will not be stained without the gradient.
- Implement a volume gradient. Add 100 µL/well of antibody solution on one side of the microgrooves and 150 µL/well on the other (500 µL total per device).
- The following day (day 2 of the ICC procedure), remove the primary antibodies and carefully wash the device 3x for 5 min with 0.1% Triton X-100/DPBS solution.
NOTE: In easily detachable cultures, washing 3x for 5 min can be replaced with 1x for 30 min. - Work in the dark from now on, as secondary antibodies (Table of Materials) are light sensitive. Incubate cells with secondary antibodies in 2% normal donkey serum in 0.1% Triton X-100/DPBS solution for 1 h at RT. Implement a volume gradient as stated in step 8.3.1. After incubation, remove the secondary antibodies and wash 3x for 5 min with DPBS.
- Label the nuclear DNA with DAPI in DPBS (100 µL/well) for 20 min at RT followed by 3x-4x of 5 min wash with 0.1% Triton X-100/DPBS solution. Remove the 0.1% Triton X-100/DPBS solution from all wells and let the culture dry for a few seconds before adding one drop of Fluorescent mounting media in each well to seal.
NOTE: Keep the devices horizontal for at least 24 h to allow the mounting media to set. After 24 h, the devices can be stored in a slide case at 4 °C. - Image in z-stacks with an inverted microscope.
- To image NMJs, use a 40x objective to locate the myotubes marked with a myotube antibody (Table of Materials) and perform z-stack recordings to ensure neuronal and myotube tissue imaging. Take multiple images in case the myotube is too large to fit into a single frame.
- For NMJ quantification, manually count the number of co-localizations between a neuronal presynaptic marker and an AChR marker through each z-stack. Normalize the number of co-localizations to the number of myotubes present in the z-stack.
9. Fixation and preparation of the device for SEM
NOTE: When changing liquids, always keep a small amount to cover the culture to avoid cell collapse. This protocol uses highly toxic substances, and it is required to work with personal protective equipment and in a fume hood during the entire process.
- Fixation and disassembly: Prepare fresh 2.5% glutaraldehyde (GA) in 0.1 M sodium cacodylate buffer (pH 7.6), filter with a 0.2 µm filter, and heat up to 37 °C.
CAUTION: GA and sodium cacodylate are toxic: handle in a fume hood with personal protective equipment.- Carefully wash the device once with DPBS to remove the media and cell debris and then prefix with GA solution for 15 min at RT.
- Use a scalpel to carefully cut the SEM sheet to the perimeter of the device while steadying the device with forceps. Make sure not to detach the device while cutting. Move the device and SEM sheet with the help of forceps to a 3 cm Petri dish and place the 3 cm dish in a 10 cm dish for easy handling.
- After 15 min of prefixation, carefully remove the device from the SEM sheet using forceps. Detach the device in one corner and slowly remove it in a diagonal direction towards the opposite corner. Observe the cells detach from the device.
- Add additional GA solution to cover the entire SEM sheet in the 3 cm dish and continue fixation for a total of 2 h at RT or overnight at 4 °C.
NOTE: Gently push the SEM sheet under the GA solution with forceps by avoiding any cell-covered surfaces.
- Continue with a standard protocol for SEM. In brief, incubate in osmium tetroxide followed by dehydration with a graded series of ethanol. Insert SEM sheet into a coverslip holder for critical point drying and mount on support stubs for carbon-stickers and coating. Use a scanning electron microscope to image at an accelerating voltage of 5 kV and a working distance of 7 mm.
10. Assessment of NMJ functionality using live-cell calcium imaging
- Prepare devices: Refresh myotube compartment with 200 µL/well of day 18 motor neuron basal medium with 30 ng/mL of BDNF, GDNF, and CNTF and the motor neuron compartment with 200 µL/well of motor neuron basal medium without growth factors (Table 2 and Table 3).
- Add Fluo-4 AM dye diluted in Fluo-4 dye solvent to the myotube compartment at a final concentration of 5 µM and incubate the device in the dark at 37 °C, 5% CO2 for 25 min. While the device is under incubation, dilute potassium chloride in motor neuron basal medium without growth factors at a final concentration of 450 mM.
NOTE: Fluo-4 AM is a calcium indicator, which exhibits an increase in fluorescence upon calcium binding. Work in the dark from now on, as the dye is light sensitive. - After 25 min, refresh the myotube compartment with 200 µL/well of day 18 motor neuron basal medium with 30 ng/mL of BDNF, GDNF, and CNTF and the motor neuron compartment with 100 µL/well of motor neuron basal medium without growth factors to re-establish the chemotactic and volumetric gradient.
- To block the NMJs, supplement the myotube compartment medium with 19 µM of the AChR competitive antagonist tubocurarine hydrochloride pentahydrate.
CAUTION: Tubocurarine hydrochloride pentahydrate is toxic: handle in a fume hood with personal protective equipment.
- Add Fluo-4 AM dye diluted in Fluo-4 dye solvent to the myotube compartment at a final concentration of 5 µM and incubate the device in the dark at 37 °C, 5% CO2 for 25 min. While the device is under incubation, dilute potassium chloride in motor neuron basal medium without growth factors at a final concentration of 450 mM.
- Perform recordings with an inverted confocal microscope equipped with an incubator adjusted to 37 °C, 5% CO2.
- With a 10x objective, use the bright field channel to locate the myotubes in the myotube compartment. Adjust the laser power, gain and offset for the 488 channel to a level where the Fluo-4 fluorescence marks the individual myotubes.
NOTE: Representative results were acquired by adjusting the scroll bars in the A1 settings of the software to a laser power of 5%, a gain of 60 (HV), and an offset of 0.
- With a 10x objective, use the bright field channel to locate the myotubes in the myotube compartment. Adjust the laser power, gain and offset for the 488 channel to a level where the Fluo-4 fluorescence marks the individual myotubes.
- Set the recording time to 1 min with 1 s intervals. Record for 5-10 s to have a baseline, followed by immediately stimulating motor neurons with the potassium chloride solution.
- After 5-10 s into the recording, slowly add 25 µL of potassium chloride solution to one well of the motor neuron compartment to reach a final concentration of 50 mM.
NOTE: Avoid adding the potassium chloride solution too fast since this will create a wave through the channel, causing artifacts on the recording.
- After 5-10 s into the recording, slowly add 25 µL of potassium chloride solution to one well of the motor neuron compartment to reach a final concentration of 50 mM.
- Record the myotube compartment with motor neuron stimulation twice with a 2 min pause, followed by direct stimulation with 25 µL potassium chloride solution of the myotube compartment to assess direct myotube activity independent of motor neuron depolarisation.
- For quantifications, circle each myotube manually with the recording software and analyze the Fluo-4 fluorescent intensity over the 1-min time period. To determine the increase in calcium influx, subtract the average baseline value (i.e., average from the first 10 s before potassium chloride stimulation) from the peak value after stimulation with potassium chloride. The representative results were acquired using the software's Time Measurement tool.
Results
Generation of NMJs in microfluidic devices
To generate a human motor unit with functional NMJs in commercially available microfluidic devices, human iPSC-derived motor neurons and human MAB-derived myotubes were used. The quality of the starting cell material is important, and especially the fusion capability of the MABs into myotubes is crucial for a successful outcome of this protocol. MABs are easy to keep in culture. However, it is important to assess the fusion capability of each batch before applying them to the microfluidic devices (Supplemental Figure 1A,B)18. Any batches, which do not show myotube formation after 10 days of differentiation, should not be used. The fusion index in Supplemental Figure 1B was determined by calculating the percentage of nuclei within myotubes positive for each myotube marker of the total number of nuclei per image. We found that a fusion index of approximately 8% was sufficient for our co-culture in generating NMJs.
It is always important to commence a motor neuron differentiation from a pure culture of iPSCs. The purer the input - the purer the outcome. The motor neuron differentiation protocol generates motor neuron cultures, which are typically 85%-95% positive for motor neuron markers (Supplemental Figure 1C,D)18. The remaining cells will usually be undifferentiated precursor cells, which in some cases will undergo extensive proliferation and hereby have a negative impact on the quality of the culture. To get the best outcome of this protocol, the motor neuron differentiation efficiency should be evaluated before applying the day 10 motor neuron-NPCs into the device. In addition, a NPC quality check can be performed at day 11 to evaluate the expression of NPC marker Olig2 (Supplemental Figure 1E,F).
Initially, the motor neuron-NPCs and the MABs were plated at the same time point on day 10. Here, the MAB differentiation was initiated on day 11. The volume and growth factor gradient implemented on day 14 allowed us to evaluate the NMJ formation at day 21, thereby shortening the protocol by one week. Interestingly, we could observe characteristic NMJ formation by ICC (Supplemental Figure 2A). However, we were not able to acquire a functional output via the live-cell calcium recordings this early in the motor neuron differentiation (data not shown). We concluded that the motor neurons were not yet mature enough to form functional NMJ connections with the myotubes, even though the NMJ morphology looked promising. This is in line with our previous observations that spontaneous action potentials in motor neurons, recorded through patch-clamp electrophysiological analysis, only occur at day 35 of motor neuron differentiation15.
In addition, we attempted to prolong motor neuron maturation, as well as the co-culture sustainability, by maturing the motor neurons in the device for 2 weeks (day 24), before plating the MABs. Unfortunately, a large amount of spontaneous motor neuron-neurite crossing through microgrooves was observed, which resulted in the inhibition of MAB attachment (Supplemental Figure 2B). Due to the lack of myotube formation in the channel, we were unsuccessful in identifying NMJs at day 36 and therefore applied the 28-day protocol (Figure 1).
Identification, quantification, and morphological characterization of in vitro NMJs
After following the 28-day protocol (Figure 1), fully functional NMJs could be obtained. Both in vivo and in vitro, NMJs are characterized immunohisto- or immunocytochemically through the co-localization of a presynaptic marker and a postsynaptic marker. In this study, a combination of neurofilament heavy chain (NEFH) and SYP as a presynaptic marker combination was used, which allowed the following of a single neurite from the soma of the motor neuron towards the most distal process. On the muscle side, Btx is widely used as a postsynaptic marker for AChRs, and was likewise used in this study. The supplementation of agrin and laminin promotes the clustering of the AChRs at the sarcolemma19,20,21, making it easier to identify AChRs in vitro and likewise increases the number of AChRs and NMJs present18.
In order to locate and calculate the NMJs in an unbiased manner, each myotube is identified through myosin heavy chain (MyHC)-positivity and imaged in z-stacks at 40x magnification using an inverted confocal microscope. For very long myotubes, multiple z-stacks were acquired. For image analysis, the number of co-localizations between NEFH/SYP and Btx is counted manually through each z-stack, and the number of co-localizations is normalized to the number of myotubes present in the z-stack (Figure 2A-C)18. Not all myotubes will have NMJs, as seen in the quantification of innervated myotubes (Figure 2D). Consequently, it is important to perform an unbiased recording approach, where all myotubes are imaged, independent of Btx presence.
It is possible to identify two types of morphologies in this in vitro system. The NMJs either appear as single contact point NMJs, where a neurite touches upon a cluster of AChRs at one interaction point, or multiple contact point NMJs, where a neurite will fan out and engage with the AChR cluster over a larger surface. These two morphologies can be identified both immunocytochemically (Figure 2A)18 and with SEM (Figure 2B)18, and can likewise be quantified (Figure 2C)18. Overall, the multiple contact points facilitate a broader connection through a large muscle embedment, which points towards a more mature NMJ formation. In contrast, the single contact point NMJs are considered less mature due to the early developmental state of the culture.
Functional evaluation of in vitro NMJs
To evaluate the functionality of the NMJs, live-cell calcium transient recordings were used (Figure 3)18. Taking advantage of the fluidically isolated system of the microfluidic devices, the motor neuron soma side was stimulated with a high concentration (50 mM) of potassium chloride while simultaneously recording an influx in calcium in the myotubes, which were loaded with the calcium-sensitive Fluo-4 dye (Figure 3A). Almost immediately upon motor neuron activation, we could observe a calcium influx in the myotubes through a characteristic wave formation, which confirms a functional connection through the motor neuron-neurite and the myotube (Figure 3A-C)18. No spontaneous calcium waves nor spontaneous myotube contractions were observed, although myotube contraction upon direct stimulation with potassium chloride was observed. The specificity of the connection was further confirmed by adding the competitive AChR antagonist, tubocurarine hydrochloride pentahydrate (DTC) to the myotube compartment (Figure 3A), which resulted in an inhibition of calcium influx (Figure 3C). This effect confirmed that the connection between motor neurons and myotubes resulted in fully functional NMJs. To evaluate the number of active myotubes through NMJ stimulation, the myotube compartment was stimulated directly with potassium chloride to identify the total number of active myotubes in this compartment. Approximately 70% of the myotubes were active through motor neuron-stimulated activation with potassium chloride (Figure 3D)18.
These results confirm the optimal NMJ formation, number, morphology, and functionality through co-culturing of the iPSC-derived motor neurons and MAB-derived myotubes during a 28-day protocol.

Figure 2: NMJ formation in microfluidic devices. (A) Confocal micrographs of NMJ formation in pre-assembled microfluidic devices at day 28. NMJs are identified through the co-localization (arrowheads) of presynaptic markers (NEFH and SYP) and postsynaptic AChR marker (Btx) on MyHC-stained myotubes. NMJs are identified morphologically through single or multiple contact point formation between neurites and AChR clusters. DAPI label nuclei. Scale bar, 25 µm. Inset shows a magnification of an NMJ. Inset scale bar, 10 µm. (B) SEM of NMJ morphology in silicone microfluidic devices at day 28. Arrowheads depict neurite embedment into the myotube. Scale bar, 2 µm. Inset shows a magnification of NMJ. Inset scale bar, 1 µm. (C) Quantification of total number of NMJs per myotube as well as the number of single and multiple contact point NMJs per myotube. Graph is shown as mean ± standard error of the mean from four biological replicates. Statistical significance is determined with Mann-Whitney test with * p < 0.05. (D) Quantification of the percentage of innervated myotubes. Graph is shown as mean ± standard error of the mean from four biological replicates. This figure has been modified from Stoklund Dittlau, K. et al.18. Please click here to view a larger version of this figure.
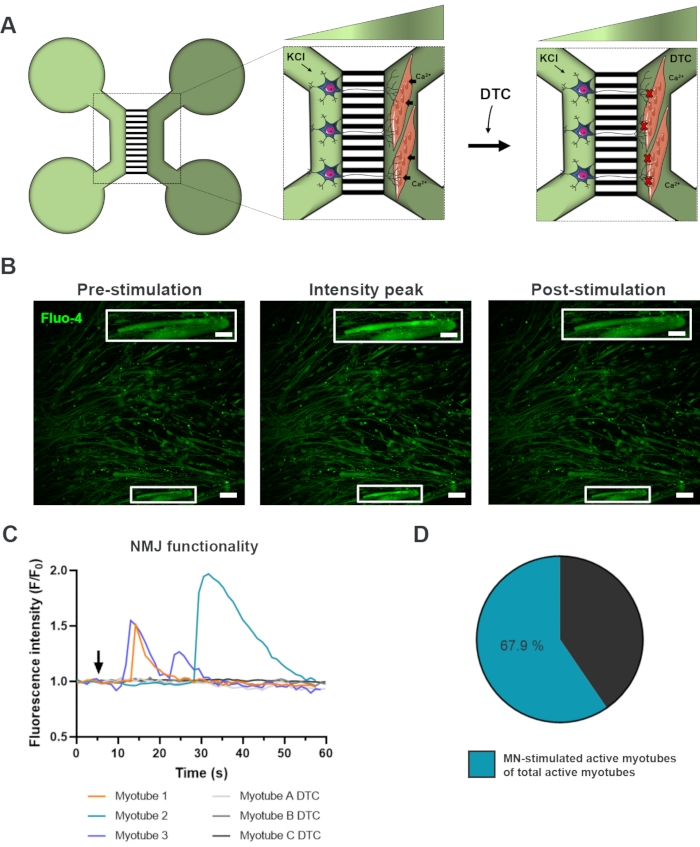
Figure 3: Confirmation of NMJ functionality. (A) Schematic illustration of live-cell transient calcium recordings of NMJ functionality in pre-assembled microfluidic devices at day 28 before and after NMJ blockage with tubocurarine (DTC)22. Motor neurons in the light green compartment are stimulated with 50 mM potassium chloride (KCl), which causes an intracellular motor neuron response through the neurites. This evokes an influx of calcium (Ca2+) in myotubes, which are labeled with calcium-sensitive Fluo-4 dye (dark green compartment). (B) Fluo-4 fluorescence micrographs of pre-stimulation, intensity peak and post-stimulation of a myotube depicting a wave of intracellular calcium increase upon motor neuron stimulation with KCl. Inset shows a magnification of an innervated active myotube. Scale bars, 100 µm. Inset scale bar, 200 µm. (C) Representative calcium influx curves in myotubes after motor neuron stimulation with KCl (arrow) confirming NMJ functionality. Myotube 1-3 show characteristic calcium curves through motor neuron-myotube innervation, while myotube A-C DTC depicts curves after NMJ blocking with DTC. (D) Ratio of motor neuron-stimulated active myotubes on the total number of active myotubes. This figure has been modified from Stoklund Dittlau, K. et al.18. Cell illustrations have been modified from Smart Server medical Art22. Please click here to view a larger version of this figure.
Supplemental Figure 1: Motor neuron verification, MAB fusion index, and NPC quality control. (A) Confocal images of MAB-derived myotubes 10 days after initiation of differentiation. Myotubes are labelled with myotube markers: desmin, MyHC, myogenin (MyoG) and titin. Nuclei are stained with DAPI. Scale bar, 100 µm. (B) Quantification of MAB fusion index 10 days after initiation of differentiation. Upon starvation, MABs fuse into multinucleated myotubes, which were quantified for myotube marker positivity (AB+). Graph depicts mean ± standard error of the mean from three biological replicates. (C) Confocal images of iPSC-derived motor neurons at day 28 of differentiation, which are labelled with motor neuron markers NEFH, choline acetyltransferase (ChAT) and Islet-1 in addition to pan-neuronal marker βIII-tubulin (Tubulin). Nuclei are stained with DAPI. Scale bars, 75 µm. (D) Quantification of the number of cells, which are positive for motor neuron and pan-neuronal markers (AB+). Graph depicts mean ± standard error of the mean from three biological replicates. (E) Confocal images of iPSC-derived NPCs at day 11 of motor neuron differentiation, which are labelled with NPC marker Olig2 and pan-neuronal marker βIII-tubulin (Tubulin). Nuclei are stained with DAPI. Scale bars, 50 µm. (F) Quantification of the number of NPCs, which are positive for Olig2 and βIII-tubulin (AB+). Graph depicts mean ± standard error of the mean from three biological replicates. This figure has been modified from Stoklund Dittlau, K. et al.18. Please click here to download this File.
Supplemental Figure 2: Optimization of co-culture protocol (A) Confocal images of NMJ formation at day 21 of motor neuron differentiation, when MABs are seeded at the same time point as NPCs at day 10. NMJs are identified through the co-localization (arrowheads) of presynaptic markers (NEFH and SYP) and postsynaptic AChR marker (Btx) on MyHC-stained myotubes. Scale bar (left), 10 µm. Scale bar (right), 5 µm. (B) Bright-field image of the myotube channel at day 24 depicting spontaneous motor neuron-neurite crossing inhibiting the attachment of MABs. Scale bar, 100 µm. Please click here to download this File.
| Reagent | Stock concentration | Final concentration |
| IMDM | 1x | 80% |
| Fetal bovine serum | 15% | |
| Penicillin/Streptomycin | 5000 U/mL | 0.5% |
| L-glutamine | 50x | 1% |
| Sodium pyruvate | 100 mM | 1% |
| Non-essential amino acids | 100x | 1% |
| Insulin transferrin selenium | 100x | 1% |
| bFGF (added fresh) | 50 μg/mL | 5 ng/mL |
Table 1: MAB growth medium. Medium can last 2 weeks at 4 °C. bFGF is added fresh on the day of use.
| Reagent | Stock concentration | Final concentration |
| DMEM/F12 | 50% | |
| Neurobasal medium | 50% | |
| Penicillin/Streptomycin | 5000 U/mL | 1% |
| L-glutamine | 50x | 0.5 % |
| N-2 supplement | 100x | 1% |
| B-27 without vitamin A | 50x | 2% |
| β-mercaptoethanol | 50 mM | 0.1% |
| Ascorbic acid | 200 μM | 0.5 μM |
Table 2: Motor neuron basal medium. Medium can last 4 weeks at 4 °C.
| Day | Reagent | Stock concentration | Final concentration | Compartment |
| Day 10/11 | Smoothened agonist | 10 mM | 500 nM | Both |
| Retinoic acid | 1 mM | 0.1 μM | ||
| DAPT | 100 mM | 10 μM | ||
| BDNF | 0.1 mg/mL | 10 ng/mL | ||
| GDNF | 0.1 mg/mL | 10 ng/mL | ||
| Day 14 | DAPT | 100 mM | 20 μM | Both |
| BDNF | 0.1 mg/mL | 10 ng/mL | ||
| GDNF | 0.1 mg/mL | 10 ng/mL | ||
| Day 16 | DAPT | 100 mM | 20 μM | Both |
| BDNF | 0.1 mg/mL | 10 ng/mL | ||
| GDNF | 0.1 mg/mL | 10 ng/mL | ||
| CNTF | 0.1 mg/mL | 10 ng/mL | ||
| Day 18 | BDNF | 0.1 mg/mL | 10 ng/mL | Motor neuron |
| GDNF | 0.1 mg/mL | 10 ng/mL | ||
| CNTF | 0.1 mg/mL | 10 ng/mL | ||
| Day 21+ | BDNF | 0.1 mg/mL | 30 ng/mL | Myotube |
| GDNF | 0.1 mg/mL | 30 ng/mL | ||
| CNTF | 0.1 mg/mL | 30 ng/mL | ||
| Agrin | 50 μg/mL | 0,01 μg/mL | ||
| Laminin | 1 mg/mL | 20 μg/mL | ||
| Day 21+ | No supplements | Motor neuron |
Table 3: Motor neuron medium supplements. Supplements are added fresh on the day of use to the motor neuron basal medium.
| Day | Reagent | Stock concentration | Final concentration | Compartment |
| Day 18 | DMEM/F12 | 97% | MAB | |
| Sodium pyruvate | 100 mM | 1% | ||
| Horse serum | 2% | |||
| Agrin | 50 μg/mL | 0.01 μg/mL |
Table 4: MAB differentiation medium. Medium can last 2 weeks at 4 °C. Agrin is added fresh on the day of use.
Discussion
The protocol describes a relatively easy-to-use method, which generates human motor units with functional NMJs in commercially available microfluidic devices in less than 30 days. It is described how the NMJs can be assessed morphologically through standard techniques such as ICC and SEM and functionally through live-cell calcium recordings.
A large advantage of this protocol is the use of stem cell technology. This allows for full adaptability in which NMJs can be evaluated in both health and disease, independently of the donor profile. The model has proven already successful and beneficial in ALS research, where we identified impairments in neurite outgrowth, regrowth, and NMJ numbers as novel phenotypes due to mutations in the FUS gene18. With this model, it is possible to expand the research to include sporadic forms of ALS, where the etiology is unknown, by using iPSCs from sporadic ALS patients. This provides an advantage over traditional animal models, which rely on transgenic overexpression of mutated genes to recapitulate human disease23,24. In addition, our fully human system allows for potential recapitulation of human-specific physiology and disease. Previous studies demonstrated the differences between rodent and human NMJ morphology25, which suggests that caution must be implemented when using rodents to address human NMJ pathology. Although this system is a relative simple in vitro setup, which lacks the complexity of an in vivo model, it was possible to demonstrate that the NMJ morphology displayed in the microfluidic devices resembled NMJs of human amputates25. Furthermore, this model allows for NMJ evaluation during NMJ formation and maturation, potentially revealing early disease phenotypes, which are absent, unidentifiable, or overlooked in human post-mortem samples.
MABs provide a valid option to generate myotubes, although their limited survival of 10 days is a disadvantage of the system. The myotube survival relies on their attachment to the surface, which is likely compromised by spontaneous contractions of the myofibers. After more than 10 days, most myotubes will have detached, rendering the NMJ culture unusable. Ideally, the myotubes would be generated from iPSCs as well. However, current protocols have proven difficult to reproduce26 due to variability in fusion index27,28,29,30.
By using commercially available microfluidic devices, we generated a standardized system, which is fully accessible. Other NMJ models exist31,32,33,34,35,36,37,38,39,40,41,42. However, they typically rely on single compartments, which lack the compartmentalization and fluidic isolation between cell types, or on custom-made culture vessels, which lowers the availability and potentially also the reproducibility. The microfluidic devices used for this protocol can be purchased with microgrooves of various lengths, which allows for further analysis such as axonal transport43,44 or axotomy18,45,46 investigations. The fluidic isolation between compartments further enables compartmentalized drug treatment of either motor neurons or myotubes, which can be favorable in therapy development. More companies specializing in microfluidics have emerged, which has opened up for a large selection of device design and features, further promoting the accessibility for in vitro research.
In conclusion, we have developed a protocol providing a reliable, versatile and easy method to culture human motor units with functional NMJs.
Disclosures
L.V.D.B. has a patent on the use of HDAC inhibitors in Charcot-Marie-Tooth disease (US-2013227717-A1), is a scientific co-founder of Augustine Therapeutics, and a member of its scientific advisory board. The other authors declare no competing interests.
Acknowledgements
The authors thank Nikky Corthout and Sebastian Munck from LiMoNe, Research Group Molecular Neurobiology (VIB-KU Leuven) for their advice on live-cell calcium transient fluorescence recordings. This research was supported by the Fulbright Commission to Belgium and Luxembourg, KU Leuven (C1 and "Opening the Future" Fund), the VIB, the Agency for Innovation by Science and Technology (IWT; SBO-iPSCAF), the "Fund for Scientific Research Flanders" (FWO-Vlaanderen), Target ALS, the ALS Liga België (A Cure for ALS), the Belgian Government (Interuniversity Attraction Poles Program P7/16 initiated by the Belgian Federal Science Policy Office), the Thierry Latran Foundation and the "Association Belge contre les Maladies neuro-Musculaires" (ABMM). T.V. and J.B. are supported by Ph.D. fellowships awarded by FWO-Vlaanderen.
Materials
| Name | Company | Catalog Number | Comments |
|---|---|---|---|
| α-bungarotoxin (Btx) Alexa fluor 555 | Thermo Fisher Scientific | B35451 | Antibody (1:1000) |
| Acetic Acid | CHEM-Lab NV | CL00.0116.1000 | Coating component. H226, H314. P280 |
| Aclar 33C sheet (SEM sheet) | Electron Microscopy Sciences | 50425-25 | Thickness: 7.8 mil |
| Agrin (recombinant human protein) | R&D systems | 6624-AG-050 | Media supplement |
| Alexa fluor IgG (H+L) 488 donkey-anti rabbit | Thermo Fisher Scientific | A21206 | Antibody (1:1000) |
| Alexa fluor IgG (H+L) 555 donkey-anti goat | Thermo Fisher Scientific | A21432 | Antibody (1:1000) |
| Alexa fluor IgG (H+L) 555 donkey-anti mouse | Thermo Fisher Scientific | A31570 | Antibody (1:1000) |
| Alexa fluor IgG (H+L) 647 donkey-anti mouse | Thermo Fisher Scientific | A31571 | Antibody (1:1000) |
| Ascorbic acid | Sigma | A4403 | Media component |
| βIII-tubulin (Tubulin) | Abcam | ab7751 | Antibody (1:500) |
| β-mercaptoethanol | Thermo Fisher Scientific | 31350010 | Media component. H317. P280. |
| B-27 without vitamin A | Thermo Fisher Scientific | 12587-010 | Media component |
| BDNF (brain-derived neurotrophic factor) | Peprotech | 450-02B | Growth factor |
| bFGF (recombinant human basic fibroblast growth factor) | Peprotech | 100-18B | Growth factor |
| Choline acetyltransferase (ChAT) | Millipore | ab144P | Antibody (1:500) |
| Collagen from calfskin | Thermo Fisher Scientific | 17104019 | Coating component |
| CNTF (ciliary neurotrophic factor) | Peprotech | 450-13B | Growth factor |
| DAPI Nucblue Live Cell Stain ReadyProbes reagent | Thermo Fisher Scientific | R37605 | Immunocytochemistry component |
| DAPT | Tocris Bioscience | 2634 | Media supplement |
| Desmin | Abcam | Ab15200 | Antibody (1:200) |
| DMEM/F12 | Thermo Fisher Scientific | 11330032 | Media component |
| DMSO | Sigma | D2650-100ML | Cryopreservation component. H315, H319, H335. P280. |
| Dulbecco's phosphate-buffered saline (DPBS) | Thermo Fisher Scientific | 14190250 | no calcium, no magnesium |
| Ethanol | VWR | 20.821.296 | Sterilization. H225. P280 |
| Fetal bovine serum | Thermo Fisher Scientific | 10270106 | Media component |
| Fluo-4 AM live cell dye | Thermo Fisher Scientific | F14201 | Calcium imaging dye |
| Fluorescence Mounting Medium | Dako | S3023 | Immunocytochemistry component |
| GDNF (glial cell line-derived neurotrophic factor) | Peprotech | 450-10B | Growth factor |
| Glutaraldehyde | Agar Scientific | R1020 | Fixation component. EUH071, H301, H314, H317, H330, H334, H410. P280. |
| Horse serum | Thermo Fisher Scientific | 16050122 | Media component |
| Human alkaline phosphatase | R&D systems | MAB1448 | Antibody |
| ImageJ software | NIH | ICC analysis | |
| IMDM | Thermo Fisher Scientific | 12440053 | Media component |
| Insulin transferrin selenium | Thermo Fisher Scientific | 41400045 | Media component |
| Islet-1 | Millipore | ab4326 | Antibody (1:400) |
| Knockout serum replacement | Thermo Fisher Scientific | 10828-028 | Cryopreservation component |
| Laminin from Engelbreth-Holm-Swarm murine sarcoma basement membrane | Sigma | L2020-1MG | Coating component and media supplement |
| Leica SP8 DMI8 confocal microscope | Leica | ICC confocal microscopy | |
| L-glutamine | Thermo Fisher Scientific | 25030-024 | Media component |
| Myogenin (MyoG) | Abcam | Ab124800 | Antibody (1:500) |
| Myosin heavy chain (MyHC) | In-house, SCIL | Antibody (1:20) | |
| N-2 supplement | Thermo Fisher Scientific | 17502-048 | Media component |
| Neurobasal medium | Thermo Fisher Scientific | 21103049 | Coating and media component |
| Neurofilament heavy chain (NEFH) | Abcam | AB8135 | Antibody (1:1000) |
| Nikon A1R confocal microscope | Nikon | Live-cell calcium imaging microscopy | |
| NIS-Elements AR 4.30.02 software | Nikon | Live-cell calcium imaging analysis | |
| Non-essential amino acids | Thermo Fisher Scientific | 11140050 | Media component |
| Normal donkey serum | Sigma | D9663-10ML | Immunocytochemistry component |
| Olig2 | IBL | 18953 | Antibody (1:1000) |
| Parafilm M | Sigma | P7793-1EA | Storing equipment |
| Paraformaldehyde | Thermo Fisher Scientific | 28908 | Fixation component. H302, H312, H315, H317, H319, H332, H335, H341, H350. P280. |
| Penicillin/Streptomycin (5000 U/mL) | Thermo Fisher Scientific | 15070063 | Media component |
| Petri dish (3 cm) | nunc | 153066 | Diameter: 3 cm |
| Petri dish (10 cm) | Sarstedt | 833.902 | Diameter: 10 cm |
| Plate (6-well) | Cellstar Greiner bio-one | 657160 | Culture plate |
| Pluronic F-127 | Thermo Fisher Scientific | P3000MP | Fluo-4 dye solvent |
| Poly-L-ornithine (PLO) | Sigma | P3655-100MG | Coating component |
| Potassium chloride | CHEM-Lab NV | CL00.1133.1000 | Calcium imaging reagent |
| Retinoic acid | Sigma | R2625 | Media supplement. H302, H315, H360FD, H410. P280. |
| RevitaCell supplement | Thermo Fisher Scientific | A2644501 | ROCK inhibitor solution |
| Smoothened agonist | Merch Millipore | 566660 | Media supplement |
| Sodium cacodylate buffer | Sigma | C0250 | Fixation component. H301, H331, H350, H410. P280. |
| Sodium pyruvate | Life Technologies | 11360-070 | Media component |
| Synaptophysin (SYP) | Cell Signaling | 5461S | Antibody (1:1000) |
| T75 flask | Sigma | CLS3276 | Culture plate |
| Titin | Developmental Studies Hybridoma Bank | 9D10 | Antibody (1:300) |
| Triton X-100 | Sigma | T8787-250ML | Immunocytochemistry component. H302, H315, H318, H319, H410, H411. P280 |
| TrypLE express | Thermo Fisher Scientific | 12605010 | MAB dissociation solution |
| Tubocyrarine hydrochloride pentahydrate | Sigma | T2379-100G | Acetylcholine receptor blocker. H301. P280. |
| XonaChips pre-assembled microfluidic device | Xona Microfluidics | XC150 | Microgroove length: 150 μm |
| Xona Silicone microfluidics device | Xona Microfluidics | SND75 | Microgroove length: 75 μm |
References
- Plomp, J. J. Neuromuscular junction physiology and pathophysiology. Myasthenia Gravis and Related Disorders. Kaminski, H. J., Kusner, L. L. , Springer International Publishing. 1-12 (2018).
- Dadon-Nachum, M., Melamed, E., Offen, D. The 'dying-back' phenomenon of motor neurons in ALS. Journal of Molecular Neuroscience. 43 (3), 470-477 (2010).
- Murray, L. M., Talbot, K., Gillingwater, T. H. Neuromuscular synaptic vulnerability in motor neuron disease: Amyotrophic lateral sclerosis and spinal muscular atrophy. Neuropathology and Applied Neurobiology. 36 (2), 133-156 (2010).
- Rowland, L. P., Shneider, N. A. Amyotrophic lateral sclerosis. The New England Journal of Medicine. 344 (22), 1688-1700 (2001).
- Fischer, L. R., et al. Amyotrophic lateral sclerosis is a distal axonopathy: Evidence in mice and man. Experimental Neurology. 185 (2), 232-240 (2004).
- Martineau, É, Di Polo, A., Van de Velde, C., Robitaille, R. Dynamic neuromuscular remodeling precedes motor-unit loss in a mouse model of ALS. eLife. 7, 41973(2018).
- Sleigh, J. N., Gillingwater, T. H., Talbot, K. The contribution of mouse models to understanding the pathogenesis of spinal muscular atrophy. Disease Models and Mechanisms. 4 (4), 457-467 (2011).
- Nair, G., et al. Diffusion tensor imaging reveals regional differences in the cervical spinal cord in amyotrophic lateral sclerosis. NeuroImage. 53 (2), 576-583 (2010).
- So, E., et al. Mitochondrial abnormalities and disruption of the neuromuscular junction precede the clinical phenotype and motor neuron loss in hFUSWT transgenic mice. Human Molecular Genetics. 27 (3), 463-474 (2018).
- Tallon, C., Russell, K. A., Sakhalkar, S., Andrapallayal, N., Farah, M. H. Length-dependent axo-terminal degeneration at the neuromuscular synapses of type II muscle in SOD1 mice. Neuroscience. 312, 179-189 (2016).
- Walker, A. K., et al. Functional recovery in new mouse models of ALS/FTLD after clearance of pathological cytoplasmic TDP-43. Acta Neuropathologica. 130 (5), 643-660 (2015).
- Campenot, R. B. Local control of neurite development by nerve growth factor. Proceedings of the National Academy of Sciences of the United States of America. 74 (10), 4516-4519 (1977).
- Taylor, A. M., et al. A microfluidic culture platform for CNS axonal injury, regeneration and transport. Nature Methods. 2 (8), 599-605 (2005).
- Taylor, A. M., et al. Microfluidic multicompartment device for neuroscience research. Langmuir. 19 (5), 1551-1556 (2003).
- Guo, W., et al. HDAC6 inhibition reverses axonal transport defects in motor neurons derived from FUS-ALS patients. Nature Communications. 8 (1), 861(2017).
- Maury, Y., et al. Combinatorial analysis of developmental cues efficiently converts human pluripotent stem cells into multiple neuronal subtypes. Nature Biotechnology. 33 (1), 89-96 (2014).
- Giacomazzi, G., et al. Isolation of mesoangioblasts: A subset of pericytes with myogenic potential. Pericytes: Methods and Protocols. Péault, B. M. , Springer, US. 155-167 (2021).
- Stoklund Dittlau, K., et al. Human motor units in microfluidic devices are impaired by FUS mutations and improved by HDAC6 inhibition. Stem Cell Reports. , (2021).
- Afshar Bakooshli, M., et al. A 3D culture model of innervated human skeletal muscle enables studies of the adult neuromuscular junction. eLife. 8, 44530(2019).
- Burkin, D. J., Kim, J. E., Gu, M., Kaufman, S. J. Laminin and alpha 7 beta 1 integrin regulate agrin-induced clustering of acetylcholine receptors. Journal of Cell Science. 113 (16), 2877-2886 (2000).
- Zhang, B. G. X., et al. Combination of agrin and laminin increase acetylcholine receptor clustering and enhance functional neuromuscular junction formation In vitro. Developmental Neurobiology. 76 (5), 551-565 (2016).
- Smart Servier Medical Art. , Available from: https://smart.servier.com/ (2021).
- Morrice, J. R., Gregory-Evans, C. Y., Shaw, C. A. Animal models of amyotrophic lateral sclerosis: A comparison of model validity. Neural Regeneration Research. 13 (12), 2050-2054 (2018).
- Greek, R., Hansen, L. A. Questions regarding the predictive value of one evolved complex adaptive system for a second: Exemplified by the SOD1 mouse. Progress in Biophysics and Molecular Biology. 113 (2), 231-253 (2013).
- Jones, R. A., et al. Cellular and Molecular Anatomy of the Human Neuromuscular Junction. Cell Reports. 21 (9), 2348-2356 (2017).
- Jiwlawat, N., Lynch, E., Jeffrey, J., Van Dyke, J. M., Suzuki, M. Current progress and challenges for skeletal muscle differentiation from human pluripotent stem cells using transgene-free approaches. Stem Cells International. , 6241681(2018).
- Chal, J., et al. Generation of human muscle fibers and satellite-like cells from human pluripotent stem cells in vitro. Nature Protocols. 11 (10), 1833-1850 (2016).
- vander Wal, E., et al. Large-scale expansion of human iPSC-derived skeletal muscle cells for disease modeling and cell-based therapeutic strategies. Stem Cell Reports. 10 (6), 1975-1990 (2018).
- Choi, I. Y., et al. Concordant but varied phenotypes among duchenne muscular dystrophy patient-specific myoblasts derived using a human iPSC-based model. Cell Reports. 15 (10), 2301-2312 (2016).
- Choi, I. Y., Lim, H. T., Che, Y. H., Lee, G., Kim, Y. J. Inhibition of the combinatorial signaling of transforming growth factor-beta and NOTCH promotes myotube formation progenitor cells. Cells. 10 (7), 1649(2021).
- Demestre, M., et al. Formation and characterisation of neuromuscular junctions between hiPSC derived motoneurons and myotubes. Stem Cell Research. 15 (2), 328-336 (2015).
- Guo, X., Gonzalez, M., Stancescu, M., Vandenburgh, H. H., Hickman, J. J. Neuromuscular junction formation between human stem cell-derived motoneurons and human skeletal muscle in a defined system. Biomaterials. 32 (36), 9602-9611 (2011).
- Zahavi, E. E., et al. A compartmentalized microfluidic neuromuscular co-culture system reveals spatial aspects of GDNF functions. Journal of Cell Science. 128 (6), 1241-1252 (2015).
- Vila, O. F., et al. Quantification of human neuromuscular function through optogenetics. Theranostics. 9 (5), 1232-1246 (2019).
- Lin, C. Y., et al. IPSC-derived functional human neuromuscular junctions model the pathophysiology of neuromuscular diseases. JCI Insight. 4 (18), 124299(2019).
- Puttonen, K. A., et al. Generation of functional neuromuscular junctions from human pluripotent stem cell lines. Frontiers in Cellular Neuroscience. 9, 473(2015).
- Umbach, J. A., Adams, K. L., Gundersen, C. B., Novitch, B. G. Functional neuromuscular junctions formed by embryonic stem cell-derived motor neurons. PLoS ONE. 7, 36049(2012).
- Bellmann, J., et al. A customizable microfluidic platform for medium-throughput modeling of neuromuscular circuits. Biomaterials. 225, 119537(2019).
- Mills, R., et al. Neurturin is a PGC-1α1-controlled myokine that promotes motor neuron recruitment and neuromuscular junction formation. Molecular Metabolism. 7, 12-22 (2018).
- Osaki, T., Uzel, S. G. M., Kamm, R. D. Microphysiological 3D model of amyotrophic lateral sclerosis (ALS) from human iPS-derived muscle cells and optogenetic motor neurons. Science Advances. 4 (10), (2018).
- Santhanam, N., et al. Stem cell derived phenotypic human neuromuscular junction model for dose-response evaluation of therapeutics. Biomaterials. 166, 64-78 (2018).
- Southam, K. A., King, A. E., Blizzard, C. A., McCormack, G. H., Dickson, T. C. Microfluidic primary culture model of the lower motor neuron-neuromuscular junction circuit. Journal of Neuroscience Methods. 218 (2), 164-169 (2013).
- Naumann, M., et al. Impaired DNA damage response signaling by FUS-NLS mutations leads to neurodegeneration and FUS aggregate formation. Nature Communications. 9 (1), 335(2018).
- Altman, T., Maimon, R., Ionescu, A., Pery, T. G., Perlson, E. Axonal transport of organelles in motor neuron cultures using microfluidic chambers system. Journal of Visualized Experiments. (159), e60993(2020).
- Nijssen, J., Aguila, J., Hoogstraaten, R., Kee, N., Hedlund, E. Axon-seq decodes the motor axon transcriptome and its modulation in response to ALS. Stem Cell Reports. 11 (6), 1565-1578 (2018).
- Melamed, Z., et al. Premature polyadenylation-mediated loss of stathmin-2 is a hallmark of TDP-43-dependent neurodegeneration. Nature Neuroscience. 22 (2), 180-190 (2019).
Reprints and Permissions
