A pendant drop surface film balance implemented with a multi-subphase exchange, nicknamed the OCTOPUS, allows for mimicking digestive conditions by the sequential subphase exchange of the original bulk solution with simulated gastrointestinal fluids. The simulated in vitro digestion is monitored by recording in situ the interfacial tension of the digested interfacial layer.
Method Article
In vitro Digestion of Emulsions in a Single Droplet via Multi Subphase Exchange of Simulated Gastrointestinal Fluids
In This Article
Summary
Abstract
Emulsions are currently being used to encapsulate and deliver nutrients and drugs to tackle different gastrointestinal conditions such as obesity, nutrient fortification, food allergies, and digestive diseases. The ability of an emulsion to provide the desired functionality, namely, reaching a specific site within the gastrointestinal tract, inhibiting/retarding lipolysis, or facilitating digestibility, ultimately depends on its susceptibility to enzymatic degradation in the gastrointestinal tract. In oil-in-water emulsions, lipid droplets are surrounded by interfacial layers, where the emulsifiers stabilize the emulsion and protect the encapsulated compound. Achieving a tailored digestibility of emulsions depends on their initial composition but also requires monitoring the evolution of those interfacial layers as they are subjected to different phases of gastrointestinal digestion. A pendant drop surface film balance implemented with a multi-subphase exchange allows for simulating the in vitro digestion of emulsions in a single aqueous droplet immersed in oil by applying a customized static digestion model. The transit through the gastrointestinal tract is mimicked by the subphase exchange of the original droplet bulk solution with artificial media, mimicking the physiological conditions of each compartment/step of the gastrointestinal tract. The dynamic evolution of the interfacial tension is recorded in situ throughout the whole simulated gastrointestinal digestion. The mechanical properties of digested interfaces, such as interfacial dilatational elasticity and viscosity, are measured after each digestion phase (oral, gastric, small intestine). The composition of each digestive media can be tuned to account for the particularities of the digestive conditions, including gastrointestinal pathologies and infant digestive media. The specific interfacial mechanisms affecting proteolysis and lipolysis are identified, providing tools to modulate digestion by the interfacial engineering of emulsions. The obtained results can be manipulated for designing novel food matrices with tailored functionalities such as low allergenicity, controlled energy intake, and decreased digestibility.
Introduction
Understanding how fat is digested, which involves emulsion digestion, is important to rationally design products with tailored functionality1. The substrate for fat digestion is an emulsion since fat is emulsified upon consumption by mechanical action and mixing with biosurfactants in the mouth and stomach. Also, most of the fat consumed by humans is already emulsified (such as milk products), and in the case of infants or some elderly people, this is the only form of consumption. Hence, the design of emulsion-based products with specific digestion profiles is very important in nutrition1. Moreover, emulsions can encapsulate and deliver nutrients, drugs, or lipophilic bioactives2 to tackle different gastrointestinal conditions such as obesity3, nutrient fortification, food allergies, and digestive diseases. In oil-in-water emulsions, lipid droplets are surrounded by interfacial layers of emulsifiers such as proteins, surfactants, polymers, particles, and mixtures4. The role of emulsifiers is twofold: stabilize the emulsion5 and protect/transport the encapsulated compound to a specific site. Achieving a tailored digestibility of emulsions depends on their initial composition but also requires monitoring the continuous evolution of this interface during the transit through the gastrointestinal tract (Figure 1).

Figure 1: Applying interfacial engineering of emulsions to tackle some of the main gastrointestinal conditions. Please click here to view a larger version of this figure.
Lipid digestion is ultimately an interfacial process because it requires the adsorption of lipases (gastric or pancreatic) onto the oil-water interface of emulsified lipid droplets through the interfacial layer to reach and hydrolyze the triglycerides contained in the oil into free fatty acids and monoacylglycerides6. This is schematized in Figure 2. Gastric lipase competes with pepsin and phospholipids in the stomach for the oil-water interface (Figure 2, gastric digestion). Then, pancreatic lipase/colipase compete with trypsin/chymotrypsin, phospholipids, bile salts, and digestive products in the small intestine. Proteases can alter the interfacial coverage, preventing or favoring lipase adsorption, while bile salts are highly surface active and displace most of the remaining emulsifier to promote lipase adsorption (Figure 2, intestinal digestion). Eventually, the rate and extent of lipolysis depend on the interfacial properties of the initial/gastric digested emulsion, such as the thickness, inter/intramolecular connections, and electrostatic and steric interactions. Accordingly, monitoring the evolution of the interfacial layer as it is digested offers an experimental platform to identify interfacial mechanisms and events affecting lipase adsorption and, hence, lipid digestion.

Figure 2: Schematic diagram illustrating the role of interfaces in gastrointestinal lipid digestion. Pepsin hydrolysis alters interfacial composition at the gastric phase, while gastric lipase hydrolyzes triglycerides. In the small intestine, trypsin/chymotrypsin further hydrolyze the interfacial film, while lipolysis proceeds by the adsorption of BS/lipases, the hydrolysis of triglycerides, and the desorption of lipolytic products by solubilization in the BS micelles/complex. Please click here to view a larger version of this figure.
The pendant drop equipment at the University of Granada (UGR) is implemented with a patented technology, the coaxial double capillary, that enables subphase exchange of the bulk solution7. The capillary, which holds the pendant drop, consists of an arrangement of two coaxial capillaries that are independently connected to each channel of a double microinjector. Each microinjector can operate independently, allowing the exchange of the dropped content by through-flow7. Accordingly, the subphase exchange consists of the simultaneous injection of the new solution with the inner capillary and the extraction of the bulk solution with the outer capillary using the same flow rate. This process allows the replacement of the bulk solution with no disturbance of the interfacial area or the volume of the droplet. This procedure was later upgraded to a multi-subphase exchange, which allows up to eight sequential subphase exchanges of the droplet bulk solution8. This enables the simulation of the digestive process in a single aqueous droplet suspended in lipidic media by sequentially exchanging the bulk solution with artificial media mimicking the different compartments (mouth, stomach, small intestine). The whole setup is represented in Figure 3, including the details of the components. The syringes in the microinjector are connected to the eight vias valves, each connecting to a microcentrifuge tube containing the artificial digestive fluid with components described in Figure 2.
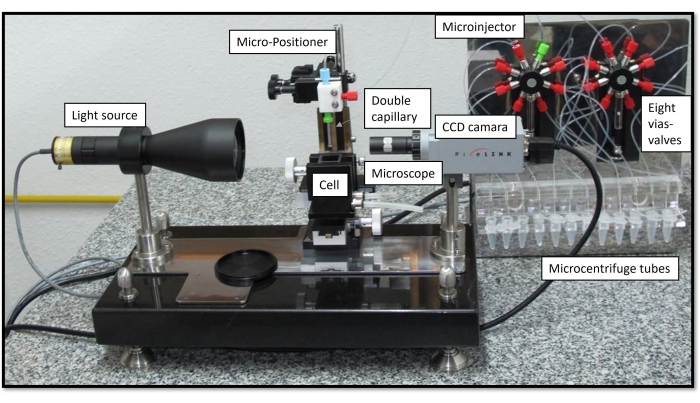
Figure 3: General view of the OCTOPUS with all components. The CCD camera, microscope, micro-positioner, thermostabilized cell, and double capillary connected independently to a double microinjector with two syringes connected to eight vias valves. Each syringe connects with capillary, four microcentrifuge tubes with sample and one discharge. Please click here to view a larger version of this figure.
Figure 4A shows how each of the artificial digestive fluids is injected into the pendant drop by subphase exchange through the double capillary. Each digestive compound detailed in Figure 2 can be applied simultaneously/sequentially, simulating the passage through the gastrointestinal tract. The artificial digestive fluids contain different enzymes and biosurfactants, which alter the interfacial tension of the initial emulsifier, as schematized in Figure 4B. The software DINATEN (see Table of Materials), also developed at the UGR, records the evolution of the interfacial tension in real time as the initial interfacial layer is digested in vitro. Also, after each digestive phase, the dilatational elasticity of the interfacial layer is computed by imposing periodic oscillations of volume/interfacial area onto the stabilized interfacial layer and recording the response of the interfacial tension. The period/frequency and the amplitude of the oscillation can be varied, and image processing with the software CONTACTO provides the dilatational rheological parameters8.

Figure 4: Examples of digestion profiles. (A) The initial emulsifier layer is subjected to artificial digestive media placed in the microcentrifuge by sequential subphase exchange of the different solutions into the pendant drop. (B) The general evolution of the interfacial tension (y-axis) of the initial emulsifier as a function of time (x-axis) as it is digested in vitro by the various enzymes/biosurfactants in the artificial media. A final subphase exchange with plain intestinal fluid measures the desorption of digested lipid by solubilization in mixed micelles. Please click here to view a larger version of this figure.
This study presents the general protocol designed to measure in vitro digestion of interfacial layers with pendant drop equipment9. The initial interfacial layer is subjected sequentially to conditions mimicking the passage through the gastrointestinal tract, as depicted in Figure 2. These different digestive media are injected into the pendant drop by subphase exchange of the different solutions contained in the microcentrifuge tubes (Figure 4A). The composition of these media can be customized depending on the gastrointestinal conditions that will be evaluated, namely, gastric/intestinal proteolysis/lipolysis, allowing for measuring cumulative effects and sinergies10. The experimental conditions used to mimic the digestion process in each compartment follow the international consensus protocol published by INFOGEST detailing the pH and amounts of electrolytes and enzymes11. The experimental device based on pendant drop allows recording of the interfacial tension in situ throughout the simulated digestion process. The dilatational rheology of the interfacial layer is computed at the end of each digestive step. In this way, each emulsifier offers a digestion profile illustrating the properties of the digested interfaces, as depicted in Figure 4B. This allows the extraction of conclusions regarding its susceptibility or resistance to the different stages of the digestive process. In general, the artificial digestive media contains acid/basic pH, electrolytes, proteases (gastric and intestinal), lipases (gastric and intestinal), bile salts, and phospholipids, which are dissolved in their respective digestive fluids (gastric or intestinal). Figure 4B shows a generic profile of the evolution of an emulsifier's interfacial tension, first subjected to protease action, followed by lipases. In general, proteolysis of the interfacial layer promotes an increase in the interfacial tension owing to the desorption of hydrolyzed peptides9,12, while lipolysis results in a very steep reduction in the interfacial tension due to the adsorption of bile salts and lipases13. A final subphase exchange with intestinal fluid depletes the bulk solution of unadsorbed/digested material and promotes the desorption of soluble compounds and the solubilization of digested lipids in mixed micelles. This is quantified by the increased interfacial tension recorded (Figure 4B).
In summary, the experimental design implemented in the pendant drop to simulate in vitro digestion in a single droplet allows for measuring cumulative effects and synergies as the digestion process is applied sequentially to the initial interfacial layer10. The composition of each digestive media can be easily tuned to account for the particularities of the digestive conditions, including gastrointestinal pathologies or infant digestive media14. Then, identification of the interfacial mechanisms affecting proteolysis and lipolysis can be used to modulate digestion by the interfacial engineering of emulsions. The obtained results can be applied in designing novel food matrices with tailored functionalities such as low allergenicity, controlled energy intake, and decreased digestibility15,16,17,18,19.
Protocol
1. Cleaning sequence for all glassware used in surface science experimentation
- Scrub the glassware with a concentrated cleaning solution (see Table of Materials) diluted in water (10%).
- Rinse thoroughly with a sequence of tap water, propanol, distilled water, and ultrapure water. Dry in a cabin and store in a closed cabinet until use.
2. Sample preparation
- Prepare artificial digestive media according to INFOGEST standardized protocols11,20 (see Table of Materials). For details, see Table 1 and include small adaptations to the requirements of the interfacial work to prevent surface active contamination and the dilution of samples (1:10)10.
- Prepare the emulsifier solution following the steps below.
- Prepare 0.01 L of a concentrated solution of (1 kg·L−1) emulsifier or a mixture of emulsifiers (see Table of Materials) in an initial buffer (Table 1) and keep under mild agitation overnight.
- Dilute to 0.1 kg·L−1 (or as required) to saturate the interface; reach a pseudo plateau in the interfacial tension after 1 h of adsorption at a constant interfacial area following the previously published report21.
- Keep under mild agitation for 15 min before use.
- Purify the oil phase.
- Prepare a mixture of vegetable oil (sunflower, olive, triolein, etc. )and magnesium metasilicate resins (see Table of Materials) in a proportion of 2:1 w/w in a large beaker. Keep under mild mechanical agitation for at least 3 h.
- Centrifuge the mixture at 8,000 x g for 30 min at room temperature in a commercial centrifuge (see Table of Materials).
- Filter the oil mixture under vacuum with a syringe filter (0.2 µm pore size) (see Table of Materials). Store in clean amber bottles sealed and bubbled with nitrogen until use.
3. Calibration and cleaning of the OCTOPUS
- Rinse all the tubing with ultrapure water by setting a sequence of cleaning both syringes and all valves through a capillary (valves 6/4) and to the external exit (valve 8-blue color). Perform this by pressing the clean button in the left dialog (Supplementary Figure 1A).
- Check the surface tension7 of water at room temperature by forming a water droplet and measuring in real time for 5 min (Supplementary Figure 1B, C).
- Set the differential density to air-water (0.9982 kg·L−1) in the left dialog, Supplementary Figure 1B.
- Fill the clean cuvette (optical glass) with 0.002 L of clean vegetable oil and place it in the cuvette holder in the thermostatic cell (Figure 3).
- Set the thermostat and allow for temperature equilibration at 37 °C.
- Check the interfacial tension of water-oil at room temperature7.
- Set the differential density to vegetable oil-water (olive oil: 0.800 kg·L−1) (Supplementary Figure 1C).
- Inject 40 µL at a rate of 0.5 µL·s−1 and measure in real time every second until the end of the injection. This is a simple dynamic process (Supplementary Figure 1B, D).
- Plot the interfacial tension as a function of droplet volume in a data sheet.
- Check that the droplet volume range provides a value for the interfacial tension independent of the droplet volume. Plot the interfacial area as a function of droplet volume.
- Program a process containing two steps (Supplementary Figure 1B and Supplementary Figure 2A) following the steps below.
- With an inner syringe, inject a volume contained within this range of constant interfacial tension.
- Maintain the interfacial area constant at the value selected in step 3.5.4 and record the interfacial tension for 5 min7.
4. Programming one experimental process in DINATEN for each digestive step
NOTE: For the process parameters, see Supplementary Figure 1B.
- Perform the initial control.
- For drop formation, inject 10 µL (±5 µL) of emulsifier solution into the capillary (valve 6) (Supplementary Figure 2A).
- Record the adsorption at a constant interfacial area21 of 20 mm2 (±10 mm2) for 1 h (Supplementary Figure 2B).
- Record the dilatational rheology8 (Supplementary Figure 2C).
- Set the amplitude of oscillation to 1.25 µL, period 10 s.
- Record the adsorption at the selected interfacial area (step 4.1.2) for 10 s.
- Repeat step 4.1.3 at different periods: 5 s, 20 s, 50 s, and 100 s.
- Record gastric digestion.
- Record the adsorption21 at the selected interfacial area for 10 s.
- Subphase exchange7 with liquid in valve 2 (sSGF) and gastric enzymes (Table 1) (Supplementary Figure 2D).
- Fill the left syringe from valve 2. Inject 125 µL into valve 6-capillary with the left syringe at 5 µL·s−1.
- Extract 125 µL from the capillary with the right syringe at 5 µL·s−1. Unload the right syringe to exit valve 8. Repeat steps 4.2.2.1-4.2.2.2 10 times to assure complete exchange.
- Record the adsorption21 at the selected interfacial area in step 4.1.2 for 1 h (Supplementary Figure 2B).
- Record the dilatational rheology8 (Supplementary Figure 2C).
- Set the amplitude of oscillation to 1.25 µL, period 10 s.
- Record the adsorption of the selected interfacial area in step 4.1.2 for 10 s. Repeat at different periods: 5 s, 20 s, 50 s, 100 s.
- Record intestinal digestion.
- Record the adsorption21 at the selected interfacial area in step 4.1.2 for 10 s (Supplementary Figure 2B).
- Subphase exchange7 with liquid in valve 3 (sSIF) and intestinal enzymes/bile salts/phospholipids (Table 1) (Supplementary Figure 2D).
- Fill the left syringe from valve 2. Inject 125 µL into valve 6-capillary with the left syringe at 5 µL·s−1. Extract 125 µL from the capillary with the right syringe at 5 µL·s−1.
- Unload the right syringe to exit valve 8. Repeat steps 4.3.2.1-4.3.2.2 10 times to assure complete exchange.
- Record the adsorption21 at the selected interfacial area in step 4.1.2 for 1 h.
- Record the dilatational rheology8 (Supplementary Figure 2C).
- Set the amplitude of oscillation to 1.25 µL, period 10 s.
- Record the adsorption at the selected interfacial area in step 4.1.2 for 10 s.
- Repeat at different periods: 5 s, 20 s, 50 s, 100 s.
- Record the desorption following the steps below.
- Record the adsorption21 at the selected interfacial area in step 4.1.2 for 10 s (Supplementary Figure 2B).
- Subphase exchange7 with liquid in valve 5 (sSIF) (Table 1, Supplementary Figure 2D).
- Fill the left syringe from valve 5. Inject 125 µL into valve 5-capillary with the left syringe at 5 µL·s−1.
- Extract 125 µL from the capillary with the right syringe at 5 µL·s−1. Unload the right syringe to exit valve 8. Repeat steps 4.4.2.1-4.4.2.2 10 times to assure complete exchange.
- Record the adsorption21 at the selected interfacial area in step 4.1.2 for 1 h (Supplementary Figure 2B).
- Record the dilatational rheology8 (Supplementary Figure 2C).
- Maintain the amplitude of 1.25 µL, period 10 s.
- Record the adsorption at the selected interfacial area in step 4.1.2 for 10 s.
- Repeat step 4.4.4 at different periods: 5 s, 20 s, 50 s, 100 s.
5. Setting up the experiment
- Fill the microcentrifuge tubes with the artificial digestion media and connect each of them to the respective valve by the corresponding tubing.
- Fill the tubing in valves 2-5 by cleaning from valve 2, valve 3, valve 4, and valve 5 to the external exit (valve 8) (Supplementary Figure 1A).
- Fill the tubing in valve 1 by cleaning from valve 1 to valve 6-capillary 5 times.
- Place the capillary into the oil phase. Load the left syringe with valve 1 (initial solution, Table 1).
- Start sequentially processing step 4.1-initial, step 4.2-gastric, step 4.3-intestines, and step 4.4-desorption, saving the data at the end of each process.
6. Calculation of the dilatational rheological parameters with the image processing software CONTACTO8
NOTE: For details, see Maldonado-Valderrama et al.8.
- Load the images corresponding to the area oscillation at a given frequency and amplitude (Supplementary Figure 3A).
- Press Rheology (Supplementary Figure 3B) and obtain the dilatational parameters (Supplementary Figure 3C).
- Copy-paste the results into the data spread sheet.
7. Plotting the experimental results
- Recalculate the time column in each of the steps of the digestion process by adding the last data of the time of the previous step.
- Plot the interfacial tension versus additive time for each of the steps of the digestion process used.
- Plot the final interfacial tension/dilatational elasticity and viscosity obtained at the end of each step versus the digestion phase: initial, gastric digestion, duodenal digestion, and desorption.
Results
This section shows different examples of digestion profiles measured with the OCTOPUS. The general appearance of the simulated digestion profile matches is shown in Figure 4B. The interfacial tension is usually represented against time in the digestion profile. The different phases/digestion steps considered are represented in different colors. The first phase forms the initial layer and corresponds to the adsorption phase of the emulsifier or protein/surfactant/polymer, depending on each case. Then, the different digestive fluids are injected by subphase exchange into a bulk solution containing the new media. The new subphase produces changes in the interfacial tension of the initial emulsifier layer and in the dilatational rheology measured at the end of each digestive step. The digestion process can comprise a maximum of eight digestive steps.

Figure 5: Example of gastric digestion profiles. (A) Gastric proteolysis of human serum albumin. Digestive media are applied by subphase exchange with solutions detailed in the experimental section at T = 37 °C. Blue: initial buffer with protein, red: sSGF with pepsin. Reprinted with permission from del Castillo-Santaella et al.12. (B) Gastric lipolysis of citrus pectin. Digestive media are applied by subphase exchange with solutions detailed in the experimental section at T = 37 °C. Blue: initial buffer with citrus pectin, yellow: sSGF with gastric lipase, grey: sSGF. Reprinted with permission from Infantes-Garcia et al.17. Please click here to view a larger version of this figure.
Figure 5 shows some experimental results obtained for the gastric digestion of emulsifiers. In Figure 5A, human serum albumin (HSA)12 is first adsorbed onto the olive oil-water interface, decreasing the interfacial tension to reach a plateau after 1 h. At the end of this phase, the rheology is measured at 0.1 Hz (10 s) of frequency (period). In the second step, sSGF with pepsin is added by subphase exchange. This consists of introducing a volume with one syringe while extracting the same volume with the other syringe. In this way, the area of the drop does not change, maintaining the irreversibly adsorbed components at the oil-water interface. The exchange is repeated between 10-15 times. During subphase exchange with sSGF and pepsin, the interfacial tension increases owing to hydrolysis of the protein, which dilutes the initial protein layer (Figure 5A). In Figure 5B, citrus pectin (CP)17 adsorbs onto the triglyceride oil-water for 40 min, followed by dilatational rheology at 0.1 Hz. In the second step, sSGF with gastric lipase is injected into the bulk of the drop; conversely to proteolysis, lipolysis results in the adsorption of lipase and the formation of fatty acids, which remain at the interface, reducing the interfacial tension. The desorption phase is the third step, which assesses the production of hydrophilic or the solubilization of lipophilic products of lipolysis. Figure 5B shows that subphase exchange with sSGF provides a null response of the interfacial tension. This can be interpreted as the production of lipophilic digestive products, which adsorb irreversibly and are not solubilized, remaining anchored at the interface. The absence of bile salts in the gastric phase is responsible for the lack of solubilization. The degree of lipolysis can be qualitatively analyzed by the value of interfacial tension reached.
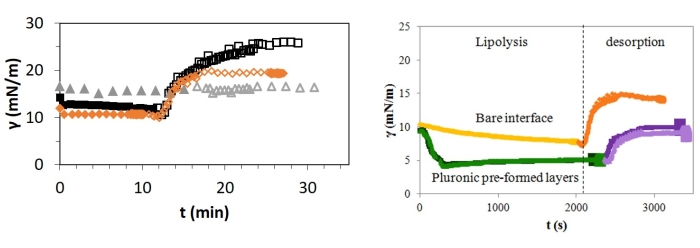
Figure 6: Example of intestinal digestion profiles. (A) Adsorption-desorption profiles of bile salts (black squares), lipase (grey triangles), and lipase + bile salts (orange rhomboids) in sSIF at 37 °C. Reprinted with permission from Macierzanka et al.13. (B) Adsorption of bile salts + lipase onto previously adsorbed F68 (dark green) and F127 (light green), adsorption of bile salts (yellow) in sSIF. Desorption: subphase exchange with sSIF on bile salts (orange), F68 (dark purple), and F127 (light purple). Reprinted with permission from Torcello-Gómez et al.19. Please click here to view a larger version of this figure.
Figure 6 shows the experimental results obtained for the intestinal digestion of emulsifiers. In contrast to gastric digestion, the presence of bile salts in the small intestine offers different desorption profiles upon subphase exchange with sSIF and depletion of the bulk solution. Figure 6A shows the desorption profiles obtained for pure bile salts, pure lipase, and mixed lipase/bile salts8,9,10,13. Bile salts adsorb reversibly onto the oil-water interface, and hence, they are fully desorbed upon subphase exchange with sSIF, as indicated by the increase in the interfacial tension to reach the value of the bare oil-water interface8,13. Conversely, lipase adsorbs irreversibly, as given by the constant value of interfacial tension after subphase exchange by sSIF. The mixture lipase and bile salts provides an intermediate desorption profile quantified by a limited increase in interfacial tension upon subphase exchange by sSIF to an intermediate value. The remaining interfacial layer contains lipase and free fatty acids. The bile salts possibly desorbed from the interface and solubilized some of the free fatty acids formed in the lipolysis. Figure 6B shows the evolution of the interfacial tension upon lipolysis of two variants of Pluronic: F127 and F6819. Figure 6B shows a steep decrease in interfacial tension due to the adsorption of lipase and bile salts and the production of free fatty acids onto previously formed interfacial films of F68 and F127 at the oil-water interface. The desorption step shows the increased interfacial tension caused by subphase exchange with sSIF, which quantifies the solubilization of lipolytic products.
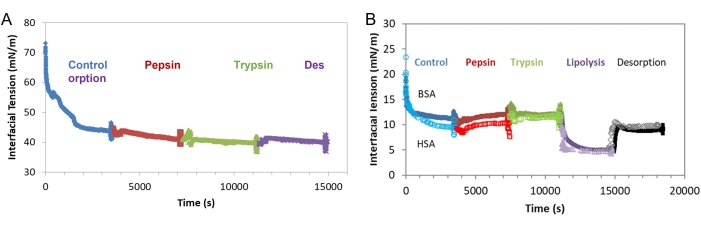
Figure 7: Example of complete dynamic gastrointestinal digestion profiles. (A) In vitro digestion profile of AS-48 adsorbed film at the air-water interface. Digestive media are applied by subphase exchange with solutions detailed in the experimental section at T = 37 °C. Control: initial buffer with AS-48, pepsin: sSGF with pepsin, trypsin: sSIF with trypsin + chymotrypsin, desorption: sSIF. Reprinted with permission from del Castillo-Santaella et al.18. (B) In vitro digestion profile of human and bovine serum albumin adsorbed films at the olive oil-water interface. Digestive media are applied by subphase exchange with solutions detailed in the experimental section at T = 37 °C. Control: initial buffer with HSA/BSA, pepsin: sSGF with pepsin, trypsin: sSIF with trypsin + chymotrypsin, lipolysis: sSIF with lipase and bile salts, desorption: sSIF. Plotted curves are representative experiments with deviations <5%. Please click here to view a larger version of this figure.
Figure 7 shows examples of complete simulated digestion profiles. Figure 7A shows the digestion profile of food bio-preservative AS-48 adsorbed at the air-water interface18. The digestive process was designed to focus on the proteolysis of this peptide, while the lipolysis of oil was not needed, being at the air-water interface. Hence, the simulated digestion in Figure 7A comprises five steps: control/initial film, pepsinolysis, trypsinolysis, and desorption. The experimental results showed that this bacteriocin is resistant to both pepsin and trypsin hydrolysis as the surface tension remained unchanged. Accordingly, AS-48 was considered a good food bio-preservative resistant to in vitro digestion. Figure 7B compares the in vitro digestion profiles of adsorbed layers of human and bovine serum albumins adsorbed at the oil-water interface22. This simulation was designed to mimic the digestibility of emulsions stabilized by these two proteins23 and evaluate the encapsulation of curcumin4. Hence, the simulated digestion was customized comprising five steps: control/initial, pepsinolysis, trypsinolysis, lipolysis, and desorption. The experimental results showed increased interfacial tension after pepsin digestion, indicating increased susceptibility to pepsinolysis. This was attributed to increased unfolding of the bovine variant upon adsorption, exposing pepsin-susceptible sites. Then, trypsinolysis and lipolysis provided completely similar digestion profiles (Figure 7B).
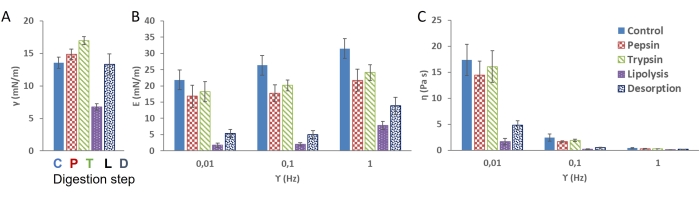
Figure 8: Example of final values of gastrointestinal digestion. (A) Interfacial tension, (B) dilatational elasticity, (C) dilatational viscosity of in vitro digestion of β-lactoglobulin adsorbed film at the olive oil-water interface. The dilatational parameters were measured at 1 Hz, 0.1 Hz, and 0.01 Hz after the digested interface was equilibrated in each step. Digestive media are applied by subphase exchange with solutions detailed in the experimental section at T = 37 °C. Control: initial buffer with protein, pepsin: sSGF with pepsin, trypsin: sSIF with trypsin + chymotrypsin, lipolysis: sSIF with lipase and bile salts, desorption: sSIF. Please click here to view a larger version of this figure.
In general, in order to evaluate and compare the nature of different digested interfacial layers, the final interfacial tension and the dilatational elasticity/viscosity obtained for digested interfaces are plotted for each of the steps considered in the digestion process designed. Figure 8 shows the interfacial tension (Figure 8A), the dilatational elasticity (Figure 8B), and the dilatational viscosity (Figure 8C), measured at frequencies of 1 Hz, 0.1 Hz, and 0.01 Hz. The values plotted were obtained after each digestive step of β-lactoglobulin adsorbed at the oil-water interface16. Figure 8A shows that proteolysis (pepsin and trypsin) produces small increases in the interfacial tension, while lipolysis reduces this value, and desorption increases again. Regarding dilatational elasticity, the protein forms elastic and interconnected films at the oil-water interface. The presence of bile salts produces highly mobile and fluid interfacial films with low elasticity. Finally, the remaining lipolytic products cannot develop a cohesive elastic film after desorption. The dilatational elasticity increases slightly with the oscillation frequency (Figure 8B). Finally, the dilatational viscosity of the interfacial films shown in Figure 8C is only detectable at the lower frequency and detects the existence of multilayers, aggregates, or other dissipative structures at the interface. Comparing the digestion profile of β-lactoglobulin with the digestion profile obtained for pulse-treated β-lactoglobulin showed improved digestibility of proteins subjected to this type of physical treatment16.
| Initial Buffer | 0.00113 mol L-1 NaH2PO4, pH 7.0 | ||
| Simplified Simulated Gastric Fluid (sSGF) | [NaH2PO4] = 0.00113 mol L-1, [NaCl] = 0.15 mol L-1, pH 3.0 | ||
| Simplified Simulated Intestinal Fluid (sSIF) | [NaH2PO4] =0.00113 mol L-1, [NaCl] = 0.15 mol L-1, [CaCl2] = 0.003 mol L-1, pH 7.0 | ||
| Gastric Enzymes | pepsin (50 ∙ 103 U L-1), gastric lipase (0.5 ∙ 103 U L-1) | ||
| Intestinal enzymes | trypsin (2.5 ∙ 103 U L-1), chymotrypsin (0.625 ∙ 103 U L-1), pancreatic lipase (50∙ 103 U L-1), co-lipase (150 ∙ 103 U L-1) | ||
| Bile salts mixture | 0.01 mol L-1 M. Bile salts mixture: Sodium Taurocholate and Sodium Deoxycholate (50/50) or Sodium Taurocholate and sodium Glycodeoxycholate (50/50) | ||
Table 1: Composition of the artificial digestive media.
Supplementary Figure 1: Basic operations of the computer interface DINATEN. (A) General appearance of the computer interface DINATEN; the left dialog shows the two syringes connected to all valves and controls the injection/extraction and cleaning. The central dialog contains the command, the drop image, and the table with results. (B) The real-time calculation provides automatic measurement as a function of time. (C) Left command to include the differential density. (D) A simple dynamic process controls the injection/extraction volume, rate, and capture times. Please click here to download this File.
Supplementary Figure 2: The interface for programming each digestive step (process). (A) Drop formation with a left syringe of fixed volume and fixed injection rate. (B) Adsorption at constant interfacial area: control. (C) Rheology with a fixed amplitude, period, and number of cycles. (D) Subphase exchange: inject and extract with both syringes at the same rate. Please click here to download this File.
Supplementary Figure 3: Calculation of the dilatational parameters with the software for image analysis CONTACTO. (A) Analysis of the images corresponding to the oscillation at a fixed period. (B) Calculation of the dilatational parameters of the interfacial layer of the selected images. (C) Dialog showing the results from the dilatational analysis. Please click here to download this File.
Discussion
This article describes a generalized protocol to measure in vitro digestion of interfacial layers by using pendant drop equipment. The protocol can be adjusted to the specific requirements of the experiment by tuning the composition of the digestive buffers, which are based on the INFOGEST11,20 harmonized protocol to facilitate comparison with literature. The digestive enzymes and biosurfactants can be added individually, sequentially, or together. This latter option needs to be conducted with care as the saturation of the interfacial layer would hinder the different phenomena by just providing a very low interfacial tension and could cause the droplet to fall. In order to be able to analyze the effect of each digestive component, the different digestive enzymes are added sequentially and in different concentrations. In this way, the effects of each component can be analyzed and systematized, and the synergies are evaluated by sequential addition. Also, to prevent droplets from falling, some concentrations are diluted9. The obtained results cannot be directly extrapolated to emulsified systems as the conditions are adjusted to account for a simplified system. However, the evolution of the interfacial tension shows the evolution of the interfacial coverage as the interfacial layer is digested10. Similarly, the evolution of the dilatational rheology provides some information on the mechanical properties of the interface as the digestion proceeds9. These results contain useful information that can be adapted and carefully interpreted to be applied to emulsified systems.
The pendant drop equipment allows the evaluation of in situ events occurring specifically at the interfacial layer, as depicted in Figure 2. First, an initial interfacial layer is formed, representing one single emulsion droplet. This initial layer is subjected to different digestive conditions and changes its composition sequentially due to the presence of the different components in the aqueous phase. Also, lipases must overcome this interfacial layer to access the oil phase and hydrolyze the fat. These interfacial events must be evaluated at the same interfacial layer initially created. Subjecting an emulsion to in vitro digestion would allow sampling at different times and the evaluation of the changes in the emulsion as it is digested (droplet size, zeta potential), but it would not allow in situ evaluation of the interfacial layer surrounding each emulsion droplet. Hence, the pendant drop equipment implemented with multi-subphase exchange comprises a complementary technique to focus on the interfacial engineering of emulsions14.
The first limitation of this methodology is precisely related to the saturation of the interfacial layer with assorted products, which need to be diluted to prevent the falling of the droplet. Another experimental issue is the degasification of all the artificial media in order to avoid the nucleation of bubbles, which could also cause droplet detachment from the capillary. It is also important to consider the larger oil-water ratio as compared to emulsion systems when extrapolating to emulsified systems. Finally, although the dilatational rheology contains information on the inter- and intramolecular associations within the interfacial layer, formed and disrupted by digestive enzymes, it is difficult to interpret and extrapolate to emulsion stability. In all, the pendant drop implemented with a multi-subphase exchange device is a useful piece of equipment to complement in vitro digestion studies of emulsions12, that follow the evolution of droplet size distribution and the zeta potential of protein digestion with electrophoresis22. Modifications of the digestive tract to account for gender variation, infant digestion, or digestive issues comprise future applications of the experimental procedure.
Disclosures
The authors declare that they have no known competing financial interests or personal relationships that could have influenced the work reported in this paper.
Acknowledgements
This research was funded by projects RTI2018-101309-B-C21 and PID2020-631-116615RAI00, funded by MCIN/AEI/10.13039/501100011033 and by "ERDF A way of making Europe". This work was (partially) supported by the Biocolloid and Fluid Physics Group (ref. PAI-FQM115) of the University of Granada (Spain).
Materials
| Name | Company | Catalog Number | Comments |
|---|---|---|---|
| Alpha-chymotrypsin from bovine pancreas | Sigma-Aldrich | C4129 | Enzyme |
| Beta-lactoglobulin | Sigma-Aldrich | L0130 | Emulsfier |
| Bovine Serum Albumin | Sigma-Aldrich | 9048-46-8 | Emulsfier |
| CaCl2 | Sigma-Aldrich | 10043-52-4 | Electrolyte |
| Centrifuge | Kronton instruments | Centrikon T-124 | For separating oil and resins |
| Citrus pectin | Sigma-Aldrich | P9135 | Emulsfier |
| co-lipase FROM PORCINE PANCREAS | Sigma | C3028 | Enzyme |
| CONTACTO | University of Granada (UGR) | https://core.ugr.es/dinaten/, last access: 07/18/2022 | |
| DINATEN | University of Granada (UGR) | https://core.ugr.es/dinaten/, last access: 07/18/2022 | |
| Gastric lipase | Lipolytech | RGE15-1G | Enzyme |
| Human Serum Albumin | Sigma-Aldrich | 70024-90-7 | Emulsifier |
| INFOGEST | http://www.proteomics.ch/IVD/ | ||
| Lipase from porcine pancreas, type II | Sigma-Aldrich | L33126 | Enzyme |
| Magnesium metasilicate resins | Fluka | 1343-88-0 | Resins to purify oil |
| Micro 90 | International products | M-9051-04 | Cleaner |
| NaCl | Sigma | 7647-14-5 | Electrolyte |
| NaH2PO4 | Scharlau | 10049-21-5 | To prepare buffer |
| OCTOPUS | Producciones Científicas y Técnicas S.L. (Gójar, Spain) | Pendandt Drop Equipment implemented with multi subphase exchange | |
| Olive oil | Sigma-Aldrich | 1514 | oil |
| Pancreatic from porcine pancreas | Sigma | P7545-25 g | Enzyme |
| Pepsin | Sigma-Aldrich | P6887 | Enzyme |
| Pluronic F127 | Sigma | P2443 | Emulsifier |
| Pluronic F68 | Sigma | P1300 | Emulsfier |
| Sodium deoxycholate | Sigma | Bile salts | |
| Sodium glycodeoxycholate | Sigma | C9910 | Bile salts |
| Sodium taurocholate | Sigma | 86339 | Bile salts |
| Syringe Filter | Millex-DP | SLGP033R | Syringe Filter 0.22 µm pore size polyethersulfone |
| Trypsin | Sigma-Aldrich | T1426 | Enzyme |
References
- McClements, D. J. The biophysics of digestion: Lipids. Current Opinion in Food Science. 21, 1-6 (2018).
- McClements, D. J., Li, Y. Structured emulsion-based delivery systems: Controlling the digestion and release of lipophilic food components. Advances in Colloid and Interface Science. 159 (2), 213-228 (2010).
- Corstens, M. N., et al. Food-grade micro-encapsulation systems that may induce satiety via delayed lipolysis: A review. Critical Reviews in Food Science and Nutrition. 57 (10), 2218-2244 (2017).
- Aguilera-Garrido, A., del Castillo-Santaella, T., Galisteo-González, F., Gálvez-Ruiz, M. J., Maldonado-Valderrama, J. Investigating the role of hyaluronic acid in improving curcumin bioaccessibility from nanoemulsions. Food Chemistry. 351, 129301(2021).
- Rodríguez Patino, J. M., Carrera Sánchez, C., Rodríguez Niño, M. R. Implications of interfacial characteristics of food foaming agents in foam formulations. Advances in Colloid and Interface Science. 140 (2), 95-113 (2008).
- Wilde, P. J., Chu, B. S. Interfacial & colloidal aspects of lipid digestion. Advances in Colloid and Interface Science. 165 (1), 14-22 (2011).
- Cabrerizo-Vílchez, M. A., Wege, H. A., Holgado-Terriza, J. A., Neumann, A. W. Axisymmetric drop shape analysis as penetration Langmuir balance. Review of Scientific Instruments. 70 (5), 2438-2444 (1999).
- Maldonado-Valderrama, J., Muros-Cobos, J. L., Holgado-Terriza, J. A., Cabrerizo-Vílchez, M. A. Bile salts at the air-water interface: Adsorption and desorption. Colloids and surfaces B: Biointerfaces. 120, 176-183 (2014).
- Maldonado-Valderrama, J., Terriza, J. A. H., Torcello-Gómez, A., Cabrerizo-Vílchez, M. A. In vitro digestion of interfacial protein structures. Soft Matter. 9, 1043-1053 (2013).
- Maldonado-Valderrama, J. Probing in vitro digestion at oil-water interfaces. Current Opinion in Colloid and Interface Science. 39, 51-60 (2019).
- Brodkorb, A., et al. INFOGEST static in vitro simulation of gastrointestinal food digestion. Nature Protocols. 14 (4), 991-1014 (2019).
- del Castillo-Santaella, T., Maldonado-Valderrama, J., Molina-Bolivar, J. A., Galisteo-Gonzalez, F. Effect of cross-linker glutaraldehyde on gastric digestion of emulsified albumin. Colloids and Surfaces B: Biointerfaces. 145, 899-905 (2016).
- Macierzanka, A., Torcello-Gómez, A., Jungnickel, C., Maldonado-Valderrama, J. Bile salts in digestion and transport of lipids. Advances in Colloid and Interface Science. 274, 102045(2019).
- Maldonado-Valderrama, J., Torcello-Gómez, A., del Castillo-Santaella, T., Holgado-Terriza, J. A., Cabrerizo-Vílchez, M. A. Subphase exchange experiments with the pendant drop technique. Advances in Colloid and Interface Science. 222, 488-501 (2015).
- Bellesi, F. A., Ruiz-Henestrosa, V. M. P., Maldonado-Valderrama, J., Del Castillo Santaella, T., Pilosof, A. M. R. Comparative interfacial in vitro digestion of protein and polysaccharide oil/water films. Colloids and Surfaces B: Biointerfaces. 161, 547-554 (2018).
- Del Castillo-Santaella, T., Sanmartín, E., Cabrerizo-Vílchez, M. A., Arboleya, J. C., Maldonado-Valderrama, J. Improved digestibility of β-lactoglobulin by pulsed light processing: A dilatational and shear study. Soft Matter. 10 (48), 9702-9714 (2014).
- Infantes-Garcia, M. R., et al. In vitro gastric lipid digestion of emulsions with mixed emulsifiers: Correlation between lipolysis kinetics and interfacial characteristics. Food Hydrocolloids. 128, 107576(2022).
- del Castillo-Santaella, T., Cebrián, R., Maqueda, M., Gálvez-Ruiz, M. J., Maldonado-Valderrama, J. Assessing in vitro digestibility of food biopreservative AS-48. Food Chemistry. 246, 249-257 (2018).
- Torcello-Gómez, A., Maldonado-Valderrama, J., Jódar-Reyes, A. B., Cabrerizo-Vílchez, M. A., Martín-Rodríguez, A. Pluronic-covered oil-water interfaces under simulated duodenal conditions. Food Hydrocolloids. 34, 54-61 (2014).
- Minekus, M., et al. A standardised static in vitro digestion method suitable for food - an international consensus. Food & Function. 5 (6), 1113-1124 (2014).
- Wege, H. A., Holgado-Terriza, J. A., Cabrerizo-Vílchez, M. A. Development of a constant surface pressure penetration langmuir balance based on axisymmetric drop shape analysis. Journal of Colloid and Interface Science. 249 (2), 263-273 (2002).
- del Castillo-Santaella, T., et al. Hyaluronic acid and human/bovine serum albumin shelled nanocapsules: Interaction with mucins and in vitro digestibility of interfacial films. Food Chemistry. 383, 132330(2022).
- Aguilera-Garrido, A., et al. Applications of serum albumins in delivery systems: Differences in interfacial behaviour and interacting abilities with polysaccharides. Advances in Colloid and Interface Science. 290 (5), 102365(2021).
Reprints and Permissions
