This protocol provides methods for generating 3D engineered cardiac and skeletal muscle tissues and describes their use in preclinical drug screening modalities. The described methods utilize a magnetic sensing system to facilitate the simultaneous assessment of 24 tissues in parallel.
Method Article
Preclinical Drug Testing in Scalable 3D Engineered Muscle Tissues
* These authors contributed equally
In This Article
Summary
Abstract
Accurately modeling healthy and disease conditions in vitro is vital for the development of new treatment strategies and therapeutics. For cardiac and skeletal muscle diseases, contractile force and kinetics constitute key metrics for assessing muscle function. New and improved methods for generating engineered muscle tissues (EMTs) from induced pluripotent stem cells have made in vitro disease modeling more reliable for contractile tissues; however, reproducibly fabricating tissues from suspended cell cultures and measuring their contractility is challenging. Such techniques are often plagued with high failure rates and require complex instrumentation and customized data analysis routines. A new platform and device that utilizes 3D EMTs in conjunction with a label-free, highly-parallel, and automation-friendly contractility assay circumvent many of these obstacles. The platform enables facile and reproducible fabrication of 3D EMTs using virtually any cell source. Tissue contractility is then measured via an instrument that simultaneously measures 24 tissues without the need for complex software analysis routines. The instrument can reliably measure micronewton changes in force, allowing for dose-dependent compound screening to measure the effect of a drug or therapeutic on contractile output. Engineered tissues made with this device are fully functional, generating twitch and tetanic contractions upon electrical stimulation, and can be analyzed longitudinally in culture over weeks or months. Here, we show data from cardiac muscle EMTs under acute and chronic dosing with known toxicants, including a drug (BMS-986094) that was pulled from clinical trials after patient fatalities due to unanticipated cardiotoxicity. Altered skeletal muscle function in engineered tissues in response to treatment with a myosin inhibitor is also presented. This platform enables the researcher to integrate complex, information-rich bioengineered model systems into their drug discovery workflow with minimal additional training or skills required.
Introduction
Induced pluripotent stem cell (iPSC) models are increasingly becoming key players in the preclinical pipeline for therapeutic discovery and development, as well as basic biological research and disease modeling1,2,3,4,5. Contractile tissues, such as cardiac and skeletal muscle derived from iPSCs hold great potential for improving the predictive power of human in vitro studies as direct assessment of muscle contractile force and kinetics are quantitative metrics to study overall tissue function4,6,7,8. Typically, measurements of contractile force have been obtained either indirectly by optical tracking of substrate deflection9,10 or directly by attachment of cells/tissues to a force transducer4,11,12. These methods, while accurate, are inherently low-throughput and typically require highly skilled operators to collect and analyze data.
Previous work has shown that magnetic field sensing circumvents these obstacles and provides an alternate method to assess engineered muscle function simultaneously across multiple tissue constructs13. The Mantarray (Magnetometric Analyzer for eNgineered Tissue ARRAY) 3D Contractility Platform builds on this technology using a device capable of measuring the contractility of engineered muscle tissues in a highly-parallel manner that leverages the complexity of 3D cellular models with higher-throughput screening14. The platform enables label-free, quantitative, real-time monitoring of contractile function in cardiac and skeletal muscle tissues in or outside of a standard cell-culture incubator, eliminating the need for optical-based contractile imaging and analysis. This technology facilitates direct comparison of healthy and diseased cell lines and enables measurement of a drug's effect on contractile tissues, establishing quantifiable, in vitro, safety, and efficacy data for new and existing therapeutic compounds.
Engineered 3D muscle tissues can be fabricated between two posts in a highly reproducible manner using the Mantarray consumable, 24-well casting plate (Figure 1). One post is rigid, while the other post is flexible and contains a small magnet. When the tissue construct contracts, it displaces the flexible post and the embedded magnet. The EMT plate is positioned within the instrument, and post displacement is measured via an array of magnetic sensors on a circuit board below the plate holder. The measured changes in the magnetic field are converted into absolute contractile force using a mathematical algorithm. The instrument employs rapid data sampling rates to enable the collection of detailed information about the functional capacity and maturity of the cell type(s) being assayed, including contraction frequency, velocity, and decay time. These functional measurements can be obtained across all 24 wells simultaneously with the magnetic sensing platform or individually and sequentially using traditional optical methods.
This study describes a highly reproducible method for engineering 3D skeletal muscle and cardiac microtissues in a fibrin-based hydrogel. During a brief, 80-min reaction, thrombin catalyzes the conversion of fibrinogen into fibrin, providing a scaffold for muscle cells to develop in suspended culture15. Stromal cells help remodel the matrix and tissues become contractile as muscle cells form a syncytium within the hydrogel. The contractility of these tissues was analyzed using the magnetic sensing approach, both before and after compound exposure, validating this modality for use in dose-response drug studies. Primary human myoblasts from a healthy donor biopsy were obtained commercially and cultured in 2D according to the vendor's protocols. Cells were expanded using a skeletal muscle growth medium through three passages to generate sufficient cell numbers to fabricate 3D tissues. Stromal cells and hiPSC-derived cardiomyocytes were cultured according to the vendor's protocol for 3 days to allow recovery from cryopreservation before casting cells into tissues. Representative results are provided illustrating the types of data sets that can be collected using the magnetic sensing platform. Common pitfalls associated with the generation of engineered tissues using these methods are also addressed.
Protocol
1. Cell culture protocol
- Primary human myoblast culture
- Dilute the extracellular matrix (ECM) at a ratio of 1:100 in 8 mL of DMEM/F12 medium on ice.
- Apply 8 mL of ECM solution to one T175 flask and incubate at 37 °C for at least 1 h prior to cell seeding, but no more than 24 h. Ensure the ECM solution covers the entire flask bottom.
- Aliquot 5 mL of the skeletal muscle growth medium to a 15 mL conical tube.
- Thaw a frozen vial of cells (5.0 x 10⁵ myoblasts) in a water bath at 37 °C for 2 min or until the ice is just melted. Spray the vial with 70% ethanol and transfer it to a biosafety cabinet (BSC).
- Transfer the cells into the aliquoted medium using a P1000. Do not triturate. Centrifuge the cells at 300 x g for 3 min.
- Aspirate the supernatant and resuspend the cells in 1 mL of the growth medium using a P1000 pipette to attain a single cell suspension.
- Wash the ECM-coated flask with 15 mL of DPBS. Aspirate DPBS, and then add 30 mL of the growth medium to the flask.
- Add 4 mL of the growth medium to the cells, mix, and distribute the cell suspension into the T-175 flask. Ensure that the total volume is 35 mL. Slide the flask gently along the work surface to the left and right 5-6 times followed by forward and back 5-6 times to ensure even distribution of cells on the flask surface.
- Place the T-175 flask into a cell culture incubator at 37 °C and 5% CO2. Culture the cells for 3 days or until they reach no more than 70% confluency, and then passage the cells.
- Passaging primary human myoblasts
- Dilute the ECM at a ratio of 1:100 in 30 mL of DMEM/F12 medium on ice.
- Apply 10 mL of the ECM solution to three T225 flasks and incubate at 37 °C for at least 1 h prior to cell seeding, but no more than 24 h. Ensure that the ECM solution covers the entire flask bottom.
- Wash the cells with 15 mL of DPBS. Aspirate and add the dissociation reagent according to the vendor's protocol.
- Once the cells are lifted, stop the reaction according to the vendor's protocol and collect the cells into a conical tube. Centrifuge the cells at 300 x g for 3 min.
- Aspirate the supernatant and resuspend the cells in 1 mL of the growth medium using a P1000 pipette to attain a single cell suspension.
- Wash the ECM coated flask with 15 mL of DPBS. Aspirate DPBS, and then add 40 mL of the growth medium to each T225 flask.
- Add 14 mL of the growth medium to the cell suspension, mix, and distribute 5 mL of the cell suspension to each T225 flask. Ensure that the total volume in each flask is 45 mL. Slide the flask gently along the work surface to the left and right 5-6 times followed by forward and back 5-6 times to ensure even distribution.
- Place the flasks into the cell culture incubator at 37 °C and 5% CO2.
- Culture cells for 2-3 days or until they reach no more than 70% confluency, and then passage. Split the cells at 1:3 or 1:4 at each passage and seed between 3 x 10³ and 1 x 10⁴ cells/cm2.
- hiPSC-derived cardiomyocyte culture
- Dilute the ECM at a ratio of 1:60 in 12 mL of DMEM/F12 medium on ice.
- Apply 1 mL of the ECM solution to each well of two 6-well plates and incubate at 37 °C for at least 1 h prior to cell seeding, but no more than 24 h.
- Thaw a frozen vial of cardiomyocytes in a water bath at 37 °C for 2 min or until the ice is just melted.
- Spray the vial with 70% ethanol and transfer it to the BSC.
- Use a p1000 pipette to transfer the thawed cells into a 50 mL conical tube.
- Rinse the empty cryovial with 1 mL of room temperature (RT) plating medium to recover any remaining cells.
- Slowly dispense the 1 mL of rinse media dropwise (one drop every 5 s) into the conical tube of cells over the course of 90 s. Continuously swirl the tube to mix the cells during the slow media addition.
- Slowly add 8 mL of the plating medium using a 10 mL serological pipette to the 50 mL conical tube of cells.
- After all the media is dispensed, gently pipette up and down 3 times to mix the cells thoroughly. Count cells using a hemacytometer and trypan blue.
- Centrifuge the cells in the 50 mL conical tube at 300 x g for 3 min.
- After the cells have been pelleted, aspirate the supernatant.
- Use a p1000 pipette to transfer 1 mL of the plating medium to the tube and gently break up the pellet by slowly pipetting up and down 3-5 times. Resuspend the cells with an additional plating medium.
- Seed between 2-4 x 10⁶ cells per well of a 6 well plate in 2 mL of the plating medium.
- Wash the ECM-coated 6-well plates with DPBS (2 mL/well).
- Pipette 2 mL of cell suspension per well of a 6 well plate. Move the plates gently along the work surface to the left and right 5-6 times followed by forward and back 5-6 times to ensure even distribution of cells on the plate surfaces.
- Place the plate into the cell culture incubator at 37 °C and 5% CO2.
- Repeat steps 1.3.3-1.3.16 for all vials of the cells to be thawed.
- Change to 3-5 mL (depending on cell line and density) of maintenance medium the next day after plating, and then change the medium every other day. Culture cells for 3-4 days before casting into 3D tissues.
- Stromal cell culture
- Apply 30 mL of the ECM solution to a T175 flask and incubate at 37 °C for at least 1 h prior to cell seeding, but no more than 24 h.
- Aliquot 5 mL of the stromal cell medium into a 15 mL conical tube.
- Thaw a frozen vial of stromal cells in a water bath at 37 °C for 2 min or until the ice has just melted.
- Spray the vial with 70% ethanol and transfer it to the BSC.
- Use a p1000 pipette to slowly add 1 mL of the stromal cell medium to the thawed cells in the vial.
- Transfer the cell suspension from the vial to the remaining thaw media in the conical tube. Use a 5 mL serological pipette to mix the cells. Pipette up and down 3 times.
- Count the cells using a hemacytometer and trypan blue. Do not spin down cells.
- Wash the ECM-coated T175 flask with 15 mL of DPBS.
- Transfer the stromal cells to the flask at a density of 3-4 x 10³ cells/cm2. Slide the flask gently along the work surface to the left and right 5-6 times followed by forward and back 5-6 times to ensure even distribution of cells on the flask surface.
- Change media the next day with 45 mL of warmed stromal cell medium. Culture the cells for 3-4 days before casting into 3D tissues.
2. Material preparation
- Fibrinogen
NOTE: When reconstituting fibrinogen, take care to maximize the amount of surface area the fibrinogen powder is being layered on. In this protocol, the amount of diluent used was optimized to the size of the container being used, i.e., just enough diluent was used to cover the bottom of the dish. For example, layer 0.5 g of fibrinogen over 10 mL of PBS in a 100 mm dish rather than a 50 mL centrifuge tube. Maximizing the amount of surface area of the diluent will reduce the amount of time needed to reconstitute the fibrinogen and reduce potential clumping of protein.- Reconstitution
- Transfer 10 mL of PBS to a 100 mm cell culture dish and warm to 37 °C in a cell culture incubator.
- Layer 0.5 g of fibrinogen powder over the entire surface of warm PBS and keep at 37 °C until fibrinogen has fully dissolved. This should take no more than 2 h. The dissolving powder may be gently swirled, but do not vigorously shake the dish.
- Sterile filtration
- Once the powder has fully dissolved, run the solution through a 100 µm filter and collect it into a 50 mL conical tube to remove any clumps of gelled fibrinogen.
- Pour the filtered solution into a 10 mL syringe capped with a 0.2 µm filter. Push the solution through the filter and collect it into a new 50 mL conical tube. The filter may need to be changed more than once to sterilize all 10 mL of solution.
- Aliquot 300 mL of sterile fibrinogen into 1.5 mL microcentrifuge tubes and store at -20 °C. Thaw the aliquots on ice or at 4 °C as needed. Avoid repeated freeze/thaws.
- Reconstitution
- Thrombin
- Add 6 mL of PBS and 4 mL of diH2O directly into one vial of thrombin (1 KU) to make a 100 U/mL thrombin stock solution.
- Filter sterilize with a 0.2 µm filter, aliquot, and store at -20 °C in 1.5 mL plastic microcentrifuge tubes as thrombin adsorbs to glass. Avoid repeated freeze/thaws.
- Poly(ethyleneimine) solution (PEI)
CAUTION: PEI is toxic. Use appropriate PPE as designated by the manufacturer.
NOTE: PEI is supplied as a 50% w/v solution. It is highly viscous and difficult to pipette. Make a 0.1% solution from a 10% stock solution rather than directly from the 50% w/v solution.- Measure 5 mL of 50% w/v PEI solution in a 50 mL conical tube.
- Add 20 mL of diH2O and mix to yield a 10% stock solution. This highly concentrated stock solution cannot be sterile filtered.
- To make a 0.1% solution for cell culture, add 5 mL of 10% stock to 495 mL diH2O. Sterile filter using a 500 mL filter flask and store at RT for no longer than 1 week.
- Glutaraldehyde
CAUTION: Glutaraldehyde is toxic. Use appropriate PPE as designated by the manufacturer.- Glutaraldehyde is supplied as a 25% solution. To make a 0.01% solution, add 40 µL to 99.6 mL of diH2O. Sterile filter and store at 4 °C for no longer than 1 week.
- Post preparation
- Place consumable tissue casting kit inside a sterile culture hood. The casting kit contains a lid, a post lattice holding 24 pairs of posts (one pair of posts per well of a 24-well plate), and a specialized 24-well plate bottom containing 24 casting wells. Each casting well contains a trench in the bottom of the well to hold the cell/hydrogel components and mold them into a tube-shaped tissue as the hydrogel polymerizes (Figure 1B).
- Fill the wells of a 24-well plate with 1.5 mL/well of a 0.1% PEI solution and place posts in plate so that the tips of each pair of posts are submerged. Let it sit for 10 min. PEI will deposit a positive charge on the posts so that proteins in the hydrogel firmly attach to the posts during tissue casting.
- Fill the wells of a second 24-well plate with 2 mL/well of sterile diH2O and transfer the posts. Let it sit for 1 min.
- In a third 24-well plate, fill the wells with 1.5 mL/well of 0.01% glutaraldehyde (GA) and transfer the posts. Let it sit for 30 min. GA will fix the positive charge from PEI to the posts.
- While the posts sit in glutaraldehyde, aspirate the diH2O wells, wash with 2 mL/well of sterile diH2O, aspirate, and refill with 2 mL/well of sterile diH2O. A fresh, 24-well plate may be used instead of rinsing.
- When 30 min is up, transfer the posts to the 2 mL/well of sterile diH2O. Let it sit for 1 min.
- Aspirate the diH2O and add another 2 mL/well of sterile diH2O. Let it sit for 5 min.
- Transfer the posts to a 24-well plate to dry (approximately 15 min).
- Once dry, reassemble the casting Kit. Parafilm the edges to seal the lid and the plate together, and then store at 4 °C for up to 72 h prior to cell seeding. Longer storage times are likely possible but have not been tested.
3. Tissue casting protocol
- Casting plate preparation
- Pre-chill the tissue casting kit at 4 °C.
- Transfer a bucket of ice into the BSC. On ice, prepare 50 µL of thrombin solution (3 µL of thrombin stock + 47 µL of EMT medium) per well to be cast.
NOTE: See step 3.2.1 for details on EMT medium. - Remove the chilled casting kit from the refrigerator and place it onto a cold block or ice inside the cell culture hood. Lay casting plate flat on ice and move the post lattice from the casting plate to a new, sterile 24-well plate.
- Pipette 50 µL of thrombin solution into each pre-chilled well of the casting plate.
- Reassemble the kit and return it to the refrigerator until needed for tissue casting. Cast the tissues within 3 h of thrombin addition to the wells.
- Cell preparation
- Prepare EMT base medium, sterile filter, and leave on ice.
NOTE: If cell-specific casting medium contains FBS, use heat-inactivated FBS as it may interact with fibrinogen and cause premature polymerization.- Prepare cardiac EMT medium: Add 500 mL of RPMI medium, 10 mL of B27, and 2.5 g of aminocaproic acid. (Optional) Add 10 mM ROCK inhibitor (add only to the EMT medium used for casting tissues and not the entire 500 mL volume).
- Prepare skeletal EMT medium: Add 50 mL of F10 medium and 0.25 g of aminocaproic acid (ACA) for primary EMTs and 0.1 g of ACA for iPSC-derived EMTs.
- Warm the cell culture grade dissociation reagent to 37 °C. Warm an equal volume of EMT medium to dilute the dissociation reagent.
NOTE: It is critical that the protease used is completely inactivated. Active protease will interfere with 3D tissue formation and post adherence. - Wash the cells (Figure 1A) with PBS. Use 2 mL/well for a 6-well plate. Use 6 mL, 15 mL, and 15 mL for a 100 mm dish, T175 flask, and T225 flask, respectively.
- Add the warmed cell culture grade dissociation reagent to lift the cells and incubate at 37 °C for 5 min or until the cells have lifted. For cardiac cultures, use the 10x dissociation reagent. For stromal cells and skeletal muscle myoblasts, use a 1x dissociation reagent. Use 1 mL/well for a 6-well plate, 3 mL for a 100 mm dish, 8 mL for a T175 flask, and 10 mL for a T225 flask.
- Check the cultures every 2-3 min by tapping the side of the plate.
- Once the cells have lifted, transfer them to a 50 mL conical tube and triturate with a P1000 pipette to ensure a single-cell suspension.
- Wash the plate or flask with an additional EMT medium to collect the remaining cells and add them to the conical tube. Use 1 mL/well of the EMT medium for a 6-well plate, 2 mL for a 100 mm dish, 5 mL for a T175 flask, and 5 mL for a T225 flask.
- Triturate the cells to ensure a single cell suspension.
- Add EMT medium to terminate the dissociation process, and then take samples of the cell suspensions for cell counts. Use 1 mL/well for a 6-well plate, 3 mL for a 100 mm dish, 8 mL for a T175 flask, and 10 mL for a T225 flask.
- Spin the cells at 200 x g for 4 min. Perform cell counts using a hemacytometer and trypan blue while suspensions are centrifuged.
- Aspirate the supernatant and resuspend the cells in 5 mL of EMT base medium to remove the residual dissociation reagent.
- Centrifuge the cells at 200 x g for 4 min. Aspirate the supernatant and prepare the cell suspensions at the appropriate densities.
- Increase the longevity and function of 3D skeletal muscle EMTs with the addition of 10%-20% ECM proteins in the EMT medium14,16.
- Seed stem cell-derived cardiomyocytes and their stromal cells at 5 x 10⁵ cells and 7.5 x 10⁴ cells per tissue construct, respectively. Seed the skeletal muscle myoblasts at 7.5 x 10⁵ cells per tissue construct.
- Cardiac tissues
- Aspirate the supernatant and resuspend the stromal cells at a density of 2.5 x 10⁶ cells per mL in EMT medium and put them on ice. Use 30 µL of this suspension per EMT.
- Aspirate the supernatant and resuspend the CMs at a density of 8.3 x 10⁶ cells per mL in EMT medium and put them on ice. Use 60 µL of this suspension per EMT.
- Skeletal muscle tissues
- Aspirate the supernatant and resuspend the skeletal muscle cells at a density of 8.3 x 10⁶ cells per mL in EMT medium and put them on ice. Use 90 µL of this suspension per EMT.
- Calculate the volumes of each cell solution required to make up the desired number of tissues (e.g., 60 µL of the prepared CMs and 30 µL of the prepared stromal cells or 90 µL of the skeletal muscle cells per EMT).
- Pipette the calculated volumes of cells into a 15 mL conical tube.
- Add 10 µL of fibrinogen per EMT to the cell suspension and keep it on ice.
- Total reagents and cell volumes per EMT: Ensure that each EMT has 90 µL of cells, 10 µL of fibrinogen, and 50 µL of thrombin solution.
- Prepare EMT base medium, sterile filter, and leave on ice.
- Tissue casting
- Transfer the tissue casting kit to a cell culture hood and remove the lid (post lattice containing flexible and rigid posts should remain on the casting plate; Figure 1B). Keep the casting plate with post lattice laying flat on ice.
- Mix the cell/fibrinogen mixture and draw up 100 µL with a P200 pipette.
- Add 100 µL of the mixture to wells prepared with 50 µL of thrombin solution and triturate 5 times to mix well. Do not push the pipette past the first stop and remove the tip after trituration to avoid creating any bubbles.
- At this stage, and until the post lattice is ready to be lifted from the casting plate (step 3.3.10), any movement of the lattice may compromise the long-term attachment of the tissue to the posts. Hold both the lattice and casting well plate simultaneously using the pointer finger and thumb of one hand to avoid any movement of the lattice.
- Repeat with a fresh P200 tip for each tissue until all the tissues are cast. Mix cell suspension in a 15 mL conical tube before casting each tissue as cells settle quickly.
- Carefully transfer the seeded kit to the incubator, making sure not to move the lattice. Movement of lattice after seeding may result in decreased success in transferring tissues out of the casting wells. Incubate at 37 °C for 80 min, regardless of the cell type. This will begin the polymerization of the hydrogel and allow proteins to attach to the posts.
- Meanwhile, prepare a fresh 24-well plate with 2 mL/well of the EMT medium for cardiac tissues. 10 mM ROCK inhibitor may be added to the EMT medium if desired. Incubate the plate at 37 °C to warm the medium.
- Prepare 2 mL/well of growth medium containing 5 g/L aminocaproic acid (0.2 mm sterile filtered) for primary skeletal muscle tissues or 2 g/L ACA for iPSC-derived EMTs. Incubate the plate at 37 °C to warm the medium.
- After incubation, gently add 1 mL of the EMT medium to the edge of the casting wells and incubate for another 10 min at 37 °C, regardless of the cell type. This will dislodge the hydrogel from the edges of the casting well and permit easy transfer of the tissue.
- After 10 min, carefully lift the post lattice and transfer the tissues from the casting plate to a prepared 24-well plate with medium (Figure 1C). Return the plates with tissues to the cell culture incubator at 37 °C.
- Maintenance
- After 24 h, transfer the cast tissues to a fresh 24-well plate with 2 mL/well of the EMT media (without the ROCK inhibitor if it was included) and incubate at 37 °C. For skeletal muscle cells, switch the growth medium to the differentiation medium to promote myoblast fusion.
- Transfer the cardiac tissues to fresh wells with 2 mL/well of the EMT medium every 2-3 days.
- Transfer the skeletal muscle tissues to fresh wells with 2 mL/well differentiation medium containing 5 g/L Aminocaproic acid (0.2 mm sterile filtered) every 2-3 days. Use 2 g/L ACA for iPSC-derived tissues.
- To aid in medium changes, transfer the post lattice to a fresh 24-well plate rather than change the medium in the same plate to avoid damaging the 3D tissues. Prepare a second 24-well plate with the EMT medium and transfer the tissues to the fresh medium. Keep the plate with the old medium alongside the active culture to use for the next medium change. Transfer the post lattice back and forth between the two plates throughout the culture period. Alternatively, use a fresh plate for each medium change.
- Measure the EMT contraction either via optical tracking of post deflection (Figure 1D) or magnetic sensing hardware13,14. Cardiac tissues start beating spontaneously after 3-4 days in culture. Skeletal muscle tissues are typically contractile with electrical field stimulation after 7 days in culture.
Results
Cells were cast into engineered muscle tissues in the 2-post consumable plate (Figure 1). Successful EMTs will appear uniform, and the matrix will be evenly distributed between the posts (Figure 2A). The matrix should also wrap around both posts, producing equivalent anchor points for the tissue. Failures in casting are rare with this method and are usually obvious with a visual inspection. Unsuccessful EMT production can range from catastrophic failures, such as tissue detachment from the posts (Figure 2B) to more subtle structural flaws, such as air bubbles and loose attachment to the posts (Figure 2C,D). Tissues with minor flaws may still be viable, but the data from these tissues should be examined carefully to ensure it is comparable to uncompromised EMTs. For example, air bubbles within an EMT may be squeezed out as the tissue compacts over time, rendering a fully functional construct without contractile deficiencies. These tissues must be evaluated on a case-by-case basis, however, as the location of the air bubbles may affect functional recovery. Air bubbles generated at the posts, for instance, may affect tissue attachment, which could impede long-term adherence to the post.
Tissues begin to compact within the first 24 h as cells remodel the matrix within the hydrogel (Figure 3). Compaction is a gradual process and usually proceeds over the first 2-4 weeks of culture. Overall, tissue compaction is consistent between technical and biological replicates (Figure 4). It is normal for some cell lines to compact the matrix more than others as tissues mature over time. The percentage of myogenic cells within a construct influences the rate and overall degree of EMT compaction. Total myogenic content for both cardiac and skeletal muscle cell lines should be above 80% to minimize variation between engineered tissues. This is particularly important when comparing contractile forces and kinetics across cell lines.
Within the first few days after casting, cardiomyocytes begin to spontaneously beat in culture, rhythmically bending the flexible post with each muscle contraction. Skeletal muscle constructs contract in response to electrical stimulation by day 7 after starting differentiation. Field stimulation was applied to skeletal muscle tissues via an external stimulator attached to a custom 24-well electrode lid. The lid, fabricated with a pair of carbon electrodes for each well, sits on top of the 24-well plate of tissues, simultaneously stimulating each EMT to induce muscle contractions. Tissues were paced using a 10 V stimulus for 10 ms pulse durations at 1 Hz during functional measurements. Contractile tissues indicate skeletal myoblasts that have fused, forming myotubes complete with functional sarcomeres and contractile machinery. Skeletal EMTs stain positive for myosin heavy chain (MyHC) and dystrophin is localized to the myotube membrane revealing a classic ring shape in cross-sectional immunohistochemical analysis (Figure 5). Once EMTs are functional, contractility can be measured daily in the magnetic sensing instrument, tracking force and kinetics as the constructs develop and mature over time. Both cardiac and skeletal muscle tissues remain contractile for weeks to months in 3D culture (Figure 6), and they can be used for a wide range of contractility studies.
The magnetic detection approach can be used to simultaneously measure acute and chronic effects of structural cardiotoxicants, such as doxorubicin (Figure 7) and BMS-986094 (Figure 8), as well as other drugs that affect muscle contractility. Optical tracking methods of contraction detection can also be used, but care must be taken when studying acute drug effects as measurements must be taken sequentially. The extended longevity of cardiac and skeletal EMTs in 3D culture enables long-term drug studies in these tissues. This permits users to explore the effects of repeat dosing, as well as continued, long-term exposure to compounds that may show cardiotoxic effects over time as occurs with doxorubicin. Doxorubicin (dox) is an anti-cancer chemotherapy drug17. The amount of drug administered to patients varies, depending on the type of cancer, age of the patient, height and weight of the patient, as well as other factors. For this reason, it is important to test the effect of dox across a wide range of concentrations and delivery schedules. Here, cardiac EMTs were treated over the course of 27 days with three separate concentrations (0.1 µM, 1 µM, and 10 µM) of dox (Figure 7). The groups were stratified further by treating EMTs at each concentration with either a bolus treatment or continuous administration with a medium change every 72 h. Wells given bolus treatments of dox were exposed to the drug at three separate time points, allowing for recovery between dosing. The two highest doses of bolus and continuous exposure showed an immediate and prolonged cessation of contractile force generation throughout the study. The middle and lowest concentrations had varying effects on the tissues, depending on the administration method. In the lowest concentration of the drug, the bolus group showed no difference from the controls. However, contractile force diminished after 2 weeks of continuous exposure. The mid-range concentration of the drug had an interesting effect. While continuous dosing reduced force over the first couple of days of treatment and lasted throughout the experiment, the bolus group showed a recovery of contractile force back to control levels when the drug was washed out after 3 days. However, the second bolus of the drug caused a full cessation of force, followed by no recovery (Figure 7), indicating that repeatedly dosing at this concentration may have a cardiotoxic effect in patients treated with this drug. The broad scope of this study, in both time and experimental conditions, highlights the utility of 3D engineered tissues in toxicity screening, as they remain contractile and responsive to chemical exposure over extended periods of time, allowing for long-term drug studies within a single set of muscle tissues. This facilitates not only identifying compounds that may have a cardiotoxic effect with chronic exposure but also detecting potential cardiotoxic timing of administration.
In vitro toxicity testing in engineered human muscle tissues is one way to help keep human patients safe in clinical trials. BMS-986094 is a nucleotide polymerase (NS5B) inhibitor used to treat hepatitis C. The drug was in Phase II clinical development when Bristol-Myers Squibb discontinued development due to several cases of unexpected heart failure in patients18,19. Here, BMS-986094 was applied to cardiac EMTs to test whether 3D engineered muscle tissues would develop a cardiotoxic reaction to the drug (Figure 8). Three different concentrations of the drug were applied, and tissues were monitored over 13 days. Contractile force dropped with the addition of the drug in a dose-dependent manner (Figure 8A). Twitch frequency was also significantly affected as the beat rate slowed and eventually stopped as expected with continued exposure to the cardiotoxic compound (p < 0.05, Figure 8B). These results demonstrate how 3D-engineered human muscle tissues can be used to facilitate bringing new drugs to the market and flag compounds that eventually fail due to cardiotoxicity. Moreover, this technology could potentially save lives by exposing dangerous drugs before they are put into patients in clinical trials.
The ability to measure the effect of acute and chronically applied drugs on human contractile tissue is a vital first step when investigating therapeutics for safety and efficacy. It is important to know, however, that the concentration of drugs applied are physiologically relevant and appropriate for in vitro testing. Skeletal muscle tissues were used to establish an IC50 value for 2,3-Butanedione monoxime (BDM) in a full dose-response curve. This drug is a well-characterized ATPase inhibitor of skeletal muscle myosin-II20. BDM inhibits muscle contractions by preventing myosin cross-bridge formation with the actin filament in sarcomeres21. Results shown here reveal a dose-dependent decrease in absolute force when the drug is applied and complete recovery of contractile force when the drug is washed out, indicating the transient effect is preventing muscle contractions and not merely killing cells within the tissue (Figure 9A). Furthermore, a full dose-response curve was measured across the seven concentrations examined, establishing an IC50 of 3.2 mM in these human microtissues (Figure 9B).
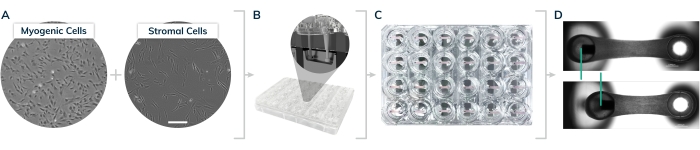
Figure 1: EMT casting in the 2-post Mantarray consumable 24-well plate. (A) Myogenic and stromal cells were cultured on 2D surfaces prior to tissue casting. (B) Cells are lifted from 2D surfaces and mixed together with extracellular matrix proteins to form hydrogels in the individual plate casting wells shown in the inset. (C) 24-well plate containing engineered tissues in every well. (D) Representative tissues showing relaxed and contracted engineered muscle, comparing displacement of the magnetic post (green bars). Please click here to view a larger version of this figure.

Figure 2: Successful and unsuccessful EMT casting. (A) Ideal engineered muscle tissue 24 h post-casting uniformly compacted around the posts with homogenous cell/matrix composition throughout the tissue. (B) Failed EMT showing detachment of the hydrogel from the flexible post. (C) EMT containing air bubbles throughout the tissue. (D) Unequal tissue deposition around both posts. Tissue is loosely anchored to the flexible post on one side. Scale bars are 1 mm. Please click here to view a larger version of this figure.

Figure 3: Compaction in engineered muscle tissue over time. (A) EMT construct shown 1 day after casting. Tissues are transferred into differentiation medium, beginning day 0 of cell fusion and hydrogel compaction. (B-E) The same EMT at day 7 through day 21 showing a slightly shorter overall length between the two posts over time and smaller width when measured through the middle section of the EMT. Scale bars are 1 mm. Please click here to view a larger version of this figure.
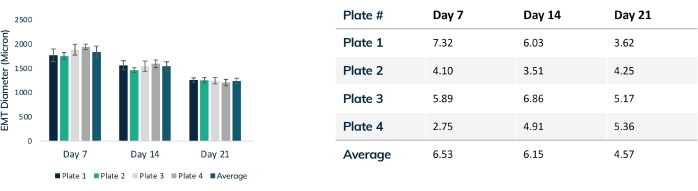
Figure 4: EMT diameter over time. Four plates of tissues were tracked over 21 days, comparing EMT diameter throughout compaction. Each tissue was measured through the mid-section every week using optical microscopy. Time points show consistent EMT size between plates. Maximal compaction is reached at day 21 as matrix remodeling is stabilized. The table shows the standard deviation (% of total) of compaction within each plate of tissues and the average deviation for all plates. Colored bars are individual plates. Error bars are SD of EMTs within plates. Please click here to view a larger version of this figure.

Figure 5: Immunohistochemistry of the engineered skeletal muscle tissues. EMTs were fixed on day 10 of culture and embedded in paraffin. Thin cross-sections (7 μm) were stained with antibodies against myosin heavy chain and dystrophin prior to imaging. Green = MyHC, red = Dystrophin, blue = DAPI. Objective magnification is 40X; scale bar is 50 µm. Please click here to view a larger version of this figure.

Figure 6: Contractile force in engineered muscle tissues over time. (A) Average absolute twitch force measured from cardiac EMTs from day 7 through day 63 in culture; n = 3 per group. (B) Average absolute twitch force in skeletal EMTs derived from a primary cell line on day 7 through day 53 in culture; n = 3. Error bars are SD for both graphs. Please click here to view a larger version of this figure.
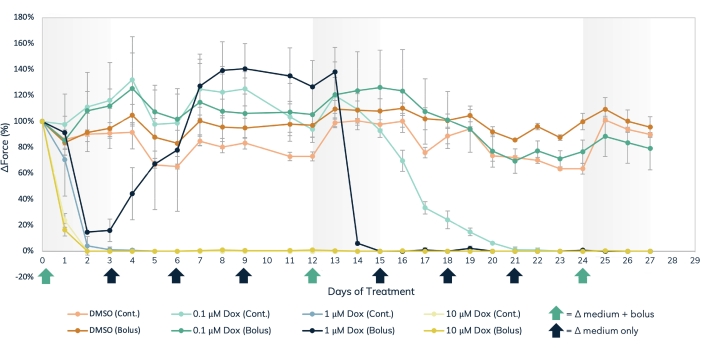
Figure 7: Acute and chronic doxorubicin treatment in the engineered muscle tissue. Three separate dose concentrations of dox, 0.1 µM, 1 µM, and 10 µM, were delivered either in bolus or administered continuously to engineered muscle tissues over the course of 27 days. Bolus doses of the drug were added at media changes on days 0, 12, and 24, noted by the green arrows on the X-axis. The drug was added to the media at every media change for continuous dosing, noted by the black and green arrows on the X-axis. The percent change in force from baseline values (pre-drug treatment) is on the Y-axis, and the time in days of treatment is on the X-axis. Light orange = DMSO continuous control, dark orange = DMSO bolus control, light green = 0.1 µM dox continuous, dark green = 0.1 µM dox bolus, light blue = 1 µM dox continuous, dark blue = 1 µM Dox bolus, light yellow = 10 µM dox continuous, dark yellow = 10 µM dox bolus. Error bars are SD; n = 3 per condition. Please click here to view a larger version of this figure.
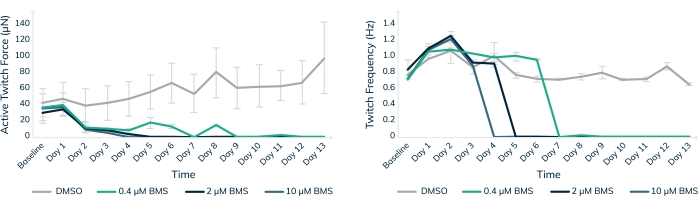
Figure 8: Chronic treatment with BMS-986094 in engineered muscle tissue. EMTs were treated with 0.4 µM (green), 2 µM (dark blue), and 10 µM (light blue) BMS-986094 over 13 days. (A) Contractile twitch force (Y-axis) decreases at all drug concentrations in the first 2 days, whereas the control tissues in DMSO continue to get stronger over time (X-axis). (B) The cardiac beat rate, or twitch frequency, ceases in a dose-dependent like manner in tandem with a cessation of contractile force shown in graph A. Control tissues in DMSO (gray) maintain a regular beat rate throughout the experiment. Error bars are SD; n = 3 per condition. Please click here to view a larger version of this figure.
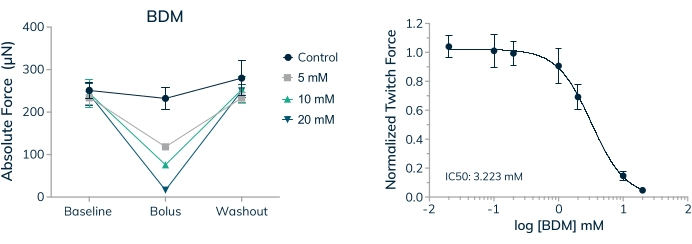
Figure 9: Dose-response to BDM in engineered skeletal muscle tissues. (A) Absolute twitch force decreases in a dose-dependent manner when primary cell-derived EMTs are exposed to 2,3-Butanedione monoxime (BDM) on day 16 in 3D culture. Absolute twitch force returns to near baseline values when the drug is washed out. (B) Absolute twitch force normalized to baseline values decreases in a dose-dependent manner when exposed to BDM yielding a full dose-response curve and IC50 value; n = 4 per dose. Error bars are SD. Please click here to view a larger version of this figure.
Discussion
This study describes methods for generating 3D engineered cardiac and skeletal muscle tissues within a 24-well consumable casting kit. By following these methods, it is possible to consistently achieve a complete array of 24 tissues with no casting failures for subsequent drug screening. Critical considerations for achieving such an outcome are ensuring that during casting all the steps are performed on ice to prevent premature polymerization of the hydrogels, removal of cell dissociation reagent prior to tissue casting, thorough mixing of the cell and hydrogel suspension for each tissue, replacement of pipette tips between tissues, and the use of heat-inactivated FBS (if used at all). Also, it is important to ensure that the post lattice is not moved once casting starts and is transferred gently once hydrogels have formed.
Major modifications include the use of different cell types to achieve cardiac versus skeletal EMTs and the doping of hydrogels with variable concentrations of basement membrane proteins to promote cellular maturation and tissue stability. The beneficial effects of such doping must be tested on a case-by-case basis, but has been shown to improve functional outcomes and tissue longevity under certain circumstances14,16,22. It is also noteworthy that the cell densities listed are a guide and may need to be optimized for different cell lines. Alternative hydrogel compositions could also be considered as a means to modify the structural and functional properties of the achieved EMTs23,24,25. The native muscle microenvironment also contains supporting cell types to promote vascularization, innervation, and matrix deposition to support myocytes in form and function26,27. While the system described here currently incorporates fibroblasts into 3D cardiac tissues, additional cell types may create a more physiological relevant model to study the safety and efficacy of therapeutic compounds in vitro. Previously, a range of supporting cell types have successfully been integrated into 3D-engineered tissues presenting an exciting template for future study using the magnetic sensing contractility platform28,29,30.
Troubleshooting for this protocol centers on the formation of unreliable or inconsistent tissues during the casting process. Care must be taken to avoid bubble formation in the hydrogels as they are cast while still facilitating even distribution of the cells during mixing. Optimization experiments will likely be needed for each new cell type to identify ideal cell densities, cell ratios, and matrix composition.
A major limitation for this technique is the significant number of cells required to establish a full plate of 24 EMTs. For the data presented here, 15 million cardiomyocytes and 18 million skeletal myoblasts were used per plate. Certain researchers may not have access to such large pools of cellular material, which may inhibit their ability to use this platform to its fullest extent. If end-users do not have access to magnetic sensing hardware, measurements of post deflections need to be performed optically, which significantly reduces throughput and prevents the simultaneous recording of muscle contractions across multiple wells. However, the Mantarray hardware overcomes these limitations to offer the first commercial system capable of continuous, non-invasive analysis of EMT contraction simultaneously across multiple constructs.
Magnetic sensing across 24 wells facilitates longitudinal studies of EMT functional development in real-time and allows accurate measurement of acute responses to chemical, environmental, or genetic manipulation. While magnetic sensing has several advantages such as simultaneous measurement across multiple tissues, and does not require complicated data analysis, optical detection methods do enable simultaneous measurement of physiological metrics such as calcium flux or voltage mapping. However, data sets such as those illustrated in the results section demonstrate the breadth of applications this technology has in the drug development space. Given that few assays on the market offer the means to perform a direct assessment of contractile output in engineered muscle, these methods hold the potential to revolutionize the preclinical development pipeline.
Disclosures
All authors are employees and equity holders in Curi Bio Inc., the company that commercializes the Mantarray hardware and associated software.
Acknowledgements
This work was partially supported by funding from the Food and Drug Administration (U01 FD006676-01 awarded to the Health and Environmental Sciences Institute) and by funding from the National Institutes of Health (HL151094 to Dr. Geisse). We thank Dr. Alec S. T. Smith for his assistance with the preparation of this manuscript.
Materials
| Name | Company | Catalog Number | Comments |
|---|---|---|---|
| 100 µm cell strainer | CELLTREAT | 229485 | |
| 100 mm cell culture dish | ThermoFisher | 150466 | |
| 50 mL Steriflip filter | MilliporeSigma | SCGP00525 | |
| 500 mL filter flask | MilliporeSigma | S2GVU05RE | |
| 6-aminocaproic acid | Sigma | A2504 | |
| B27 | Gibco | 17504044 | |
| Cardiosight Maintenance Medium | NEXEL | CM-002A | |
| Cardiosight Plating Medium | NEXEL | CM-020A | |
| C-Pace EM stimulator | IonOptix | EM | |
| Curi Bio Muscle Differentiation Media Kit | Primary - DIFF | ||
| Curi Bio Muscle Maintenance Media Kit | Curi Bio | Primary - MAINT | |
| DAPI | Invitrogen | D1306 | |
| DMEM, high glucose, GlutaMAX | Gibco | 10566-016 | |
| Dnase | Sigma | 11284932001 | |
| DPBS | Gibco | 14190-250 | |
| Dystrophin antibody | Abcam | ab154168 | |
| Fetal bovine serum (FBS) | Thermo Scientific | 10082147 | Must be heat-inactivated |
| Fibrinogen (Bovine) | Sigma | E8630 | |
| Glutaraldehyde | Sigma | 354400 | |
| Ham's F10 | Gibco | 11550043 | |
| Hemacytometer | Sigma | Z359629 | |
| HS-27A Fibroblasts | ATCC | CRL-2496 | |
| Human Skeletal Muscle Myoblasts | Lonza | CC-2580 | |
| Luer Lock 0.2 µm syringe filter | Corning | 431219 | |
| Luer Lock 10 mL syringe | BH Supplies | BH10LL | |
| Mantarray Instrument | Curi Bio | MANTA-24-B1 | System |
| Mantarray Plate Kits | Curi Bio | MA-24-SKM-5 | Pack of 5 kits |
| Mantarray stimulation lid | Curi Bio | EM | |
| Matrigel (ECM) | Corning | 356231 | |
| Nexel Cardiosight-S, Cardiomyocytes | NEXEL | C-002 | |
| Optical Microscope | Nikon Ti2E | MEA54000 | |
| Pan Myosin Heavy Chain antibody | DSHB | MF-20 | |
| Poly(ethyleneimine) | Sigma | P3143 | |
| ROCK inhibitor | StemCell Technologies | Y-27632 | |
| RPMI | Gibco | 11875-093 | |
| Skeletal Muscle Growth Medium (SkGM-2) | Lonza | CC-3245 | |
| Standard 24-well plates | Greiner | M8812 | Other manufacturer's plates will not fit |
| Standard 6-well plates | ThermoFisher | 140675 | |
| Stromal medium (DMEM + 20% FBS) | |||
| T175 Filter Flask | ThermoFisher | 159910 | |
| T225 Filter Flask | ThermoFisher | 159934 | |
| Thrombin | Sigma | T4648 | |
| Trypan Blue solution, 0.4% | ThermoFisher | 15250061 | |
| TrypLE Select Enzyme (10x) | Thermo Scientific | A1217702 | |
| TrypLE Select Enzyme (1x) | Thermo Scientific | 12563011 |
References
- Sharma, A., Wu, J. C., Wu, S. M. Induced pluripotent stem cell-derived cardiomyocytes for cardiovascular disease modeling and drug screening. Stem Cell Research & Therapy. 4, 150(2013).
- Mudera, V., Smith, A. S. T., Brady, M. A., Lewis, M. P. The effect of cell density on the maturation and contractile ability of muscle derived cells in a 3D tissue-engineered skeletal muscle model and determination of the cellular and mechanical stimuli required for the synthesis of a postural phenotype. Journal of Cellular Physiology. 225 (3), 646-653 (2010).
- Vandenburgh, H., et al. Tissue-engineered skeletal muscle organoids for reversible gene therapy. Human Gene Therapy. 7 (17), 2195-2200 (1996).
- Rao, L., Qian, Y., Khodabukus, A., Ribar, T., Bursac, N. Engineering human pluripotent stem cells into a functional skeletal muscle tissue. Nature Communications. 9 (1), 126(2018).
- Fleming, J. W., et al. Bioengineered human skeletal muscle capable of functional regeneration. BMC Biology. 18 (1), 145(2020).
- Madden, L., Juhas, M., Kraus, W. E., Truskey, G. A., Bursac, N. Bioengineered human myobundles mimic clinical responses of skeletal muscle to drugs. eLife. 4, 04885(2015).
- Urciuolo, A., et al. Engineering a 3D in vitro model of human skeletal muscle at the single fiber scale. PLOS One. 15 (5), 0232081(2020).
- Afshar, M. E., et al. A 96-well culture platform enables longitudinal analyses of engineered human skeletal muscle microtissue strength. Scientific Reports. 10, 6918(2020).
- Sakar, M. S., et al. Formation and optogenetic control of engineered 3D skeletal muscle bioactuators. Lab on a Chip. 12 (23), 4976-4985 (2012).
- Vila, O. F., et al. Quantification of human neuromuscular function through optogenetics. Theranostics. 9 (5), 1232-1246 (2019).
- Khodabukus, A., Baar, K. Defined electrical stimulation emphasizing excitability for the development and testing of engineered skeletal muscle. Tissue Engineering Part C: Methods. 18 (5), 349-357 (2011).
- Vandenburgh, H., et al. Drug-screening platform based on the contractility of tissue-engineered muscle. Muscle & Nerve. 37 (4), 438-447 (2008).
- Bielawski, K. S., Leonard, A., Bhandari, S., Murry, C. E., Sniadecki, N. J. Real-time force and frequency analysis of engineered human heart tissue derived from induced pluripotent stem cells using magnetic sensing. Tissue Enineering Part C Methods. 22 (10), 932-940 (2016).
- Smith, A. S. T., et al. High-throughput, real-time monitoring of engineered skeletal muscle function using magnetic sensing. bioRxiv. , 492879(2022).
- Scheraga, H. A. The thrombin-fibrinogen interaction. Biophysical Chemistry. 112 (2-3), 117-130 (2004).
- Hinds, S., Bian, W., Dennis, R. G., Bursac, N. The role of extracellular matrix composition in structure and function of bioengineered skeletal muscle. Biomaterials. 32 (14), 3575-3583 (2011).
- Carvalho, C., et al. Doxorubicin: the good, the bad and the ugly effect. Current Medicinal Chemistry. 16 (25), 3267-3285 (2009).
- Ahmad, T., et al. Cardiac dysfunction associated with a nucleotide polymerase inhibitor for treatment of hepatitis C. Hepatology. 62 (2), 409-416 (2015).
- Gill, M., et al. From the cover: Investigative nonclinical cardiovascular safety and toxicology studies with BMS-986094, an NS5b RNA-dependent RNA polymerase inhibitor. Toxicological Sciences. 155 (2), 348-362 (2017).
- Ostap, E. M. 2,3-Butanedione monoxime (BDM) as a myosin inhibitor. Journal of Muscle Research and Cell Motility. 23 (4), 305-308 (2002).
- Fryer, M. W., Gage, P. W., Neering, I. R., Dulhunty, A. F., Lamb, G. D. Paralysis of skeletal muscle by butanedione monoxime, a chemical phosphatase. Pflügers Archiv: European Journal of Physiology. 411 (1), 76-79 (1988).
- Fleming, J. W., et al. Functional regeneration of tissue engineered skeletal muscle in vitro is dependent on the inclusion of basement membrane proteins. Cytoskeleton. 76 (6), Hoboken. 371-382 (2019).
- Capel, A. J., et al. Scalable 3D printed molds for human tissue engineered skeletal muscle. Frontiers in Bioengineering and Biotechnology. 7, 20(2019).
- Tsui, J. H., et al. Tunable electroconductive decellularized extracellular matrix hydrogels for engineering human cardiac microphysiological systems. Biomaterials. 272, 120764(2021).
- Tsui, J. H., et al. Conductive silk-polypyrrole composite scaffolds with bioinspired nanotopographic cues for cardiac tissue engineering. Journal of Materials Chemistry B. 6 (44), 7185-7196 (2018).
- Gabella, G. Muscle cells, nerves, fibroblasts and vessels in the detrusor of the rat urinary bladder. Journal of Smooth Muscle Research. 55 (0), 34-67 (2019).
- Christov, C., et al. Muscle satellite cells and endothelial cells: close neighbors and privileged partners. Molecular Biology of the Cell. 18 (4), 1397-1409 (2007).
- Bersini, S., et al. Engineering an environment for the study of fibrosis: A 3D human muscle model with endothelium specificity and endomysium. Cell Reports. 25 (13), 3858-3868 (2018).
- Gilbert-Honick, J., et al. Engineering functional and histological regeneration of vascularized skeletal muscle. Biomaterials. 164, 70-79 (2018).
- Maffioletti, S. M., et al. Three-dimensional human iPSC-derived artificial skeletal muscles model muscular dystrophies and enable multilineage tissue engineering. Cell Reports. 23 (3), 899-908 (2018).
Reprints and Permissions
