Described here is a simple workflow to differentiate endothelial cells from human pluripotent stem cells followed by a detailed protocol for their mechanical stimulation. This allows for the study of the developmental mechanobiology of endothelial cells. This approach is compatible with downstream assays of live cells collected from the culture chip after mechanical stimulation.
Method Article
In Vitro Model of Fetal Human Vessel On-chip to Study Developmental Mechanobiology
In This Article
Summary
Abstract
The heart is the first organ to be functionally established during development, thus initiating blood circulation very early in gestation. Besides transporting oxygen and nutrients to ensure fetal growth, fetal circulation controls many crucial developmental events taking place within the endothelial layer through mechanical cues. Biomechanical signals induce blood vessel structural changes, establish arteriovenous specification, and control the development of hematopoietic stem cells. The inaccessibility of the developing tissues limits the understanding of the role of circulation in early human development; therefore, in vitro models are pivotal tools for the study of vessel mechanobiology. This paper describes a protocol to differentiate endothelial cells from human induced pluripotent stem cells and their subsequent seeding into a fluidic device to study their response to mechanical cues. This approach allows for long-term culture of endothelial cells under mechanical stimulation followed by retrieval of the endothelial cells for phenotypical and functional characterization. The in vitro model established here will be instrumental to elucidate the intracellular molecular mechanisms that transduce the signaling mediated by mechanical cues, which ultimately orchestrate vessel development during human fetal life.
Introduction
During embryonic development, the heart is the first organ to establish functionality1, with detectable contractions from the earliest stage of endocardial tube formation2. Circulation, along with the mechanical cues mediated by the flow of blood within the vessel, controls many crucial aspects of early development. Prior to fetal circulation establishment, the vasculature is organized into a primary capillary plexus; upon cardiac functioning, this plexus reorganizes into venous and arterial vasculature3. The role of mechanical cues in arteriovenous specification is reflected by the pan-endothelial expression of arterial and venous markers before blood flow initiation4.
Hemodynamic forces not only control the development of the vasculature itself but also play a fundamental role in the control of blood cell formation. Hematopoietic stem and progenitor cells (HSPCs) emerge from specialized endothelial cells called hemogenic endothelium5,6,7,8, present in different anatomical regions of the embryos exclusively in the early stage of development. Heart-deficient models, together with in vitro models, have demonstrated that mechanical cues instruct and increase HSPC production from the hemogenic endothelium9,10,11,12,13,14.
Different types of flow dynamics have been shown to differentially control the cell cycle15, known to be important in both hemogenic endothelium16,17 and arterial cell specification18. Altogether, mechanical cues are critical determinants of cell identity and function during development. Novel in vitro fluidic devices allow us to overcome the limitations involved with studying developmental mechanobiology during human blood development in vivo.
The overall goal of the protocol in this manuscript is to describe, step-by-step, the experimental pipeline to study the effect of shear stress on human endothelial cells derived in vitro from human induced pluripotent stem cells (hiPSCs). This protocol contains detailed instructions on the differentiation of hiPSCs into endothelial cells and their subsequent seeding into fluidic chips for the stimulation protocol. Using this, different in vitro-derived endothelial cells can be tested for their ability to sense the shear stress by analyzing their orientation in response to the flow. This will allow other laboratories to address questions about the response to shear stress and its functional consequences on different endothelial cell identities.
Protocol
NOTE: All cell culture techniques must be performed under sterile conditions in a laminar flow hood and cells must be incubated at 37 °C in a humified atmosphere with 5% CO2. Instructions for all cytokine preparation for both maintenance (rhbFGF) and for the differentiation protocol (rhBMP4, rhVEGF, rhbFGF, rhIL6, rhFLT3L, rhIGF1, rhIL11, rhSCF, rhEPO, rhTPO, rhIL3) are in Supplementary Table S1.
1. Culturing of hiPSCs - thawing, maintenance, and freezing of cells
- Preparation of maintenance medium, growth factors, and other reagents
- Prepare the culture medium by adding the whole hESCs serum-free medium supplement, 36 mL of 25% of bovine serum albumin (BSA), and 1 mL of 55 mM of β-mercaptoethanol to Dulbecco's Modified Eagle Medium/F12 (DMEM/F-12) basal medium (see Table of Materials).
- Resuspend 1 mg of Rho Kinase inhibitor (iRock) in 1 mL of DMSO, make aliquots of 50 µL, and store them at -20 °C.
NOTE: These aliquots can be kept at -20 °C for 1 year. Once thawed, they can be kept at 4 °C for 1 week. - Thaw the vitronectin (VTN-N) solution on ice and aliquot 60 µL per vial prior to storing at -80 °C. Just before coating the plates, dilute the 60 µL stock in 6 mL of Dulbecco's phosphate-buffered saline (DPBS); the final concentration of 5 µg/mL.
- hiPSC cell line thawing
NOTE: The human pluripotent stem cell line SFCi55 was previously derived in-house and extensively used for differentiation into various cell types and different embryonic lineages19,20,21,22.- Coat one well of a 6-well plate with 1 mL of VTN-N solution for 1 h at 37 °C.
NOTE: After incubation, coated plates can be stored at 4 °C for up to 1 week. - Aspirate the VTN-N solution with an aspiration pipette and add 1 mL of prewarmed culture medium supplemented with 20 ng/mL of rhbFGF (Supplementary Table S1).
- Quickly defrost the vial containing the hiPSCs in a water bath and transfer the cell into 5 mL of prewarmed culture medium.
- Spin the cells down for 3 min at 300 × g at room temperature.
- Resuspend the cell pellet in 0.5 mL of culture medium supplemented with 20 ng/mL of rhbFGF.
- Transfer the cells to one coated well containing already 1 mL of medium.
- Add 5 µL of iRock into the wells containing the cells in a total of 1.5 mL of medium.
- Culture the cells in the incubator, change the medium daily during the week, and double-feed the cells, adding twice the normal volume of medium to the cells to ensure feeding over the weekend.
NOTE: Cells are grown in the presence of iRock for 24 h only.
- Coat one well of a 6-well plate with 1 mL of VTN-N solution for 1 h at 37 °C.
- Maintenance and passaging of hiPSCs
- Change the medium daily with fresh prewarmed culture medium supplemented with 20 ng/mL of rhbFGF.
- Passage the cells when they reach approximately 80% confluency, generally twice a week.
- To passage the cells, coat a plate with VTN-N as described before in steps 1.2.1 and 1.2.2.
- Aspirate the medium from the wells with cells and wash them with DPBS.
- Aspirate the DPBS and add 1 mL of dissociation reagent (see Table of Materials) and incubate for 1 min.
- Aspirate the dissociation reagent and incubate for a further 3 min. Firmly tap the plate 10 times on each side.
NOTE: The dissociation step might need cell-type specific optimization in the incubation time and the tapping procedure. - Add 1 mL of culture medium to the cells and with a Pasteur pipette, wash once the with the medium to ensure that most of the colonies are collected.
- Add 150 µL of the cell suspension to each well to provide a passage ratio of 1 well into 6.
NOTE: Immediately after thawing a new vial, it is better to passage the cells at a lower ratio such as 1:1 or 1:2 for one or two passages to allow them to reach a steady growing phase before passaging at a ratio of 1:6. - Culture the cells in the incubator, change the medium daily during the week, and double-feed the cells once over the weekend.
- hiPSCs cell line freezing
NOTE: Freeze cells within their first two passages after thawing to ensure to maintain a constant low passage batch of frozen vials to start the culture. Freeze the cells when they reach a confluency of approximately 80%.- Change the medium to fresh prewarmed culture medium supplemented with 20 ng/mL of rhbFGF and 5 µL of iRock and incubate for at least 1 h.
- Detach the cells as described in steps 1.3.2.2-1.3.2.5.
- Collect the detached cells in a 15 mL centrifuge tube containing 5 mL of culture medium.
- Centrifuge for 3 min at 300 × g at room temperature.
- Aspirate the supernatant and add 1 mL of cryopreservation solution (see Table of Materials).
- Using a Pasteur pipette, gently pipette the cells up and down to mix them in the cryopreservation solution.
NOTE: Avoid excessive pipetting, which might result in dissociating the cell clusters. - Divide the cell suspension into two cryopreservation vials with 0.5 mL each.
- Transfer the cryopreservation vials to a cryopreservation container precooled at 4 °C.
- Transfer the container with the cells to a -80 °C freezer for 24 h before transferring the vials to liquid nitrogen for long-term storage.
2. Differentiation of hiPSCs into endothelial cells
- Preparation of differentiation medium, cytokines, and growth factors
- Prepare serum-free differentiation medium (SFD) according to Table 1. Use this medium from Day 0 to Day 5 of differentiation.
- Prepare serum-free medium for CD34+ cells (SFM-34) by adding 34 nutrient supplement and 5 mL of L-glutamine supplement to the 34 SFM Basal Medium (see Table of Materials). Use this medium from Day 6 of differentiation onwards.
- Resuspend 1 mg of CHIR99021 in 716 µL of DMSO to obtain a 3 mM solution. Incubate at room temperature until fully resuspended; if needed, warm up quickly at 37 °C. Make 20 µL aliquots and store them at -20 °C for up to 6 months. Use immediately after thawing and do not freeze again or store.
- Resuspend the cytokines according to the instruction in Supplementary Table S1. Store all cytokines' aliquots at -80 °C.
- Endothelial cells differentiation
NOTE: For each day of the differentiation, prepare 18 mL (3 mL medium/well) of prewarmed SFD medium, according to the cytokines' mixes described in Table 2.- Day 0 - formation of embryoid bodies (EBs)
- Prepare 18 mL of SFD medium with Mix 1 cytokine according to Table 2, for each 6-well plate (3 mL/well).
- Add 2 mL of prewarmed SFD medium with Mix 1 cytokine in each well of a cell-repellent 6-well plate (see Table of Materials).
- To form EBs, follow the steps described in steps 1.3.2.2-1.3.2.4.
NOTE: Ensure that hiPSCs are 70-80% confluent to start the differentiation. - Add 1 mL of prewarmed SFD medium with Mix 1 cytokines to each well of detached cell clusters.
- Use a Pasteur pipette to gently transfer the cell clusters into a single well of cell-repellent well for EB formation at a ratio of 1:1.
- After placing the plate in the incubator, move it forward and back, right and left, to disperse the EBs evenly in the well.
- Day 1 - medium change to the EBs
NOTE: This step is only necessary if, by day 1 of differentiation, there are many single cells in suspension alongside the EBs.- Prepare 18 mL of SFD medium with Mix 1 cytokine according to Table 2, for each 6-well plate (3 mL/well).
- Swirl the plate with the EBs to move them into the center and collect them using a Pasteur pipette into a 15 mL centrifuge tube.
NOTE: If the EBs look clumped together as in strings, separate them by pipetting them up and down with a P1000 before collecting them into the 15 mL centrifuge tube. - Wait 5-10 min for the EBs to settle at the bottom of the tube.
NOTE: If the EBs are too small, centrifuge them for 5 min at 100 × g to help them settle. - Wash the cell-repellent plates with sterile water or DPBS to remove any single cells or debris.
- Carefully and slowly aspirate the supernatant from the EBs without dislodging them.
- Add 2 mL of SFD with Mix 1 cytokines to each well of the cell-repellent plates.
- Resuspend the EBs using 1 mL of SFD medium with Mix 1 cytokines for each starting well - for a 6-well plate, add 6 mL of medium.
- Transfer the EBs to the cell-repellent plates in 1 mL volume per well, which already contains 2 mL of SFD medium.
- After placing the plate in the incubator, move it forward and back, right and left, to disperse the EBs evenly in the well.
- Day 2 - addition of CHIR99021
- Swirl the EBs into the center of the plate and add CHIR99021 according to Table 2 on the side of the well to avoid direct contact with the cells.
NOTE: If the medium was not changed at Day 1, replace the whole medium instead of adding CHIR alone. Prepare 18 mL of SFD medium with Mix 2 according to Table 2, for each 6-well plate (3 mL/well). - After placing the plate in the incubator, move it forward and back, right and left, to disperse the EBs evenly in the well.
- Swirl the EBs into the center of the plate and add CHIR99021 according to Table 2 on the side of the well to avoid direct contact with the cells.
- Day 3 - medium change to the EBs and addition of Mix 3 cytokines
- Prepare 18 mL of SFD medium with Mix 3 cytokines according to Table 2, for each 6-well plate (3 mL/well).
- Collect the EBs as described in steps 2.2.2.2-2.2.2.4.
- Add prewarmed 2 mL of SFD medium with Mix 3 cytokines to the cell-repellent plates.
- Carefully aspirate the supernatant from the EBs. Add 1 mL/well of SFD with Mix 3 cytokines.
- Distribute the EBs between the wells as described in steps 2.2.2.8-2.2.2.9.
- Day 6 - medium change for SFM-34 and addition of Mix 4 cytokines
- Prepare 18 mL of SFD medium with Mix 4 cytokines according to Table 2, for each 6-well plate (3 mL/well).
- Collect the EBs as described in steps 2.2.2.2-2.2.2.4.
- Add 2 mL of prewarmed SFM-34 medium with Mix 4 cytokines to the cell-repellent plates.
- Carefully aspirate the supernatant from the EBs. Add 1 mL/well of SFM-34 with Mix 4 cytokines.
- Distribute the EBs between the wells as described in steps 2.2.2.8-2.2.2.9.
- Day 0 - formation of embryoid bodies (EBs)
3. CD34+ cells isolation and seeding into the chip
NOTE: CD34+ cells are isolated via a positive isolation approach with a CD34 microbead kit (see Table of Materials), that contains CD34 microbeads conjugated to monoclonal mouse antibodies anti-human CD34 antibodies and FcR Blocking reagent (Human IgG). It is important to validate the efficiency of the column isolation by staining cells before and after the isolation for flow cytometry analysis, Below it is indicated when cells need to be taken for this analysis.
- Prepare materials and reagents.
- Prepare washing buffer by adding 5 mL of 5% BSA solution and 200 µL of EDTA 0.5 M to 45 mL of DPBS to obtain PBS + 0.5% BSA + 2 mM EDTA. Prepare fresh for each isolation, filter-sterilize, and keep refrigerated until use.
- Coat fluidic chips with laminin solution prepared by diluting the rhLaminin 521 1:50 in DPBS Ca2+ Mg2+. Coat each chip with the appropriate volume for the chip in use and incubate in the incubator for 2 h ahead of seeding.
NOTE: Other matrices can be employed for the coating and should be tested for the specific cell type/experiment. - Prepare Mix 4 SFM-34 medium by supplementing 18 mL of SFM-34 medium with Mix 4 cytokines according to Table 2 and place the mixture in a 50 mL tube in the incubator with the lid slightly unscrewed to facilitate gas exchange.
- Place the selected perfusion sets and any other tubing to be used in the incubator to degas.
- Day 8 - dissociation of EBs and CD34+ isolation
- Collect the EBs as described in steps 2.2.2.2-2.2.2.5.
- Add 1 mL of cell dissociation reagent per starting well of EBs collected (if 6 wells were collected, add 6 mL).
- Transfer back 1 mL of the EB suspension in the cell dissociation reagent to each well of the cell-repellent plate.
- Incubate for 10 min in the incubator.
- Gently pipette the EBs up and down against the well with a P1000, no more than 10 times.
- Repeat steps 3.2.4-3.2.5.for a total of 3x.
NOTE: If the EBs are difficult to dissociate, repeat the above steps 4x in total. - Add 5 mL of washing buffer for each well of dissociated EBs.
- Collect the cells into a 50 mL centrifuge tube by passing them through a 40 µm strainer. Take 10 µL of the cell suspension to count the cells.
NOTE: To test for the efficiency of the isolation, transfer 105 cells/tube into two different tubes (unstained control and presorted test sample) that will be used later for flow cytometry (as described in steps 4.3.9-4.3.13). For a 6-well plate, ~106 cells should be collected after filtration. - Spin the cells down for 10 min at 300 × g.
- Resuspend the cells in 300 µL of washing buffer, gently pipetting a few times to make sure that no clumps are present. Continue following the manufacturer's protocol (see Table of Materials).
- CD34+ cell seeding into fluidic chips
NOTE: The fluidic chip used in the protocol has a channel height of 0.6 mm and length of 50 mm, for a total growth area of 2.5 cm2 (Supplementary Figure S1). This type of chip is seeded with a total volume of cell suspension of 150 µL. Different chips can be used, and the volume of seeding and the cell density should be adapted according to the growth area. Additional optimization might be needed depending on the cell line used and its growth.- Resuspend the isolated CD34+ cells in 300 µL of prewarmed SFM-34 medium with Mix 4 cytokines.
- Take 10 µL of the cell suspension and count the cells.
- Resuspend 2.5 × 10⁵ cells in a final volume of 150 µL supplemented SFM-34; add 0.5 µL of iRock.
NOTE: To test for the efficiency of the isolation, transfer 105 cells/tube into a tube (post-sorted test sample) that will be used later for flow cytometry (as described in steps 4.3.9-4.3.13). - Slowly aspirate the laminin from fluidic chips by putting the tip of a P200 inside the reservoir on the edge of the channel.
NOTE: If the liquid is difficult to collect, slowly lift one side of the chip to help the liquid move to the opposite reservoir. - Add the cell suspension steadily into the channel to make sure no bubbles are formed.
NOTE: Perform steps 3.3.4-3.3.5 quickly but gently to avoid the laminin drying out and the formation of bubbles in the channels of the chip. If bubbles are formed, lift one side of the chip and gently tap the slide to mobilize the bubbles; when they reach the reservoir, they will rise to the air interface and should not be able to renter the channel. - Transfer the chip to the incubator and leave them overnight so that the cells are completely attached to the channel and look elongated.
- When the cells are fully attached, aspirate the medium as in step 3.3.4 and replace it with 200 µL of cytokine-supplemented SFM-34.
- From now on, replace the medium daily until the cells have reached 90%-100% confluency.
4. Application of continuous flow to endothelial cells - Aorta-on-a-chip
- Prepare materials and reagents.
- Prepare Mix 4 SFM-34 medium by supplementing 18 mL of SFM-34 medium with Mix 4 cytokines according to Table 2 and place it in a 50 mL tube in the incubator with the lid slightly unscrewed to facilitate gas exchange.
- Place the selected perfusion sets and any tubing to be used for the fluidic setup in the incubator to degas.
- Fluidic system assembly
- Install the perfusion set into the unit according to the manufacturer's protocol.
NOTE: Remember to use clamps in the system. If sliding clamps are used for this step, they need to be slid on the tubing before connecting to the chip. - Attach a new fluidic chip and add the cytokine-supplemented SFM-34 medium, making sure to fill both reservoirs under sterile conditions in the hood.
- Perform the bubble removal program and the calibration step.
- Remove the fluidic unit with the connected set from the incubator and transfer it into the hood; take also the chips containing the cells from the incubator.
- Clamp the tubing on both sides of the test chip.
- Remove the tubing from the test chip.
NOTE: Check that no bubbles are present in the Luer connector at the end of the tubing. If bubbles are visible, carefully aspirate them using a P200 pipette and if necessary, add more medium to make sure that the connector is filled with medium. - Connect the chip containing the cells with the tubing.
- Remove or open the clamps.
- Transfer the system to the incubator and connect the air pump to the fluidic unit.
- Start the preselected program using the pump-dedicated software (Supplementary Figure S2) with the gradual increase of shear stress described in Table 3.
NOTE: Depending on the specific experiment that is needed, the stimulation program might need optimization. Described here is a gradual shear stress increase leading to the final value of 5 dyn/cm2, which mimics the shear stress calculated to be experienced by the wall of the dorsal aorta at the onset of fetal circulation 9. Independently of the final shear stress that will be employed, it is necessary to gradually increase over time to allow the cells to adapt to the force without causing the cells to detach from the chip. If the selected stimulation protocol is longer than 3 days, cytokines should be topped up into the system by adding 1 mL of SFM-34 containing the Mix 4 cytokines that would normally be added into 18 mL. To do this, the pump program is quickly paused and 500 µL of supplemented medium is added to each of the two syringes in the fluidic set.
- Install the perfusion set into the unit according to the manufacturer's protocol.
- Cell collection for analysis
- Prewarm the dissociation buffer in a water bath.
- Remove the fluidic unit from the incubator and move it into the hood.
- Clamp the tubing flanking the chip on both sides and remove the tubing from the reservoirs on the chip.
- Gently remove the medium from the chip and replace it with DPBS Ca2+ Mg2+ to wash the cells.
NOTE: This step of washing with PBS can be skipped if the cells start to detach. - Gently add 150 µL of dissociation buffer and incubate for 3 min at 37 °C.
NOTE: Check under the microscope if the cells are single and detached; otherwise, incubate for an additional 2 min. It is essential that the cells are completely detached from the channel before aspirating the medium, as the chip does not allow to aid cell detachment by pipetting. Other solutions can be employed to detach the cells, such as trypsin or EDTA-based buffers. - Collect the dissociation buffer containing the cells from one reservoir and transfer to a 15mL centrifuge tube and wash the channel once with DPBS to collect all the detached cells.
- Add 1 mL of washing buffer to the 15 mL tube with the cells and take 10 µL to count the cells.
- Divide the cell suspension in flow cytometry tubes to have 105 cells per test tube.
- Spin the tubes for 5 min at 300 × g.
- Prepare the staining solution to have 50 µL for each test tube to stain. Add the CD34 PerCP-efluor710 or CD34-PE at 1:100 and 1:200 dilution, respectively.
- Resuspend the cells in 50 µL of staining solution and incubate for 30 min at 4 °C.
- Wash the cells by adding 2 mL of washing buffer and spin for 5 min at 300 × g.
- Resuspend the pellets in 100 µL of staining solution and acquire the data using a flow cytometer.
NOTE: The cells can also be lysed directly in the chip for RNA extraction using 150 µL of RNA lysis buffer or fixed for imaging using 4% paraformaldehyde in DPBS for 10 min at room temperature.
- Cell orientation analysis
- Analyze the images to quantify changes in cell orientation using FIJI23 (Supplementary Figure S3).
- Open the Region of Interest (ROI) manager from the Analyze | Tools | ROI manager menu.
- Draw the cell contours manually using the polygon selection tool and add them to the ROI manager by clicking Add or using the CTRL+T shortcut.
- Measure the orientation of each ROI by choosing the Fit ellipse measure in the Analyze | Set Measurements menu.
- Apply the measurement to all ROIs through the More... Multi measure command in the ROI manager.
NOTE: This step will fit an ellipse to each ROI and generate a table containing the length of the major and minor ellipse axes, as well as the angle. - Export the table to a CSV file to be imported into other software to plot.
NOTE: The script used for the plots is available at https://gist.github.com/nicolaromano/708b3231d730ee7f70763a7cf885
0ddc.
- Analyze the images to quantify changes in cell orientation using FIJI23 (Supplementary Figure S3).
Results
We describe here a protocol for the differentiation and mechano-stimulation of endothelial cells derived from hiPSCs that allows the study of their response to mechanical cues (Figure 1). This protocol results in the production of functionally mechanosensitive endothelial cells. We provide here representative results and describe the expected phenotype to assess how the cells respond to the cytokine stimulation during the differentiation.
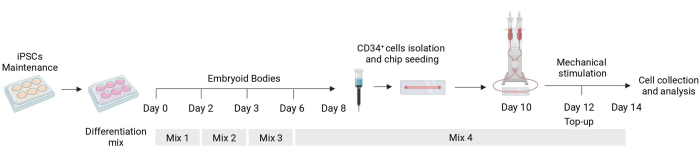
Figure 1: Schematic of the differentiation and mechanical stimulation protocol. Schematic of the differentiation protocol showing the timing of the different mixes of cytokines, the CD34+ cell isolation, fluidic chip seeding, and final analysis of the mechanically stimulated cells. Please click here to view a larger version of this figure.
Culture of hiPSCs
It is important to start the protocol from hiPSCs that are growing correctly in self-renewal conditions. A good indication of the quality of the culture is the speed of their growth. After thawing, the cells might need 2-3 weeks to reach the correct phase of growth that will ensure good differentiation. When the cells can be passaged twice a week at the ratio of 1:6 reaching almost full confluency, this is the time that they are ready to be differentiated on the same day they need to be passaged.
Differentiation of hiPSCs into endothelial cells
The first step of the differentiation, consisting of the formation of embryoid bodies (EBs), is cell line-dependent and may need some optimization for the specific cell line in use. The dissociation described in protocol steps 1.3.2.2-1.3.2.4 can be modified by either reducing or extending the incubation with the dissociation reagent and the subsequent dissociation with the Pasteur pipette. Furthermore, other dissociation reagents can be used for this step in addition to the physical dissociation of the colonies with a cutting tool or a P100 pipette tip. EBs of good quality show a defined edge by day 2 of the differentiation and appear clear and bright when observed using a microscope; darker areas might indicate cell death within the EBs (Figure 2).
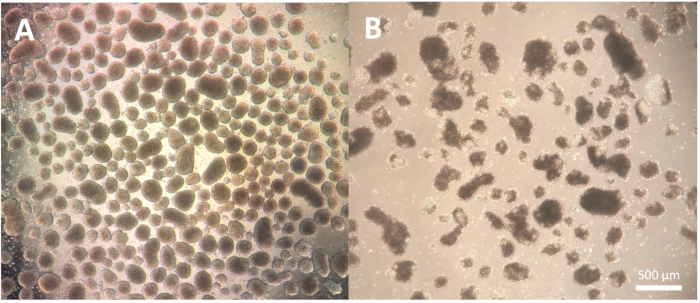
Figure 2: Embryoid bodies morphology. (A) Day 2 embryoid bodies showing well-defined outer edges and consistent size. (B) Day 2 embryoid bodies of poor quality showing extensive cell death leading to disaggregation of the structure. Scale bar = 500 µm. Please click here to view a larger version of this figure.
At day 2, the addition of CHIR99021 to the EBs inhibits the GSK-3 protein resulting in the activation of the Wnt pathway. Different cell lines have different responses to CHIR treatment, and this should be tested by quantifying the number of CD34+ cells obtained at day 8 by using different concentrations (Figure 3).
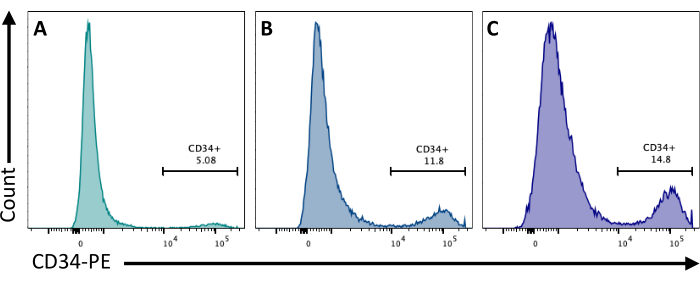
Figure 3: Endothelial cell differentiation with different CHIR treatments. Endothelial cell commitment quantified by flow cytometry at day 8 of differentiation by CD34 membrane expression, following CHIR treatment at day 2 at (A) 3 µM, (B) 5 µM, and (C) 7 µM. Flow cytometry data were obtained using five-laser cytometers and dedicated software (see Table of Materials). Please click here to view a larger version of this figure.
CD34+ cell isolation
It is important to validate that the CD34+ enrichment using the magnetic beads provides at least 80% CD34+ after elution of the column. To ensure sufficient purity, an aliquot of cells obtained from the magnetic isolation can be analyzed by flow cytometry making sure to use a different antibody clone than the one used for the magnetic enrichment. Here, the 4H11 clone was used and ~85% purity was achieved post enrichment (Figure 4).
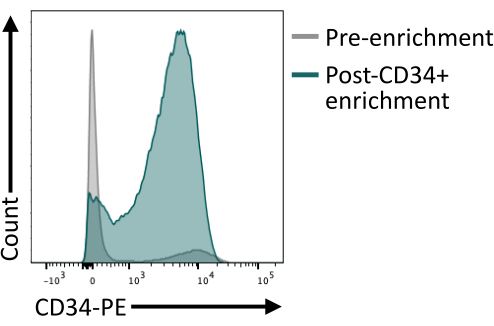
Figure 4: Membrane expression of CD34 before and after enrichment by magnetic sorting. Day 8 dissociated embryoid bodies (grey) and cells after magnetic enrichment (green) were stained for CD34 expression and analyzed by flow cytometry, showing successful enrichment post sorting. Flow cytometry data were obtained using five-laser cytometers and dedicated software (see Table of Materials). Please click here to view a larger version of this figure.
Seeding cells into the fluidic channel
When seeding the cells in the fluidic channel, it is crucial to track the adhesion and proliferation of the endothelial cells. After seeding, the cells take ~5 h to fully adhere to the channel (Figure 5A). An alternative coating solution may also be tested to improve adhesion at this stage. To confirm that the tested cells are mechanosensitive and thus, able to respond to mechanical stimulation, the cell orientation can be tested over time. Cells before the stimulation show random orientation (Figure 5A and Figure 5C) and they reorient parallel to the direction of the flow (Figure 5B,C). The protocol described here allows for the collection of the cells from the channel to perform downstream analysis, for example, flow cytometry, for the study of their membrane immunophenotype, providing the endothelial identity of the stimulated cells (Figure 5D,E).

Figure 5: Mechanoresponsiveness of hiPSCs-derived endothelial cells. (A) Confluent layer of isolated CD34+ cells 48 h post seeding. (B) Reoriented layer of endothelial cells 3 days under dynamic culture. (C) Orientation analysis of the endothelial cells after 5 days of dynamic culture. (D) CD34 expression profile of cells cultured under flow for 5 days. (E) Percentage of CD34+ cells of cell population retrieved from the fluidic channel. Images were taken using an inverted in-incubator microscope; flow cytometry data were obtained using five-laser cytometers and dedicated software (see Table of Materials). Scale bars = 100 µm (A,B). Please click here to view a larger version of this figure.
| Reagents | Stock concentration | Volume added | Final concentration |
| Iscove’s Modified Dulbecco’s Medium (IMDM) | - | 333 mL | - |
| Ham’s F-12 Nutrient mixture (F-12) | - | 167 mL | - |
| N-2 supplement (100x) | 100 x | 5 mL | 1x |
| B-27 supplement (50x) | 50 x | 10 mL | 1x |
| Ascorbic acid | 10 mg/mL | 1.25 mL | 25 µg/mL |
| α-Monothioglycerol (MTG) | 11.5 M | 19.5 µL | 448.5 µM |
| Human Serum Albumin | 100 mg/mL | 2.5 mL | 0.5 mg/mL |
| Holo-Transferrin | 100 mg/mL | 0.75 mL | 150 µg/mL |
Table 1: Composition and recipe for 500 mL of Serum-free Differentiation (SFD) medium.
| Days of differentiation | Cytokine Mix | Cytokine | Final concentration |
| Day 0 - 2 | Mix 1 | BMP4 | 20 ng/mL |
| Day 2 | Mix 2 | CHIR99021 | 7 μM |
| From day 3 onward | Mix 3 and 4 | VEGF | 15 ng/mL |
| bFGF | 5 ng/mL | ||
| From day 6 onward | Mix 4 | IL6 | 10 ng/mL |
| FLT3L | 10 ng/mL | ||
| IGF1 | 25 ng/mL | ||
| IL11 | 5 ng/mL | ||
| SCF | 50 ng/mL | ||
| EPO | 3 U/mL | ||
| TPO | 30 ng/mL | ||
| IL3 | 30 ng/mL |
Table 2: Mixes of cytokines used for endothelial cell differentiation, days in which they are added to the SFD medium, and final concentration.
| Shear Stress (dyn/cm2) | Time (h) |
| 0.5 | 1 |
| 1 | 1 |
| 1.5 | 1 |
| 2 | 1 |
| 2.5 | 1 |
| 3 | 1 |
| 3.5 | 1 |
| 4 | 1 |
| 4.5 | 1 |
| 5 | Until end of the experiment |
Table 3: Shear stress values for the dynamic culture and length of their application.
Supplementary Figure S1: Geometry and dimensions of the chip and tubing used for this protocol. Please click here to download this File.
Supplementary Figure S2: Step-by-step guide for the software controlling the air pump with a description of each step. Please click here to download this File.
Supplementary Figure S3: Guide for the orientation analysis using FIJI showing the drawing of the cell shape, elliptic fitting, and final measurement. Please click here to download this File.
Supplementary Table S1: Unit size, resuspension volume, and stock concentrations for cytokines used in differentiation protocol. Please click here to download this File.
Discussion
The protocol that we describe here allows for the generation of mechanosensitive endothelial cells from human pluripotent stem cells and the study of their response to mechanical stimulation mediated by controlled shear stress. This protocol is entirely cytokine-based and fully compatible with GMP reagents for potential translation into the production of cells for cell therapy.
The derivation of hiPSCs provides scientists with an instrumental model for the early stages of embryonic development that enables the study of processes that are otherwise difficult to study in vivo24. In fact, human embryonic tissues available for research are collected from embryos lacking circulation, and this might have a significant impact on the molecular signature controlled by mechanical cues. The approach described here enables live-imaging and real-time study of cell response to shear stress. The combination of hiPSCs with fluidics provides a model of study that overcomes the limited availability and the inaccessibility of the developing fetal tissues when the initiation of circulation remodels and controls the establishment of the cardiovascular and blood system3,9,10,25.
A limitation of the protocol is that the endothelial cells derived from this protocol might not reflect the various identities of different endothelial cells present in the developing tissues. To overcome this limitation, a specific combination of cytokines might be needed during the differentiation process preceding the fluidic stimulation to obtain the desired identity or tissue-specific phenotype26. The isolation of endothelial subsets can be obtained using a more refined immunophenotype during the isolation step. This protocol isolates endothelial cells based only on the expression of CD34, thereby allowing for column isolation instead of fluorescence-activated cell sorting (FACS); this reduces cell death and the risk of contamination. Furthermore, this protocol is specifically designed to study the role of shear stress mediated by laminar flow. Alternative fluidic approaches will have to be employed to study the effect of other mechanical cues, such as stretching or compression, or other types of flow such as perturbed or disturbed flow.
We have previously shown that iPSC-derived endothelial cells mimic the heterogeneous arteriovenous cellular identities27 similar to that observed in the fetal dorsal aorta28,29,30. This is of particular importance in the context of vessel development and cellular specification, known to be controlled by blood circulation. Studies in different models showed that lack of circulation results in altered arteriovenous specification11,14,31. The mechanisms that connect mechanical cues with cell specification are still unknown and the pipeline described here allows for refined functional studies that could not be tested in vivo.
This pipeline describes the production and the stimulation of endothelial cells derived from hiPSCs using commercially available fluidic channels, avoiding the need for casting the devices as for the widely used polydimethylsiloxane (PDMS) devices12. Furthermore, the use of PDMS chips makes the collection of the stimulated cells particularly challenging, while with this protocol, the cells can be easily retrieved from the channel. This significantly improves the analytic power allowing for subsequent analysis such as proteomic and transcriptomic analyses, flow cytometry, and functional assays, which might need further culture or in vivo assays.
Disclosures
The authors have no conflicts of interest to disclose.
Acknowledgements
This work was supported by the Research Advanced Grant 2021 from the European Hematology Association, the Global Research Award 2021 from the American Society of Hematology, and the Internal Strategy Support Fund ISSF3 funded by the Welcome Trust and the University of Edinburgh. We thank Fiona Rossi from the Flow Cytometry Facility for support in the flow cytometry analysis. For the purpose of open access, the author has applied a Creative Commons Attribution (CC BY) license to any Author Accepted Manuscript version arising from this submission.
Materials
| Name | Company | Catalog Number | Comments |
|---|---|---|---|
| 0.6 Luer uncoated slide | ibidi | IB-80186 | |
| 25% BSA | Life Technologies | A10008-01 | |
| 6-well plates | Greiner Bio-one | 657160 | |
| Accutase | Life Technologies | A1110501 | Cited as Dissociation reagent |
| Ascorbic acid | Merck | A4544-100G | |
| Aspiration pipette | Sardtedt | 86.1252.011 | |
| B27 supplement | Life Technologies | 17504044 | Cited as Neuronal cell culture supplement (50x) |
| BD FACS DIVA | BD Biosciences | Version 8.0.1 | Cited as flow cytometry software |
| BD LSR Fortessa 5 Laser | BD Biosciences | ||
| bFGF | Life Technologies | PHG0021 | |
| CD34 Microbead kit | Miltenyil Biotec | 30-046-702 | |
| CD34 PE clone 4H11 | Invitrogen | 12-0349-42 | |
| CD34 PerCP-eFluor 710 clone 4H11 | Invitrogen | 44-0349-42 | |
| Cellstar cell-repellent surface 6-well plates | Greiner Bio-one | 657970 | Cited as cell-repellent plate |
| CHIR99021 | Cayman Chemicals | 13122-1mg-CAY | |
| Cryostor CS10 cell cryopreservation | Merck | C2874-100ML | Cited as Cryopreservation solution |
| Dimethyl Sulfoxide | VWR | 200-664-3 | Cited as DMSO |
| DMEM/F-12 | Life Technologies | 10565-018 | |
| DPB Ca2+ Mg2+ | Life Technologies | 14080055 | |
| DPBS | Life Technologies | 14200075 | |
| EASY Strainer 40 μm | Greiner Bio-one | 542040 | |
| EDTA | Life technologies | 15575020 | |
| FcR Blocking Reagent | Miltenyil Biotec | 130-059-901 | |
| Fiji | Version 1.53c | ||
| Flow Jo | Version 10.7.1 | Cited as flow cytometry sanalysis oftware | |
| FLT3L | Peprotech | 300-19-10uG | |
| Fluidic unit | ibidi | 10903 | |
| GlutaMax | Life Technologies | 35050038 | Cited as L-glutamine supplement |
| Ham F-12 | Life Technologies | 11765054 | |
| Holo-transferrin | Merk | T0665-500MG | |
| Human Serum Albumin | Fujifilm UK LTD | 9988 | |
| Ibidi Pump system | ibidi | 10902 | Cited as Pump system |
| IMDM | Life Technologies | 12440053 | |
| Inverted microscope | ioLight/Thisle Scientific | IOL-IO-INVERT | Cited as inverted in-incubator microscope |
| Lyophilised BSA | Merck | A2153-100G | |
| MiniMACS Separator | Miltenyil Biotec | 130-042-102 | Cited as Magnetic separator |
| MS Columns | Miltenyil Biotec | 130-042-201 | Cited as Magnetic column |
| MTG | Merck | M6145-25ML | |
| N2 supplement | Life Technologies | 17502048 | |
| Notebook for pump system | ibidi | 10908 | |
| Paraformaldehyde 37-41% | Fisher Chemicals | F/1501/PB15 | |
| Pastette | Greiner Bio-one | 612398 | |
| Pen/Strep | Gibco | 15070063 | |
| Perfusion Set YELLOW/GREEN: 50 cm, ID 1.6 mm, 10 mL reservoirs | Ibidi | IB-10964 | Cited as Perfusion set |
| Polystyrene Round Bottom Tubes | Falcon | 352008 | Cited as Flow cytometry tubes |
| Prism 9 | Verison 9.4.0 | ||
| Pump control software | ibidi | version 1.6.1 | Cited as Pump software |
| ReLeSR | Stem cell tecchonologies | 5872 | Cited as Detaching solution |
| rhBMP4 | R&D | 314-BP-010 | |
| rhEPO | R&D | 287-TC-500 | |
| rhIGF1 | Peprotech | 100-11-100uG | |
| rhIL11 | Peprotech | 200-11-10uG | |
| rhIL3 | Peprotech | 200-03-10uG | |
| rhIL6 | R&D | 206-IL-010 | |
| rhLaminin-521 | Life technologies | A29248 | Cited as Laminin |
| rhSCF | Life Technologies | PHC2111 | |
| rhTPO | R&D | 288-TPN-025 | |
| rhVEGF | R&D | 293-VE-010 | |
| RLT Lysis Buffer | Qiagen | 79216 | |
| Serial Connector for µ-Slides: Sterile, Sterile | ibidi | IB-10830 | |
| StemPro-CD34 SFM media | Life Technologies | 10639011 | Cited as Serum-Free media for CD34+ cells (SFM-34) |
| StemPro-CD34 Nutrient Supplement | Life Technologies | 10641-025 | Cited as 34 nutrient supplement |
| StemPro hESC SFM | Life Technologies | A1000701 | Cited as Culture media |
| StemPro supplement | Life Technologies | A10006-01 | |
| Vitronectin (VTN-N) recombinant human protein, truncated | Invitrogen | A31804 | |
| Y-27632 dihydrochloride | Tocris | 1254 | Cited as iRock |
| β-Mercaptoethanol | Gibco | 21985023 |
References
- Copp, A. J. Death before birth: clues from gene knockouts and mutations. Trends in Genetics. 11 (3), 87-93 (1995).
- Ji, R. P., et al. Onset of cardiac function during early mouse embryogenesis coincides with entry of primitive erythroblasts into the embryo proper. Circulation Research. 92 (2), 133-135 (2003).
- Peacock, H. M., Daems, M., Jones, E. A. V. Hemodynamic control of endothelial cell fates in development. Cardiac and Vascular Biology. 8, 127-166 (2021).
- Chong, D. C., Koo, Y., Xu, K., Fu, S., Cleaver, O. Stepwise arteriovenous fate acquisition during mammalian vasculogenesis. Developmental Dynamics. 240 (9), 2153-2165 (2011).
- Jaffredo, T., Gautier, R., Eichmann, A., Dieterlen-Lièvre, F. Intraaortic hemopoietic cells are derived from endothelial cells during ontogeny. Development. 125 (22), 4575-4583 (1998).
- Zovein, A. C., et al. Fate Tracing reveals the endothelial origin of hematopoietic stem cells. Cell Stem Cell. 3 (6), 625-636 (2008).
- Bertrand, J. Y., et al. Haematopoietic stem cells derive directly from aortic endothelium during development. Nature. 464 (7285), 108-111 (2010).
- Boisset, J. C., et al. In vivo imaging of haematopoietic cells emerging from the mouse aortic endothelium. Nature. 464 (7285), 116-120 (2010).
- Adamo, L., et al. Biomechanical forces promote embryonic haematopoiesis. Nature. 459 (7250), 1131-1135 (2009).
- Diaz, M. F., et al. Biomechanical forces promote blood development through prostaglandin E2 and the cAMP-PKA signaling axis. Journal of Experimental Medicine. 212 (5), 665-680 (2015).
- North, T. E., et al. Hematopoietic stem cell development is dependent on blood flow. Cell. 137 (4), 736-748 (2009).
- Lundin, V., et al. YAP regulates hematopoietic stem cell formation in response to the biomechanical forces of blood flow. Developmental Cell. 52 (4), 446.e5-460.e5 (2020).
- Li, J., et al. Mimicry of embryonic circulation enhances the hoxa hemogenic niche and human blood development. Cell Reports. 40 (11), 111339(2022).
- Azzoni, E., et al. The onset of circulation triggers a metabolic switch required for endothelial to hematopoietic transition. Cell Reports. 37 (11), 110103(2021).
- Li, Y. S. J., Haga, J. H., Chien, S. Molecular basis of the effects of shear stress on vascular endothelial cells. Journal of Biomechanics. 38 (10), 1949-1971 (2005).
- Batsivari, A., et al. Understanding hematopoietic stem cell development through functional correlation of their proliferative status with the intra-aortic cluster architecture. Stem Cell Reports. 8 (6), 1549-1562 (2017).
- Canu, G., et al. Analysis of endothelial-to-haematopoietic transition at the single cell level identifies cell cycle regulation as a driver of differentiation. Genome Biology. 21 (1), 157(2020).
- Luo, W., et al. Arterialization requires the timely suppression of cell growth. Nature. 589 (7842), 437-441 (2020).
- Yang, C. -T., et al. Activation of KLF1 enhances the differentiation and maturation of red blood cells from human pluripotent stem cells. Stem Cells. 35 (4), 886-897 (2017).
- Lopez-Yrigoyen, M., et al. A human iPSC line capable of differentiating into functional macrophages expressing ZsGreen: A tool for the study and in vivo tracking of therapeutic cells. Philosophical Transactions of the Royal Society B: Biological Sciences. 373 (1750), 20170219(2018).
- Lopez-Yrigoyen, M., et al. Production and characterization of human macrophages from pluripotent stem cells. Journal of Visualized Experiments. 2020 (158), (2020).
- Fidanza, A., et al. Single cell analyses and machine learning define hematopoietic progenitor and HSC-like cells derived from human PSCs. Blood. 136 (25), 2893-2904 (2020).
- Schindelin, J., et al. Fiji: an open-source platform for biological-image analysis. Nature Methods. 9 (7), 676-682 (2012).
- Takahashi, K., et al. Induction of pluripotent stem cells from adult human fibroblasts by defined factors. Cell. 131 (5), 861-872 (2007).
- North, T. E., et al. Hematopoietic stem cell development is dependent on blood flow. Cell. 137 (4), 736-748 (2009).
- Nguyen, J., Lin, Y. Y., Gerecht, S. The next generation of endothelial differentiation: Tissue-specific ECs. Cell Stem Cell. 28 (7), 1188-1204 (2021).
- Petazzi, P., et al. Arterial cells support the development of human hematopoietic progenitors in vitro via secretion of IGFBP2. bioRxiv. , (2022).
- Crosse, E. I., et al. Multi-layered spatial transcriptomics identify secretory factors promoting human hematopoietic stem cell development. Cell Stem Cell. 27 (5), 822(2020).
- Calvanese, V., et al. Mapping human haematopoietic stem cells from haemogenic endothelium to birth. Nature. 604 (7906), 534-540 (2022).
- Zeng, Y., et al. Tracing the first hematopoietic stem cell generation in human embryo by single-cell RNA sequencing. Cell Research. 29 (11), 881-894 (2019).
- Hwa, J. J., et al. Abnormal arterial-venous fusions and fate specification in mouse embryos lacking blood flow. Scientific Reports. 7 (1), 11965(2017).
Reprints and Permissions
