The retina exhibits complex spatial organization across its laminar structure. Modern spatial transcriptomics and sequencing techniques require tissue sections < 20 µm thick, limiting their retinal research applicability. This fresh-frozen cryosectioning method produces thin en face sections of mouse retina while preserving planar spatial relationships, enabling comprehensive molecular mapping across laminae.
Method Article
En face Cryosectioning of Mouse Retina for High-dimensional Spatial Molecular Analysis
In This Article
Summary
Abstract
The complex laminar structure of the retina presents significant challenges for comprehensive spatial molecular mapping. Current techniques for investigating tissue architecture and molecular interactions are limited by technical constraints that compromise spatial relationships or restrict molecular profiling. Existing methods like cross-sectioning, whole mount preparations, chemical or mechanical dissociations, and thick en face sections either disrupt tissue integrity, lose critical spatial context, or most often, are simply incompatible with high-dimensional spatial sequencing platforms.
This study introduces a cryosectioning technique that produces thin (<20 µm) en face sections while preserving the spatial relationships essential for mapping retinal cell distributions. The method maintains RNA integrity and tissue architecture while generating sections compatible with high-throughput molecular analysis platforms. RNA integrity is maintained because this technique sections fresh frozen tissue, which manufacturers of spatial transcriptomic platforms officially support relative to postfixed tissue. We validate this approach using multiple molecular profiling methods, demonstrating successful integration with both manual RNAscope in situ hybridization (12 targets) and Xenium spatial sequencing (300 targets). The technique consistently preserves tissue architecture across samples while maintaining RNA quality suitable for these sensitive molecular applications.
This methodological advancement enables new investigations into retinal cell type distributions, molecular gradients across laminae, and spatial aspects of retinal pathology. The technique's versatility and compatibility with modern spatial biology platforms provide a foundation for comprehensive molecular mapping of the retina's complex cellular organization.
Introduction
Retinal neurons have evolved spatial topographies that facilitate information processing, which in many species, results in gross specializations like foveas, area centralis, and streaks1,2,3. In contrast to the well-understood diversity of photoreceptor distribution, spatial specialization of retinal output, formed by Retinal Ganglion Cells (RGCs), is less clear. For most species, the RGCs' spatial distributions are entirely unknown. Even for the mouse, arguably one if not the best-studied vertebrate model of visual function, less than a third of RGC subtypes have been mapped with traditional techniques like whole mount immunohistochemistry2. These techniques fail because most RGC subtypes do not have a specific genetic marker. Instead, higher-dimensional molecular information is needed for accurate RGC classification4 via single-cell RNA sequencing5,6,7.
Information about RGC distribution is important, as the topographies observed in the mouse demonstrate clear ecological correlates between RGC placement and visual function. The most striking example is the spatial organization of the ɑON-S RGCs, which cluster in the temporal retina. This region receives the image of the prey8 during hunting behaviors9. It is also well appreciated that RGC subtypes are differentially susceptible to disease10, and some common diseases like glaucoma have a spatial component to their progression11,12. Thus, an important question facing the field is: what is the spatial organization of RGC subtypes as they tile the retina1? This gap in knowledge is currently limiting insights into other visually guided behaviors and diseases.
The focus of the present method is to address these molecular knowledge gaps through an en face cryosectioning approach that preserves spatial relationships while enabling high-resolution molecular analysis. Modern spatial sequencing platforms like 10X's Xenium represent a transformative advancement in molecular profiling, offering unprecedented insights into tissue organization and cellular interactions. However, these platforms, along with lower-plex techniques like RNAscope and spatially barcoded sequencing methods like Visium, share a critical technical constraint: they require tissue sections thinner than 20 µm. This requirement presents a particular challenge for retinal tissue, which typically measures 200 µm in thickness.
To date, researchers have primarily relied on cross sections when applying these technologies to retinal tissue13. While cross sections effectively reveal molecular relationships within nuclear and plexiform layers in the context of vertical circuits, they are less suited to capturing the broader spatial distributions of retinal cells that whole mount preparations have traditionally revealed8. Recent attempts at en face sectioning have been limited by section thickness constraints, with studies achieving only 50 µm sections14-too thick for modern high-plex molecular analysis platforms. Other historical approaches that have been deployed to study individual retinal lamina but are not compatible with modern spatial sequencing techniques include enzymatic digestion, combined with mechanical dissociation15,16, or mechanical dissociations alone17,18,19,20. Here, we present a novel cryosectioning technique specifically designed for thin, curved retinal tissue that overcomes these limitations. Briefly, our method involves extracting the posterior chamber of the eye, creating relief cuts through both the retina and sclera, flattening the tissue with inner retina against a coverglass, embedding the tissue in OCT, and finally, cryosectioning from outer to inner retina (Figure 1). Our method maintains spatial relationships while producing sections thin enough (<20 µm) for high-dimensional spatial biology tools, as validated through successful implementation with both manual RNAscope (12 targets) and the automated Xenium platform (300 targets), demonstrating compatibility across different complexity scales of molecular analysis.
Protocol
All experiments were conducted in accordance and with approval from the Institutional Animal Care and Use Committee (IACUC) and relevant institutional guidelines approving these methods overseen by the University of Colorado. All steps related to animal use and euthanasia must follow local regulations and experimental permits. All mice were housed with standard care in an accredited veterinary facility with free access to food and water. This en face cryosectioning technique builds on standard retinal dissection techniques optimized for C57BL/6 mice. To develop this technique approximately 150 mice of both sex ranging in age from 6 weeks to 2 years of age were used. The final technique communicated here has a success rate of approximately 95% regardless of mouse demographic characteristics. Note that if a temperature is not listed for a step, room temperature of approximately 20-25 °C is anticipated. Solutions without temperature listed will function if chilled and thus the working temperature range for solutions is 4-25 °C.
1. Dissection
- Anesthetize the mouse with isoflurane and validate anesthesia with toe pinch, or follow local rules and regulations to induce and confirm anesthesia as other methods are equally appropriate.
- Euthanize the mouse by cervical dislocation: secure the mouse's head with one hand and the base of the tail with the other, then pull in opposite directions. Perform secondary euthanasia by decapitation.
- Brand the temporal pole of the globe on the cornea to maintain orientation and create a weak point for dissection (Figure 2B and Figure 3A).
- Submerge the globe in Ames solution in a dish containing a piece of filter paper (larger than the globe but smaller than the dish).
NOTE: Use of solutions other than Ames will result in retinal deterioration (Figure 4A). - Using sharp #5 forceps and iris scissors, carefully remove all musculature, fascia, vasculature, and nerves from the globe (Figure 2E,F and Figure 3B) without puncturing the sclera (Figure 2D).
NOTE: Puncturing the sclera during this step (Figure 4B) will result in tissue herniation (Figure 4C). - Position the tip of one iris scissor blade perpendicular to the corneal brand, with scissors parallel to the optic nerve head. Puncture the globe at this position (Figure 3C,D).
- Make a single clean incision through the cornea and limbus, continuing into the sclera and retina toward the optic nerve head (Figure 3E).
NOTE: Do not cut through the optic nerve head or the sclera and retina will separate. The exact length of this incision will vary depending on the size of the globe, which can vary dramatically between old vs young animals, as well as in some Cre lines relative to wild type animals. We recommend leaving roughly 1 mm of tissue between the deepest extent of this incision and the optic nerve head. - Position the blade perpendicular to the initial cut (Figure 3F,G), approximately 1 mm posterior to the limbus (Figure 2C). Begin cutting radially through the sclera and retina.
- Maintain a consistent cutting line posterior and parallel to the limbus by using sharp forceps to guide and rotate the globe. While minimizing cuts is ideal, prioritize maintaining a clean radial path. If retina and sclera separate, reposition the iris scissor blade to cut them together.
NOTE: Cutting into the limbus may cause retinal separation from the sclera during lens extraction. Small snips and rotations are acceptable. Avoid applying force to secure it, as this risks retinal herniation. - Estimate the 1 mm posterior distance using the middle width of the iris scissor blade. When uncertain, err toward a more posterior position, as the retina's connection to the limbus curves internally. A more posterior cut facilitates flat retinal extraction.
- Maintain a consistent cutting line posterior and parallel to the limbus by using sharp forceps to guide and rotate the globe. While minimizing cuts is ideal, prioritize maintaining a clean radial path. If retina and sclera separate, reposition the iris scissor blade to cut them together.
- After completing the radial cut parallel to the limbus, inspect for remaining retinal connections. Carefully sever these with iris scissors until the anterior and posterior globe sections are separate.
- Using two pairs of sharp #5 forceps, gently separate the anterior and posterior portions of the globe (Figure 3H). In older mice, transparent fibers may connect the lens to the retinal cup; carefully sever these with iris scissors while minimizing retinal-scleral separation.
NOTE: The lens should remain attached to the limbus and cornea. - Using the filter paper as a support platform, cut the retina into a clover leaf (also known as iron cross) pattern with iris scissors (Figure 3I-K).
NOTE: Clover leaf incisions should be shorter than the primary orienting incision initially made through the limbus if recording orientation with this slice is desired. We recommend reducing the size of these three new radial incisions to be roughly 1-2 mm shorter than the primary incision. If a different feature, like the opsin gradient, will be used for orientation, it is appropriate for all incisions to be the same length while always retaining approximately 1 mm of tissue between the deepest part of the incision and optic nerve head to prevent separation fo the retina and sclera. - Repeat the dissection with the second eye. To minimize necrosis, complete anterior chamber removal of the second eye within 10 min of euthanasia.
2. Cryopreservation
- Prepare a disposable transfer plastic pipette by cutting the tip to create an opening larger than the dissected retina and sclera (hereafter referred to as the retina).
- Gently suction the retina into the pipette and deposit it onto a glass microscope slide. Using a laboratory wipe, carefully remove excess Ames solution around the retina until it can no longer float freely and can be flattened.
- Using two sharp #5 forceps, unfold the retina and position it flat with the inner eye cup facing upward. Depending on the size of the tissue, make 0.5-2 mm relief cuts in each cloverleaf segment to further flatten the retina, carefully adjusting the tissue to prevent folding (Figure 5A). Remove additional Ames solution until liquid remains only adjacent to the retina.
- Using a coverslip, quickly press and transfer the retina (Figure 5B) with its surrounding liquid so that the outer sclera faces upward and the inner eye cup contacts the coverslip, that is, the retinal ganglion cells will face up (Figure 5C).
- Verify the retina is not folded and make adjustments as needed; add Ames solution for easier manipulation. As excess liquid will cause the tissue to curl, use a laboratory wipe to remove all excess Ames solution and allow the retina to air dry for 5-10 s.
NOTE: Failure to allow a brief air drying may randomly result in tissue-OCT separation during cryosectioning. Excessive air drying may lead to salt crystal-related tissue damage. - Apply OCT medium to cover the retina and use forceps to spread this layer evenly across the coverslip, preventing retinal flotation. Allow 30 s for OCT medium to penetrate the retina.
- Flash-freeze the retina in OCT (Figure 5D) using either a metal plate indirectly cooled with liquid nitrogen vapor or by bringing it in direct contact with dry ice.
- Store the retinas on dry ice if using immediately or in a -80 °C freezer in a plastic bag or container containing desiccants if storing it for the long term.
3. Cryosectioning
- Set the cryostat chamber to -18 °C and stage to -12 °C. Place the retina in the chamber to equilibrate to temperature.
- Create an OCT dome on the specimen chuck. If using the same model cryostat, ensure that this dome occupies the inner 2-3 annuli. Once frozen, trim the OCT dome to create a flat stage surface parallel to the blade on the chuck to retain laminar flatness (Figure 6A).
- Create or note the orientation guide relating the chuck to the cryostat stage.
NOTE: On the model cryostat we recommend, the orientation guide is a central line etched into the 12 o'clock position above the chuck holder, while the chuck itself has a triangular cut out on the outermost annuli. Together, we refer to these features as the orientation guide. If your cryostat does not have such features, we recommend using a permanent marker to make your own. - Prepare the retina for transfer using a razor blade by removing excess OCT surrounding the retina laterally and then, carefully separating the retina from the coverslip to make it mobile.
- Remove the chuck from the stage and apply a small drop of liquid OCT to the prepared flat OCT stage surface.
- Place the retina directly onto the liquid OCT. Using a prechilled (-18 °C) glass slide, press and hold the retina against the OCT stage for 10-30 s until frozen.
- Apply additional OCT over the retina and stage to ensure complete bonding. Freeze on the cryostat's rapid freezing area. Incubate the retina/OCT stage in the cryostat for minimum 30 min to ensure complete bonding.
- Begin sectioning:
- Carefully trim excess OCT until the retina becomes visible (Figure 6B). Use the razor blade to remove excess OCT from block edges.
NOTE: Always retract the stage before resuming sectioning after any manual, radial trimming. For trimming slices en face, we recommend using the same cut thickness as will be used for desired sections; however, trimming thickness may be between 10 µm and 100 µm based on user preference. - Continue trimming while inspecting sections for the presence of sclera. When the sclera is visible, adjust the stage angle as needed. Continue trimming until sections show equal sclera distribution, which ensures optimal flatness and maximum cloverleaf area in each section.
- Collect tissue sections (Figure 6C).
NOTE: Optimal thickness will depend on the final assay being performed and must adhere to this downstream protocol. For example, if 10X Xenium is employed we recommend 20 µm-thick sections. Whereas for 10X Visium, 15 µm-thick sections are more appropriate. - Use prechilled slides and manipulate the sections into position using two paintbrushes.
- Place a finger under the section until the OCT melts and tissue adheres (approximately 5 s).
- Return the slide to a cold surface for tissue re-freezing.
NOTE: When collecting sections in small areas (e.g., for Xenium), multiple freeze-thaw cycles may be necessary. While this does not affect probe-based techniques, it may impact RNA quality for unbiased sequencing approaches.
- Carefully trim excess OCT until the retina becomes visible (Figure 6B). Use the razor blade to remove excess OCT from block edges.
- Store the slides on dry ice for immediate use, at -20 °C for RNAscope the following day and at -80 °C for long-term storage.
4. Target detection and microscopy
NOTE: While the technique is compatible with other molecular profiling methods, we detail RNAscope as one validated example.
- Sample preparation:
- Remove the slides from -80 °C storage and warm at -20 °C for 1 h.
NOTE: Slides can be stored at -20 °C for up to 12 h prior to beginning the rest of this procedure but should not be left at -20 °C for too long to minimize RNA degradation.
- Remove the slides from -80 °C storage and warm at -20 °C for 1 h.
- Quickly heat the slides at 37 °C for 10 s.
- Fix the tissue by immersing the slides in fresh 4% PFA for 30 min at room temperature.
- Wash the slides thoroughly with 1x PBS.
- Tissue dehydration through ethanol series: 50% ethanol for 5 min, 70% ethanol for 5 min, 100% ethanol for 5 min, fresh 100% ethanol for 5 min.
NOTE: This is a critical quality control step for tissue mounting. If tissue detachment occurs during dehydration, it indicates OCT overlap from adjacent sections during mounting. Careful trimming of excess OCT during sectioning and mounting prevents this issue. - Barrier preparation:
- Air dry the slides on the benchtop for 5 min at room temperature.
- Using a hydrophobic barrier pen, draw a barrier around each tissue section. Allow the barrier to dry completely for 5 min at room temperature.
- Molecular detection:
- Apply Protease IV treatment for tissue permeabilization.
- Proceed with the manufacturer's protocol for target probe hybridization (2 h at 40 °C), signal amplification steps (three sequential amplifiers), fluorophore detection (four sequential rounds for three-plex staining).
- Imaging:
- Perform DAPI nuclear counterstaining prior to each cover glass mounting.
- Mount the coverglass using antifade mounting medium.
- Image using fluorescence microscopy with appropriate filter sets.
- For multiplex detection, capture the same field across all four rounds of detection for computational registration.
- Maintain consistent exposure settings between rounds for accurate signal comparison.
NOTE: For complete details on RNAscope implementation, refer to manufacturer protocols (see the Table of Materials). For fully automated platforms like Xenium, follow all manufacturer protocol steps exactly as provided. For all protocols, anticipate that failure due to tissue detachment will most likely occur during an early dehydration or washing step, because of OCT overlap, as noted in this exemplar protocol.
Results
Successful implementation of this protocol produces intact en face retinal sections suitable for multiple molecular profiling approaches while maintaining spatial relationships across the retinal surface. We demonstrate the protocol's utility through a systematic validation approach, progressing from conventional immunohistochemistry through manual multiplex RNA detection to automated high-throughput molecular profiling.
The initial validation of our protocol employs two well-characterized markers to assess tissue integrity and structural preservation across all retinal laminae (Figure 7). Retinal ganglion cells are labeled with anti-RBPMS immunostaining, while the vasculature network is visualized using Tomato Lectin. This combination provides immediate feedback on protocol success, as both markers have distinct, well-documented distribution patterns in the healthy retina.
In properly prepared tissue, RBPMS immunoreactivity appears as discrete cellular labeling in the ganglion cell layer, with signals distributed across the entire retinal surface. The three vascular plexi, labeled by Tomato Lectin, should be clearly distinguishable when sectioning through different depths, with the superficial plexus appearing in the nerve fiber layer, intermediate plexus in the inner plexiform layer, and deep plexus in the outer plexiform layer. Importantly, the maintenance of these distinct patterns confirms that the protocol preserves both protein antigenicity and the delicate three-dimensional architecture of the retinal vasculature, despite the mechanical stresses of sectioning.
Building on the validation of tissue integrity, we demonstrate the protocol's compatibility with multiplex RNA detection using a carefully selected 12-plex RNAscope panel (Figure 8). This panel includes markers for multiple retinal cell types combining the previously validated protein markers (RBPMS, now detected as well via RNA) with additional cell-type specific transcripts. Figure 8A provides a comprehensive view of a single en face slice through the cloverleaf preparation at low magnification, demonstrating maintenance of gross retinal architecture and distinct labeling patterns, including the bipolar cell transcript marker Grm6. Single-cell magnification views in Figure 8B reveal the distinct spatial patterns of individual transcripts and RBPMS (ganglion cell-specific antibody); the cell-type specific markers were identified from single-cell transcriptomics atlases using the GraSP method4.
The consistency between RBPMS protein and RNA detection serves as an internal control, while the preservation of Tomato Lectin labeling through multiple rounds of RNA detection chemistry demonstrates the robustness of tissue adhesion and structural maintenance. The protocol's success is evidenced by the clear discrimination of nuclear and cytoplasmic signals, maintenance of tissue integrity through multiple rounds of detection, consistent signal strength across all probe sets, spatial registration of signals between rounds, and correlation of expression patterns with known cell-type distributions.
The protocol's compatibility with automated platforms is demonstrated through Xenium implementation using a 300-probe panel (Figure 9 and Figure 10). Figure 9A shows consistent signal distribution across multiple cloverleaf sections, indicating uniform tissue quality and RNA preservation. The high-dimensional nature of this dataset allows simultaneous visualization of the same 12 markers used in the manual RNAscope experiment (Figure 8) are identified within this larger dataset and shown at single-cell resolution in Figure 9B, providing direct cross-validation between platforms. Finally, Figure 10 uses 14 laminar and cell class markers to demonstrate relative to a retinal cross section (Figure 10A) the approximate, average location of representative sections (Figure 10B). Finally, zooming in on the ganglion cell layer in an en face section demonstrates relative to DAPI in grey what one should expect this method to yield (Figure 10C).
Regardless of the molecular profiling method used, it is important to note that very rare cell types or those with low transcript abundance may fall below detection thresholds-a limitation inherent to current spatial transcriptomic technologies rather than the tissue preparation method itself.
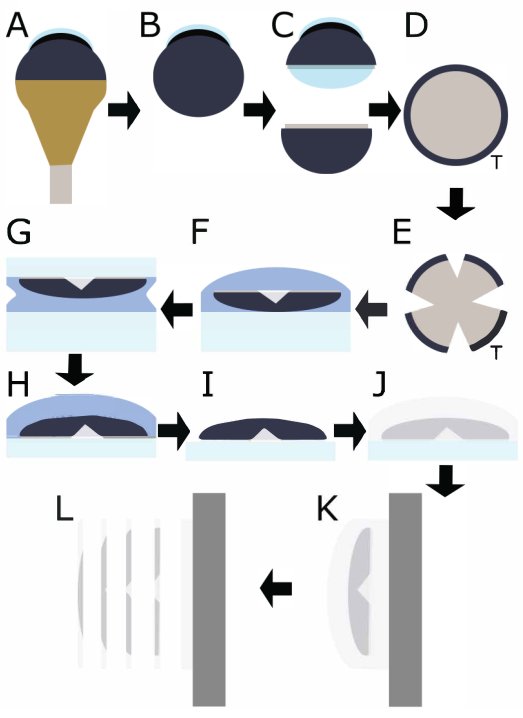
Figure 1: Schematic illustration of major steps from a side view. (A) The intact, extracted globe. (B) Muscle, fascia, and optic nerve removed. (C) Anterior and posterior chambers separated with the lens attached to the anterior chamber vis the limbus. (D) Top view of the posterior chamber looking into the retina. (E) Top view of the posterior chamber after relief cuts are made. (F) Posterior chamber with retinal ganglion cell layer facing upward and the eyecup supported by a glass slide in Ames solution. (G) Transfer via capillary action of the tissue to a coverglass with the ganglion cell layer now facing this solid support. (H) Flipping the tissue so the coverglass is now on the table. (I) Ames solution is removed and the tissue air-dried for 5-10 s. (J) Tissue is embedded and frozen in OCT. (K) Tissue mounted on a flat support of OCT attached to the chuck. (L) En face sections are created. Please click here to view a larger version of this figure.
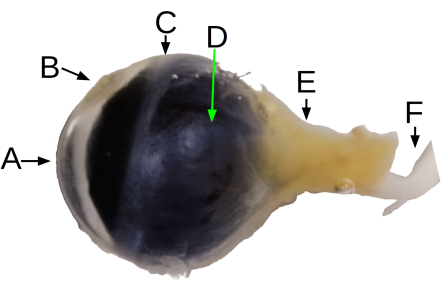
Figure 2: Diagram of mouse eye anatomy. (A) Anterior chamber, externally bounded by the cornea; (B) temporal pole burn mark; (C) limbus; (D) posterior chamber, externally bounded by the blue sclera; (E) musculature; (F) optic nerve. Please click here to view a larger version of this figure.
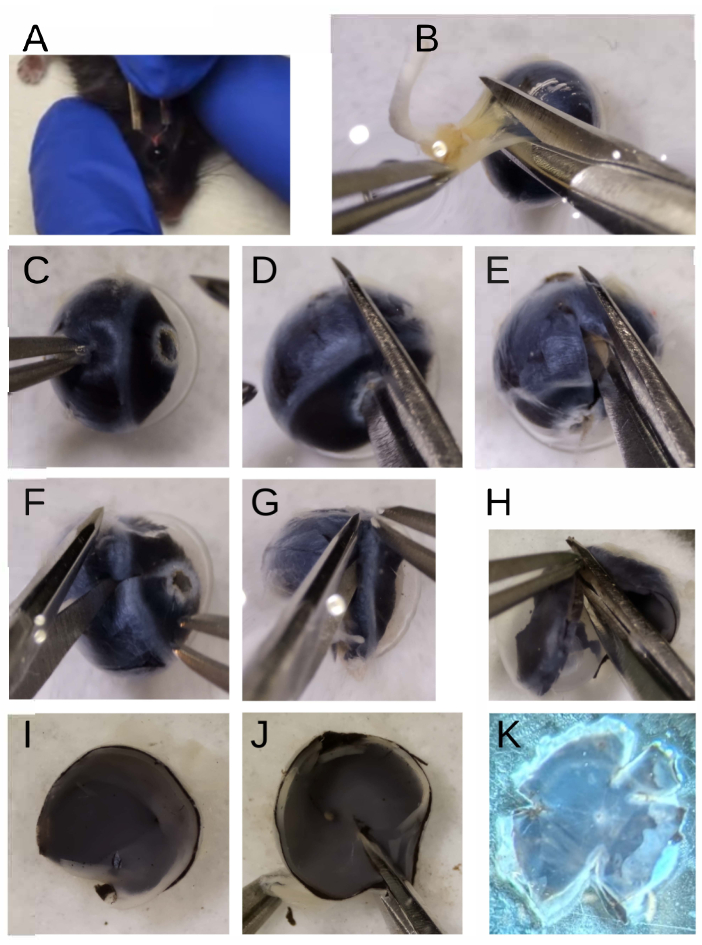
Figure 3: Gross dissection. (A) Brand the temporal pole of the globe to maintain orientation. (B) Using iris scissors, remove the musculature and optic nerve from the globe. (C) Manipulate the globe with forceps without puncturing it. (D) Puncture the orientation brand with a single blade of the iris scissors. (E) Create a cut through the limbus through both sclera and retina toward the optic nerve head. (F) Begin cutting perpendicularly to the initial incision posterior to the limbus. (G) continue cutting roughly 1 mm posterior to the limbus all the way around the globe careful not to cut through the limbus. (H) The anterior chamber should separate with the lens attached. (I) Orient the eye cup with the retina facing up. (J) Create relief cuts with the original orienting cut being the largest. (K) The complete clover leaf with the retina facing up. Please click here to view a larger version of this figure.
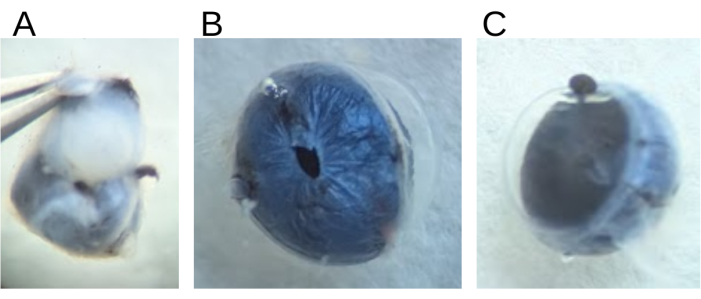
Figure 4: Common mistakes during tissue preparation. (A) Incorrect media resulting in retina degradation. (B) Slicing of sclera during musculature removal. (C) Herniation of tissue with excessive force on the globe (often through small slices as in B. Please click here to view a larger version of this figure.
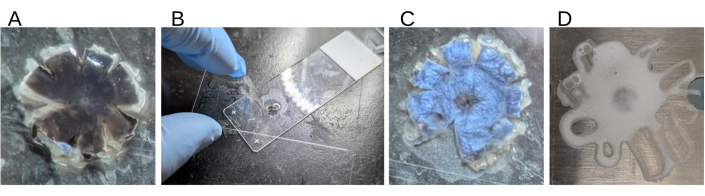
Figure 5: Cryopreservation. (A) Secondary relief cuts. (B) Retina flipping by pressing coverglass against tissue. (C) Retina flipped with sclera facing up. (D) OCT embedded, frozen retina. Please click here to view a larger version of this figure.
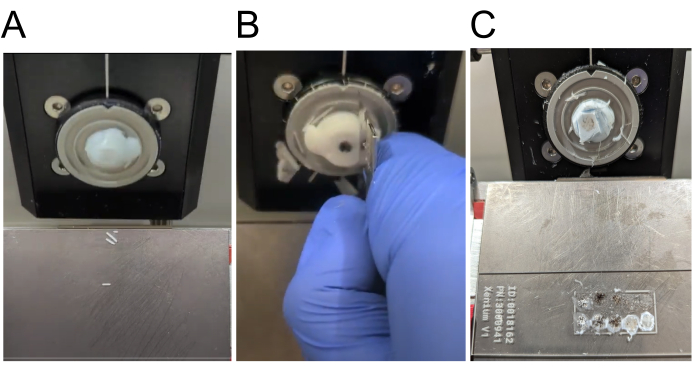
Figure 6: Cryosectioning. (A) OCT stage cut flat. (B) Trimming of excess OCT. (C) Retina slices melted onto a Xenium slide. Please click here to view a larger version of this figure.
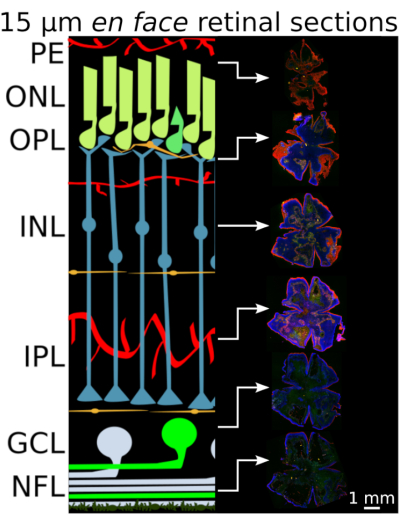
Figure 7: Representative en face slices from a single retina aligned with a cartoon diagram of a retinal cross section indicating relative position. Sections stained with DAPI in blue, tomato lectin in red, and RBPMS antibody in green. Scale bar = 1 mm. Abbreviations: RBPMS = RNA-binding protein with multiple splicing; DAPI = 4',6-diamidino-2-phenylindole; PE = pigment epithelium; ONL = outer nuclear layer; OPL = outer plexiform layer; INL = inner nuclear layer; IPL = inner plexiform layer; GCL = Ganglion cell layer; NFL = nerve fiber layer. Please click here to view a larger version of this figure.
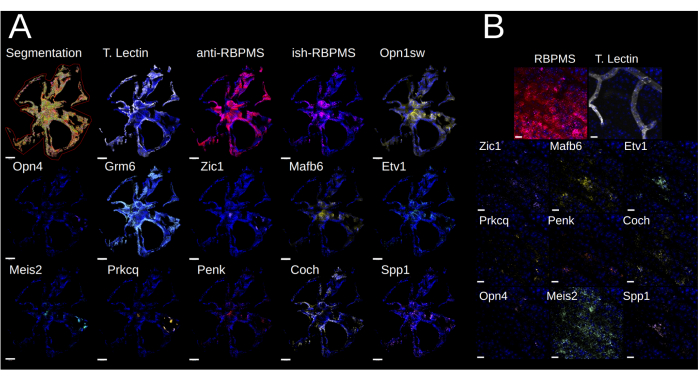
Figure 8: Representative staining with RNAscope. (A) A single slice showing DAPI in blue and the respective probe listed above; scale bar = 0.5 mm. (B) Zoomed-in view of the same probes, with RBPMS antibody shown in red overlaid with Rbpms in situ hybridization probe in magenta; scale bar = 20 µm. Abbreviations: RBPMS = RNA-binding protein with multiple splicing; DAPI = 4',6-diamidino-2-phenylindole. Please click here to view a larger version of this figure.
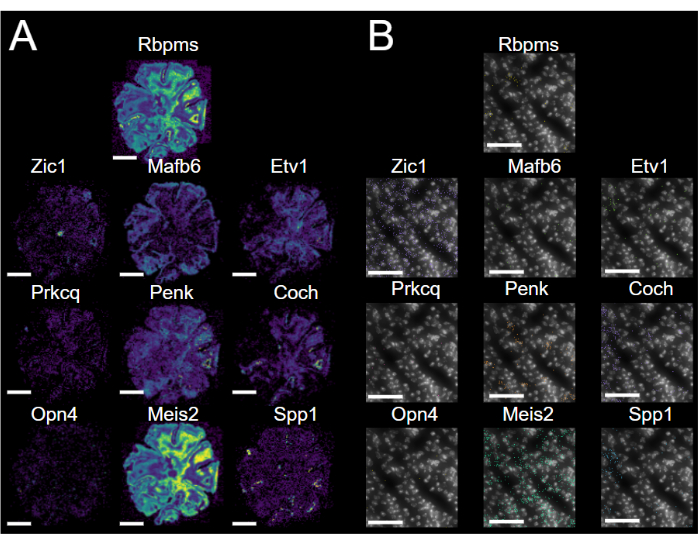
Figure 9: Representative Xenium puncta quantification. (A) View of a single en face slice with the respective probes out of the total 300 gene custom panel shown; color map in arbitrary units normalized to the respective target, with blue indicating low concentration and yellow indicating high concentration. Scale bar = 1 mm. (B) Single-cell resolution of probes; scale bar = 50 µm with probe target locations indicated by scatter point position. Please click here to view a larger version of this figure.
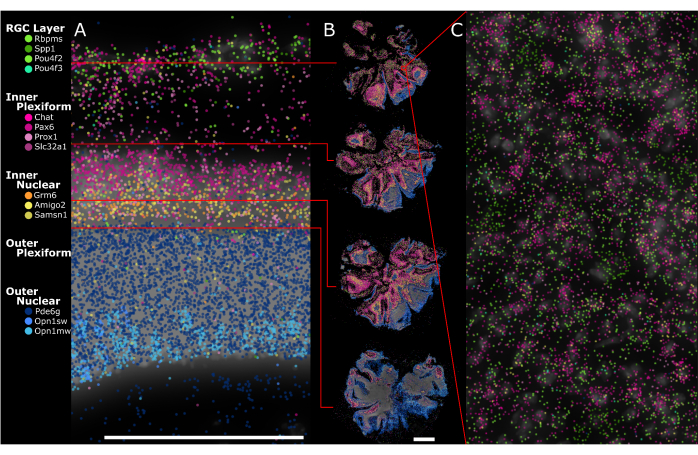
Figure 10: Approximate location of en face sections relative to a cross section measured by 10X Xenium. (A) Cross section of retina with laminar markers and red lines indicating the approximate average depth of the (B) en face sections. (C) Zoomed-in region of an en face section at the same scale as A showing retinal ganglion cells in shades of green relative to displaced amacrine cells in shades of magenta. Scale bars = 1 mm. Please click here to view a larger version of this figure.
Discussion
The method presented here addresses a critical technical barrier in retinal spatial biology by enabling the production of thin en face sections suitable for modern molecular profiling technologies. The most critical steps in the protocol center around tissue handling during the initial dissection and the precise control of temperature and hydration during cryopreservation and sectioning. Successful implementation relies particularly on achieving proper tissue flattening before OCT embedding and maintaining consistent temperature control throughout the sectioning process.
Common technical artifacts and troubleshooting:
Several technical challenges may arise during protocol implementation, each with distinct causes and solutions:
Tissue detachment: The most common technical failure occurs during dehydration steps when tissue detaches from the slide. This typically results from OCT overlap between adjacent sections during mounting. During the mounting step, careful attention must be paid to trimming excess OCT from each section before placing subsequent sections. When this artifact occurs, it is usually evident during the ethanol dehydration series, providing an early indicator of mounting quality.
Tissue cracking and deterioration: Another frequent artifact presents as tissue fragmentation during sectioning. This stems from temperature mismatches between different cryostats. While our protocol recommends -18 °C for the chamber and -12 °C for the stage, these settings should be considered starting points. Optimal temperatures can vary between cryostat models and should be empirically determined. If cracking occurs, systematically test temperature combinations around these baseline values.
Laminar Voids: Due to the retina's natural curvature, sections will inevitably show regions where the cutting plane transitions between layers, resulting in apparent "holes" in the tissue. These voids are an inherent consequence of creating planar sections from curved tissue and should not be interpreted as technical failures.
Section fragmentation during collection: Poor section quality can result from inadequate tissue-OCT bonding. This can be prevented through attention to several critical steps. The retina should be relatively dry before initial OCT application. The OCT should be equilibrated to working temperature before use. Adequate time should be given for bonding when mounting the retina to the OCT stage. A constant temperature should be maintained throughout the sectioning process.
Apparent tearing of the RGC layer: It may appear that the RGC layer tears immediately after sectioning and before mounting. This is possibly because the RGC layer has a different moisture content than the deeper lamina and is an unavoidable artifact. However, with careful handling when the tissue is placed on the glass slide and heat is applied, these regions will fall back into their natural position and the tear will not be visible after tissue processing.
Successful implementation is indicated by continuous tissue sections maintaining nuclear organization (DAPI), consistent RNA detection across probe sets, and preserved spatial relationships across the retinal surface. When these quality metrics are achieved, the sections are suitable for both manual and automated molecular profiling techniques.
A key technical innovation of this protocol is the preservation of RNA integrity while maintaining spatial relationships across retinal laminae. This is achieved through rapid tissue processing and careful temperature management during sectioning. The protocol's compatibility with both manual RNAscope (12-plex) and automated Xenium (300-plex) platforms demonstrates its versatility for different experimental approaches. While previous methods have been limited to either cross-sections13 or thick en face sections14, our approach uniquely enables high-dimensional molecular analysis while preserving planar spatial relationships.
The protocol has been validated across multiple experimental contexts, including wild-type21 and transgenic mouse lines (Vglut3-Cre, OPN4-Cre) commonly used in retinal research, unpublished. Importantly, it is also compatible with disease models that maintain basic retinal architecture, as demonstrated with optic nerve crush preparations, unpublished. However, the method does have limitations. Disease models that significantly alter retinal lamination may require protocol modifications, particularly in the tissue flattening and mounting steps. Additionally, we have not yet validated the protocol for developing retinas, where tissue properties may differ substantially from adult tissue.
Several aspects of the protocol can be modified to accommodate different experimental needs. Temperature parameters (-18 °C/-12 °C for chamber/stage) serve as starting points but may need adjustment based on specific cryostat models. Similarly, the desired sections will be experiment dependent. For example, in our recent work mapping all retinal ganglion cells, we save and measure all retinal sections21, whereas in unpublished work studying a gene therapy to treat optic nerve crush, we measure only the final tissue slice in the block. The protocol's modular nature allows for integration with various molecular profiling techniques beyond those demonstrated here. When technical issues arise, they typically manifest in predictable ways: tissue detachment during dehydration indicates problems with OCT overlap during mounting, while section fragmentation suggests suboptimal temperature control or insufficient bonding time.
The significance of this method lies in its ability to bridge the gap between traditional retinal anatomy studies and modern molecular profiling technologies. By enabling en face sections of fresh-frozen tissue, which are compatible with spatial transcriptomics platforms, it opens new possibilities for investigating fundamental questions in retinal biology, such as the spatial distribution of cell types4 and molecular gradients across the retinal surface. This approach is particularly valuable for studying phenomena with inherent spatial components, such as the topographic organization of RGC subtypes and the progression of retinal diseases like glaucoma11.
Looking forward, this protocol provides a foundation for comprehensive molecular mapping of retinal organization. Its compatibility with both targeted approaches (RNAscope) and unbiased profiling methods (Xenium) makes it particularly valuable for hypothesis-driven and discovery-based research. Future applications might include mapping developmental gradients, characterizing disease progression patterns, and investigating cell-type-specific responses to therapeutic interventions. The method's ability to preserve spatial relationships while enabling high-dimensional molecular analysis represents a significant advance for the field of retinal neurobiology.
Disclosures
The authors have no conflicts of interest to disclose.
Acknowledgements
We thank the Human Immune Monitoring Shared Resource (RRID:SCR_021985) within the University of Colorado Cancer Center (P30CA046934) for their expert assistance in operating the 10X Xenium platform. This work was supported by the National Institutes of Health (R01EY035293).
Materials
| Name | Company | Catalog Number | Comments |
|---|---|---|---|
| Ames′ Medium | Sigma-Aldrich | A1420-10X1L | Specific brand not important |
| Beadsmith Thread Zap, Thread Burner | The Beadsmith Store | 7.90524E+11 | Alternative cauterizers may be used |
| Cryostat | Leica | cm1950 | Important considerations is seperately controllable volume vs stage temperature. |
| Dry Ice | NA | NA | NA |
| Fine Science Tools Dumont #5 Forceps | Fine Science Tools 1129500 | NC9889584 | Specific brand not important |
| Fisher Healthcare Tissue-Plus O.C.T. Compound | Fisher Scientific | 23-730-571 | Specific brand not important |
| Fisherbrand High Precision Straight Slender Fine Point Tweezers/Forceps | Fisher Scientific | 12-000-127 | Specific brand not important |
| Fisherbrand Standard Dissecting Scissors | Fisher Scientific | 08-951-20 | Specific brand not important |
| Fisherbrand Superfrost Plus Microscope Slides | Fisher Scientific | 22-037-246 | Specific brand not important |
| Integra Miltex Noyes Iris Scissors | Integra Miltex 181510 | 12-460-278 | Specific brand not important |
| Olympus IX81 spinning disk epifluorescence microscope | For Figure 7 | ||
| RNAscope HiPlex | ACDBio | ||
| Rectangular Cover Glasses | Fisher Scientific | 12-541-033 | Specific brand not important |
| Sodium bicarbonate | Sigma-Aldrich | S6014-25G | Specific brand not important |
| Thermo Scientific Nunc Glass Bottom Dishes | Fisher Scientific | 12-567-400 | Specific brand not important |
| World Precision Instrument Precision Stereo Zoom Trinocular Microscope (IV) on Boom Stand | World Precision Instrument PZMTIVBS | 50-253-8607 | Specific brand not important |
| Zeiss Axio Imager.M2 epifluorescence microscope | Optical sectioning enabled (for Figure 8) |
References
- Baden, T., Euler, T., Berens, P. Understanding the retinal basis of vision across species. Nat Rev Neurosci. 21 (1), 5-20 (2020).
- Heukamp, A. S., Warwick, R. A., Rivlin-Etzion, M. Topographic variations in retinal encoding of visual space. Annu Rev Vis Sci. 6, 237-259 (2020).
- Collin, S. P. A web-based archive for topographic maps of retinal cell distribution in vertebrates. Clin Exp Optom. 91 (1), 85-95 (2008).
- Budoff, S. A., Poleg-Polsky, A. GraSP gene targets to hierarchically infer sub-classes with CuttleNet. bioRxiv. , (2024).
- Rheaume, B. A., et al. Single cell transcriptome profiling of retinal ganglion cells identifies cellular subtypes. Nat Commun. 9 (1), 2759(2018).
- Tran, N. M., et al. Single-cell profiles of retinal ganglion cells differing in resilience to injury reveal neuroprotective genes. Neuron. 104 (6), 1039-1055.e12 (2019).
- Yan, W., et al. Mouse retinal cell atlas: Molecular identification of over sixty amacrine cell types. J Neurosci. 40 (27), 5177-5195 (2020).
- Bleckert, A., Schwartz, G. W., Turner, M. H., Rieke, F., Wong, R. O. L. Visual space is represented by nonmatching topographies of distinct mouse retinal ganglion cell types. Curr Biol. 24 (3), 310-315 (2014).
- Holmgren, C. D., et al. Visual pursuit behavior in mice maintains the pursued prey on the retinal region with least optic flow. eLife. 10, e70838(2021).
- Tapia, M. L., Nascimento-dos-Santos, G., Park, K. K. Subtype-specific survival and regeneration of retinal ganglion cells in response to injury. Front Cell Dev Biol. 10, 956279(2022).
- Berchuck, S. I., Mukherjee, S., Medeiros, F. A. Estimating rates of progression and predicting future visual fields in glaucoma using a deep variational autoencoder. Sci Rep. 9 (1), 18113(2019).
- de Gainza, A., et al. The trajectory of glaucoma progression in 2-dimensional structural-functional space. Ophthalmol Glaucoma. 3 (6), 466-474 (2020).
- Choi, J., et al. Spatial organization of the mouse retina at single cell resolution by MERFISH. Nat Commun. 14 (1), 4929(2023).
- Kremers, L., et al. Super-resolution STED imaging in the inner and outer whole-mount mouse retina. Front Ophthalmol. 3, 1126338(2023).
- Simon, P., Thanos, S. Combined methods of retrograde staining, layer-separation and viscoelastic cell stabilization to isolate retinal ganglion cells in adult rats. J Neurosci Methods. 83 (2), 113-124 (1998).
- Lindqvist, N., Vidal-Sanz, M., Hallböök, F. Single cell RT-PCR analysis of tyrosine kinase receptor expression in adult rat retinal ganglion cells isolated by retinal sandwiching. Brain Res Brain Res Protoc. 10 (2), 75-83 (2002).
- Fontaine, V., Kinkl, N., Sahel, J., Dreyfus, H., Hicks, D. Survival of purified rat photoreceptors in vitro is stimulated directly by fibroblast growth factor-2. J Neurosci. 18 (23), 9662-9672 (1998).
- Sandu, C., Hicks, D., Felder-Schmittbuhl, M. -P. Rat photoreceptor circadian oscillator strongly relies on lighting conditions: Molecular clock in rat photoreceptors. Eur J Neurosci. 34 (3), 507-516 (2011).
- Jaeger, C., et al. Circadian organization of the rodent retina involves strongly coupled, layer-specific oscillators. FASEB J. 29 (4), 1493-1504 (2015).
- Hecht, R. M., Shi, Q., Garrett, T. R., Sivyer, B., Morgans, C. Split retina as an improved flatmount preparation for studying inner nuclear layer neurons in vertebrate retina. J Vis Exp. (203), e65757(2024).
- Budoff, S. A., Poleg-Polsky, A. A Complete spatial map of mouse retinal ganglion cells reveals density and gene expression specializations. bioRxiv. , (2025).
Reprints and Permissions
