This study characterizes the multidimensional vHIT features of MD, SSHL-V, and VN, and explores the potential relationship between compensatory saccades and early high-frequency vestibular dysfunction, with age showing no confounding effect.
Method Article
Disease-Specific Patterns of Multidimensional Video Head Impulse Test Parameters in Peripheral Vestibular Disorders
* These authors contributed equally
In This Article
Summary
Abstract
Video Head Impulse Test (vHIT) multidimensional parameters—namely vestibulo‑ocular reflex (VOR) gain, gain asymmetry (GA), and compensatory saccades (CS)—are core indicators for assessing peripheral vestibular dysfunction. The combined use of vHIT and caloric testing facilitates differential diagnosis of various vertigo syndromes. In this retrospective study, 310 adult patients with unilateral peripheral vestibular disorders were enrolled, comprising 170 cases of Ménière’s disease (MD), 110 cases of sudden sensorineural hearing loss accompanied by vertigo (SSHL‑V), and 30 cases of vestibular neuritis (VN). All participants underwent vHIT and a caloric test within 72 hours of symptom onset, prior to any therapeutic intervention. Analysis of vHIT metrics revealed distinct impairment patterns across the three disorders. Ménière’s disease was primarily characterized by CS abnormalities in the lateral semicircular canal (SCC), with a low gain reduction rate. Sudden sensorineural hearing loss with vertigo presents multi-planar impairment affecting both the lateral and posterior SCCs. Vestibular neuritis displayed concurrent abnormalities in VOR gain and compensatory saccades in the lateral SCC. In patients with normal VOR gain, unilateral weakness (UW) values were significantly elevated in CS‑positive groups for most semicircular canals. Age-stratified analysis revealed that age did not exert a discernible confounding effect on VOR gain or CS. This study systematically delineates the distinct vHIT parameter profiles of three common peripheral vestibular disorders, explores the possible relationship between compensatory saccades and early high-frequency vestibular dysfunction, and examines their relationship with caloric test outcomes.
Introduction
Vertigo is a common and complex clinical symptom, with approximately 60% of cases resulting from peripheral vestibular disorders1. These disorders arise from pathological damage to the vestibular apparatus or vestibular nerve, leading to abnormal vestibulo-ocular reflex (VOR) function. Accurate assessment of vestibular function requires the combined use of the Video Head Impulse Test (vHIT) for evaluating high-frequency VOR function and the caloric test for evaluating low-frequency function.
Ménière's disease (MD), sudden sensorineural hearing loss with vertigo (SSHL-V), and vestibular neuritis (VN) are three common peripheral vestibular disorders with distinct underlying pathophysiologies. MD is primarily characterized by endolymphatic hydrops. It has been reported that patients with MD frequently exhibit normal vHIT gain values despite reduced responses on the caloric test2. However, it remains unclear whether changes in semicircular canal diameter due to endolymphatic hydrops affect the occurrence of compensatory saccades (CS) in vHIT. SSHL-V is primarily caused by inner-ear microcirculatory disturbance or viral infection, involving both the cochlea and the vestibular apparatus; however, the pattern and extent of semicircular canal involvement remain controversial3,4. VN results from selective inflammation of the vestibular nerve. Lee et al.5reported that 80.56% of VN patients had normal vHIT gain values, whereas Molnar et al.6observed synchronous abnormalities between vHIT and caloric test results. These pathophysiological differences may lead to distinct patterns of vHIT parameter abnormalities, yet systematic characterization of multidimensional vHIT profiles across these three disorders remains lacking.
The vHIT provides multiple parameters for evaluating semicircular canal function, including VOR gain (G), gain asymmetry (GA), and compensatory saccades (CS). VOR gain reflects the function of the direct vestibulo-ocular reflex arc, whereas CS represents a centrally mediated compensatory mechanism. However, most existing studies have relied on VOR gain as the sole evaluation metric, and patients with normal gain but abnormal saccades have often been excluded from the criteria used to determine abnormality. Furthermore, reports on the sensitivity and specificity of vHIT parameters vary considerably. A meta-analysis reported a sensitivity of 31%–36% and specificity of 83%–98%, while another study reported a sensitivity of 54%–90% and specificity of 46%–90%7,8. This variability may be closely related to the lack of standardization in the selection of assessment parameters and interpretation criteria. Regarding the normal range of VOR gain, different studies have proposed varying thresholds9,10,11,12,13. Nicolas et al. suggested >0.6, MacDougall et al. advocated >0.7, while Isaac and Alexander et al. proposed >0.8. These inconsistencies suggest that reliance on a single gain metric may be insufficient for a comprehensive assessment of vestibular function.
Therefore, the present study aimed to (1) explore the heterogeneous patterns of vHIT multidimensional parameters (G, GA, and CS) in three common peripheral vestibular disorders–MD, SSHL-V, and VN; (2) evaluate the relationship between CS status and caloric test results in patients with normal vHIT gain; and (3) assess the potential confounding effect of age on vHIT parameters. By systematically analyzing vHIT parameter patterns across these disorders, a reference framework was developed to interpret vHIT abnormalities in clinical practice and to identify the strengths of individual parameters in different diagnostic scenarios.
Protocol
The study was approved by the Ethics Review Board of Sun Yat-sen Memorial Hospital, Sun Yat-sen University (No. SYSKY-2025-572-01). Written informed consent was waived because of the retrospective nature of the study.
Patient selection
A total of 310 adult patients with unilateral peripheral vertigo were retrospectively enrolled between April 2020 and February 2025. The cohort comprised 137 males and 173 females, with a mean age of 51.05 ± 14.05 years. According to established international diagnostic criteria14,15,16, 170 patients were diagnosed with Ménière's disease (MD), 110 with sudden sensorineural hearing loss accompanied by vertigo (SSHL-V), and 30 with vestibular neuritis (VN). The left ear was affected in 164 patients and the right ear in 146.
Eligible patients had complete medical history records and comprehensive clinical examination data and met the established diagnostic criteria for MD, SSHL-V, or VN. Patients were excluded if they had incomplete medical or examination records, an undetermined diagnosis of vertigo or central vertigo, or had received medications affecting central nervous system excitability or inhibitory function within 24 h before vestibular testing.
All patients underwent caloric testing and the video Head Impulse Test (vHIT) on the same day, within 72 h of symptom onset and before receiving any treatment. Before testing, all participants received standardized information regarding the purpose of the examinations and the required precautions.
Caloric test
Caloric testing was performed using an infrared video nystagmography system. Patients were placed in the supine position with the head elevated by 30° to align the lateral semicircular canals (SCCs) vertically. Before testing, the external auditory canals were examined using an electric otoscope. Following system calibration, a blind eye mask was applied, and each ear was sequentially irrigated with cold air (24 °C) and warm air (50 °C) in the following order: right cold (RC), left cold (LC), right warm (RW), and left warm (LW). Each irrigation lasted 60 s, during which nystagmus responses were recorded. An interval of 2–3 min was maintained between irrigations, and subsequent stimulation was initiated only after complete resolution of nystagmus and vertigo symptoms.
Slow-phase velocity (SPV) was measured during a 10-s interval corresponding to the peak caloric response. Unilateral weakness (UW) was calculated using the Jongkees formula, and a UW value ≥25% was considered abnormal17.
Video Head Impulse Test
The vHIT was performed using a video-oculography-based head impulse testing system with dedicated vestibular data acquisition and analysis software. Participants were seated approximately 1.5 m from a fixed visual target positioned at eye level while wearing lightweight goggles equipped with a high-speed video camera and head-motion sensor. Standard calibration was performed according to the manufacturer's instructions. The examiner stood behind each participant, stabilizing the head with one hand positioned near the posterior neck to minimize goggle displacement.
Rapid, unpredictable, low-amplitude head impulses (15°–20°) were delivered without prior warning in the plane of the target SCC. Testing included horizontal impulses for the right and left lateral SCCs (RL-LL plane) and vertical impulses for the right anterior-left posterior (RA-LP) and right posterior-left anterior (RP-LA) canal planes. Head impulses were delivered at velocities of 150–300°/s until at least 20 artifact-free responses had been obtained for each canal.
The evaluated vHIT parameters included vestibulo-ocular reflex (VOR) gain, gain asymmetry (GA), and pathological compensatory saccades (CS). Gain asymmetry was calculated using the formula GA = (R − L)/(R + L), where R and L represented the VOR gain values of the corresponding right and left SCC planes, respectively. Abnormal VOR gain was defined as <0.8 for the lateral SCCs and <0.7 for the vertical (anterior and posterior) SCCs. Pathological CS was defined as compensatory saccades occurring in more than 50% of head impulses, with a peak saccade velocity exceeding one-half of the corresponding peak head velocity and directed consistently with the VOR18. All vHIT recordings were acquired using the left-sided camera, irrespective of the affected ear. All examinations were performed by the same experienced technician, who remained blinded to the patients' clinical diagnoses throughout data acquisition.
Statistical analysis
Statistical analyses were performed using R software (version 4.2.1). To evaluate the potential confounding effect of age on vHIT parameters, patients were stratified according to the World Health Organization age classification into young (18–44 years, n = 100), middle-aged (45–64 years, n = 154), and elderly (≥65 years, n = 56) groups. Continuous variables with normal distribution were presented as mean ± standard deviation, while those with non-normal distribution were expressed as median with interquartile range (Q1, Q3). Categorical variables were reported as frequencies and percentages [n (%)]. The Kruskal-Wallis test was used to compare multiple groups with non-normally distributed data. Categorical variables were compared using the chi-square test or Fisher's exact test.
Within each disease group and inter-group comparison, the chi-square test and McNemar test were used to compare the frequencies of gain reduction and pathological CS among the three SCCs. The Mann–Whitney U test was used to compare UW median values between the CS-positive and CS-negative groups in patients with normal VOR gain. Receiver operating characteristic (ROC) curve analysis was performed separately within each disease group to evaluate the discriminatory performance of lateral SCC VOR gain and right lateral-left lateral SCC gain asymmetry (RL-LL GA) for caloric UW status. Optimal ROC cut-off values were determined using the maximum Youden index, and the areas under the ROC curves were compared using the DeLong test. 2 × 2 contingency tables were constructed to evaluate the diagnostic performance of pathological CS, and 95% confidence intervals for sensitivity, specificity, positive predictive value, and negative predictive value were calculated using the Clopper–Pearson exact method. All tests were two-sided, and P < 0.05 was considered statistically significant. Bonferroni correction was applied to adjust for multiple comparisons.
Results
Age-stratified analysis of vHIT parameters
The baseline characteristics of the three age groups are summarized in Table 1. Sex distribution was comparable among the groups (P = 0.906), whereas the distribution of disease types differed significantly (P = 0.0003), with a higher proportion of patients with Ménière's disease (MD) in the middle-aged group and a higher proportion of patients with vestibular neuritis (VN) in the young group.
The age-stratified analysis of vHIT parameters is presented in Table 2. No significant differences were observed in vestibulo-ocular reflex (VOR) gain across the age groups for the lateral semicircular canal (SCC) (H = 1.376, P = 0.503), anterior SCC (H = 3.788, P = 0.150), or posterior SCC (H = 0.145, P = 0.930). Likewise, the rates of pathological compensatory saccades (CS) did not differ significantly among the age groups for any of the three SCCs (all P > 0.05). These findings suggested that age was not significantly associated with the observed vHIT abnormalities in this pooled cohort.
Comparison of vHIT parameters across age groups in different disease groups
Age-stratified analyses within each disease group are summarized in Table 3. In the MD and VN groups, sex, laterality, and all vHIT parameters showed no significant differences across age groups (all P > 0.05). In the SSHL-V group, the abnormal CS rate of the lateral semicircular canal differed significantly among the three age groups (P < 0.001), with the middle-aged group significantly higher than both the young group (P = 0.003) and the elderly group (P = 0.003), exhibiting a non-linear distribution. No age-related differences were observed for the other semicircular canal parameters (P > 0.05). This age-related difference in the lateral SCC CS abnormality rate in SSHL-V appeared to be an isolated, non-linear finding, being the only significant result among all comparisons, with a pattern characterized by the highest rate in the middle-aged group and comparatively lower rates in both the young and elderly groups. Such a pattern does not align with the monotonic dose-response relationship expected for a classical confounding factor and may therefore suggest that this observation is unlikely to reflect a systematic confounding effect of age on vHIT parameters.
Comparison of reduced VOR gain and compensatory saccades among semicircular canals within each disease group
The frequencies of reduced VOR gain and pathological CS in each SCC are shown in Figure 1. Among patients with MD, the CS positivity rate was significantly higher in the lateral SCC (37.6%) than in the posterior (17.0%) and anterior (10.0%) SCCs (both P < 0.001). Furthermore, the CS positivity rate exceeded the corresponding rate of reduced VOR gain in lateral and posterior SCCs (lateral: 37.6% vs. 10.0%, P < 0.001; posterior: 17.0% vs. 5.9%, P < 0.001). In contrast, no significant differences were observed in the frequency of reduced VOR gain among the three SCCs (P > 0.05).
In patients with sudden sensorineural hearing loss with vertigo (SSHL-V), both the frequency of reduced VOR gain (20.0%) and the CS positivity rate (49.0%) in the lateral SCC were significantly higher than those in the anterior SCC (2.7% and 8.1%, respectively; both P < 0.001). However, neither parameter differed significantly between the lateral and posterior SCCs (16.4% and 36.3%, respectively; P > 0.05). In addition, the CS positivity rates in the lateral (49.0%), posterior (36.3%), and anterior (8.1%) SCCs were significantly higher than the corresponding frequencies of reduced VOR gain (20.0%, 16.4%, and 2.7%, respectively; P < 0.001, P < 0.001, and P = 0.031).
Among patients with VN, both the frequency of reduced VOR gain (43.3%) and the CS positivity rate (63.3%) were significantly higher in the lateral SCC than in the posterior (13.3% and 16.7%, respectively) and anterior (10.0% and 33.3%, respectively) SCCs (all P < 0.05). The CS positivity rate also exceeded the frequency of reduced VOR gain in the lateral SCC (63.3% vs. 43.3%, P = 0.031) and anterior SCC (33.3% vs. 10.0%, P = 0.039), whereas no significant difference was observed in the posterior SCC (16.7% vs. 13.3%, P = 1.000).
Inter-group comparison of vHIT multidimensional parameters across the three disease groups
Inter-group comparison of vHIT multidimensional parameters is summarized in Table 4. In the lateral SCC, the rate of reduced VOR gain in VN was significantly higher than that in both MD and SSHL-V (P < 0.001; P = 0.009), whereas no significant difference was observed between MD and SSHL-V (P = 0.018). For pathological CS, a significant difference was found only between MD and VN (P = 0.008). The combined G + CS parameter in the lateral SCC showed that VN differed significantly from both MD and SSHL-V (P < 0.001; P = 0.006). No other significant differences were observed in the lateral SCC parameters among the three groups (P > 0.0167).
In the posterior SCC, significant differences were identified between MD and SSHL-V across all three parameters: reduced VOR gain (P = 0.004), pathological CS (P < 0.001), and combined G + CS (P = 0.004). No significant differences were found between MD and VN or between SSHL-V and VN for any posterior SCC parameter (P > 0.0167).
In the anterior SCC, only within the CS subgroup, the rate of pathological CS in VN was significantly higher than in both MD and SSHL-V (P = 0.002; P = 0.001). All other pairwise comparisons of anterior SCC parameters did not reach statistical significance (P > 0.05 or P > 0.0167).
Comparison of unilateral weakness between CS-positive and CS-negative groups in patients with normal VOR gain
Comparisons of caloric unilateral weakness (UW) between the CS-positive and CS-negative groups in patients with normal VOR gain are presented in Figure 2. Among patients with MD, the median UW values in the CS-positive group were significantly higher than those in the CS-negative group for the lateral SCC [42.81 (21.91, 63.53) vs. 27.27 (13.23, 47.55)], posterior SCC [60.63 (33.50, 70.73) vs. 30.73 (16.88, 55.92)], and anterior SCC [54.23 (38.17, 70.68) vs. 31.25 (16.32, 57.35); all P < 0.05].
Similarly, among patients with SSHL-V, median UW values were significantly higher in the CS-positive group than in the CS-negative group for the posterior SCC [46.16 (17.94, 61.97) vs. 22.15 (9.83, 49.37)], and anterior SCC [60.18 (35.12, 84.56) vs. 31.03 (11.36, 55.69)] (all P < 0.05). In patients with VN, median UW values were significantly higher in the CS-positive group than in the CS-negative group for the lateral SCC [58.01 (29.79, 71.93) vs. 24.10 (10.92, 33.13)] and anterior SCC [60.37 (51.34, 69.93) vs. 34.06 (23.40, 56.20)] (both P < 0.05). However, no significant difference was observed between the two groups for the posterior SCC [77.03 (77.03, 77.03) vs. 38.98 (23.75, 63.68)] (P > 0.05).
A representative case is shown in Figure 3. The figure illustrates a 43-year-old woman diagnosed with SSHL-V in whom the VOR gain of the right posterior SCC remained within the normal range despite the presence of pathological compensatory saccades. This case is presented for illustrative purposes only and is not intended to represent the overall study population.
Diagnostic performance of vHIT parameters for identifying caloric unilateral weakness within each disease group
The receiver operating characteristic (ROC) analyses evaluated the ability of vHIT parameters to discriminate caloric unilateral weakness within each disease group. The ROC curves are presented in Figure 4, and the diagnostic performance of pathological CS is summarized in Table 5.
Among patients with MD, the area under the ROC curve (AUC) for lateral SCC VOR gain was 0.598 (95% CI: 0.509–0.687, P = 0.034). The optimal ROC-derived cut-off value was 1.265, which yielded a sensitivity of 80.7% and a specificity of 39.3%. The AUC for right lateral-left lateral SCC gain asymmetry (RL-LL GA) was 0.672 (95% CI: 0.590–0.754, P < 0.001), with an optimal cut-off value of 4.55%, corresponding to a sensitivity of 54.1% and a specificity of 77.0% (Figure 4A,B). Comparison of the two ROC curves using the DeLong test showed no significant difference between the AUCs (Z = 1.72, P = 0.085). The lateral SCC CS demonstrated a sensitivity of 45.0% (95% CI: 36.0%–55.0%), specificity of 75.4% (95% CI: 62.0%–85.0%), positive predictive value (PPV) of 76.6% (95% CI: 64.0%–86.0%), and negative predictive value (NPV) of 43.4% (95% CI: 34.0%–53.0%; Table 5).
Among patients with SSHL-V, the AUC for lateral SCC VOR gain was 0.721 (95% CI: 0.625–0.816, P < 0.001). The optimal ROC-derived cut-off value was 0.95, yielding a sensitivity of 47.7% and a specificity of 95.6%. The AUC for RL-LL GA was 0.712 (95% CI: 0.615–0.809, P < 0.001), with an optimal cut-off value of 8.5%, corresponding to a sensitivity of 49.2% and a specificity of 91.1% (Figure 4C,D). The DeLong test showed no significant difference between the two AUCs (Z = 0.32, P = 0.749). The lateral SCC CS yielded a sensitivity of 61.5% (95% CI: 49.0%–73.0%), specificity of 68.9% (95% CI: 53.0%–81.0%), PPV of 74.1% (95% CI: 60.0%–85.0%), and NPV of 55.4% (95% CI: 42.0%–68.0%; Table 5).
Among patients with VN, the AUC for lateral SCC VOR gain was 0.857 (95% CI: 0.716–0.998, P = 0.005), with an optimal ROC-derived cut-off value of 0.815, corresponding to a sensitivity of 60.9% and a specificity of 100.0%. The AUC for RL-LL GA was 0.720 (95% CI: 0.520–0.921, P = 0.082) and did not reach statistical significance (Figure 4E,F). The lateral SCC CS demonstrated a sensitivity of 78.3% (95% CI: 56.0%–92.0%), specificity of 85.7% (95% CI: 42.0%–99.0%), PPV of 94.7% (95% CI: 72.0%–100.0%), and NPV of 54.6% (95% CI: 25.0%–82.0%; Table 5).
It should be noted that the ROC-derived cut-off values differed from the predefined abnormality threshold of VOR gain <0.8. The predefined threshold represents a clinical criterion based on manufacturer recommendations and prior literature for classifying individual test results as normal or abnormal18. In contrast, the ROC-derived cut-off values were statistical thresholds that maximized the Youden index for discriminating caloric UW status within each disease group and were not intended to serve as clinical diagnostic thresholds.
DATA AVAILABILITY:
The complete, fully de-identified raw dataset underlying the analyses reported in the manuscript has been uploaded with the revised submission as Supplementary File 1.
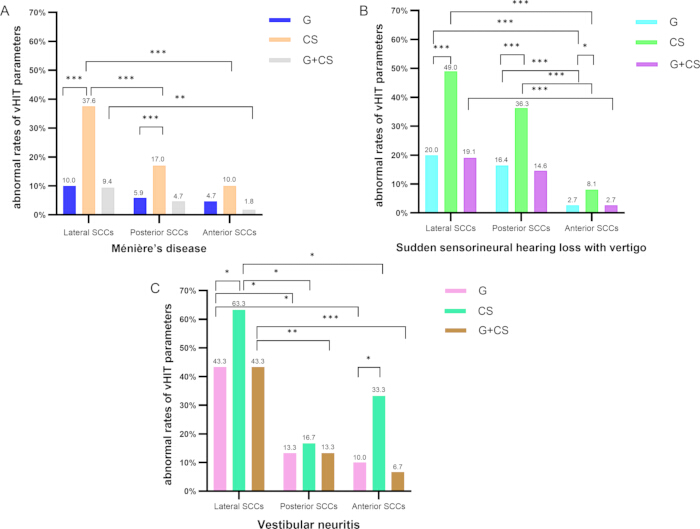
Figure 1: Comparison of reduced VOR gain and pathological compensatory saccades among semicircular canals within each disease group. Comparison of the frequencies of reduced vestibulo-ocular reflex (VOR) gain and pathological compensatory saccades (CS) in the lateral, posterior, and anterior semicircular canals (SCCs) within each disease group. (A) Ménière's disease (MD). (B) Sudden sensorineural hearing loss with vertigo (SSHL-V). (C) Vestibular neuritis (VN). Statistical comparisons were performed between SCCs and between reduced VOR gain and CS positivity within each SCC. Significant differences are indicated by P values. Abbreviations: VOR = vestibulo-ocular reflex; CS = compensatory saccades; SCC = semicircular canal; MD = Ménière's disease; SSHL-V = sudden sensorineural hearing loss with vertigo; VN = vestibular neuritis. Please click here to view a larger version of this figure.
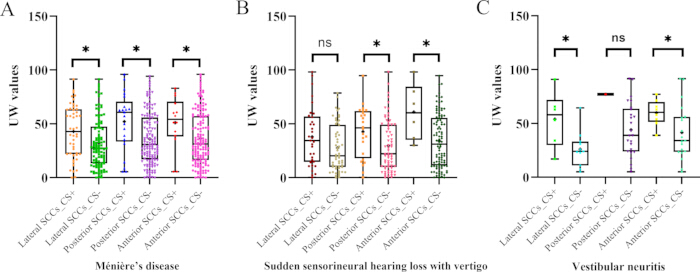
Figure 2: Comparison of caloric unilateral weakness between CS-positive and CS-negative groups in patients with normal VOR gain. Comparison of caloric unilateral weakness (UW) between the CS-positive and CS-negative groups among patients with normal VOR gain. UW values are presented as median with first and third quartiles (Q1, Q3). (A) Ménière's disease (MD). (B) Sudden sensorineural hearing loss with vertigo (SSHL-V). (C) Vestibular neuritis (VN). Horizontal lines indicate the median, boxes represent the interquartile range, and whiskers denote the data range. Statistical significance between groups is indicated by P values. Abbreviations: UW = unilateral weakness; CS = compensatory saccades; VOR = vestibulo-ocular reflex; MD = Ménière's disease; SSHL-V = sudden sensorineural hearing loss with vertigo; VN = vestibular neuritis; Q1 = first quartile; Q3 = third quartile. Please click here to view a larger version of this figure.
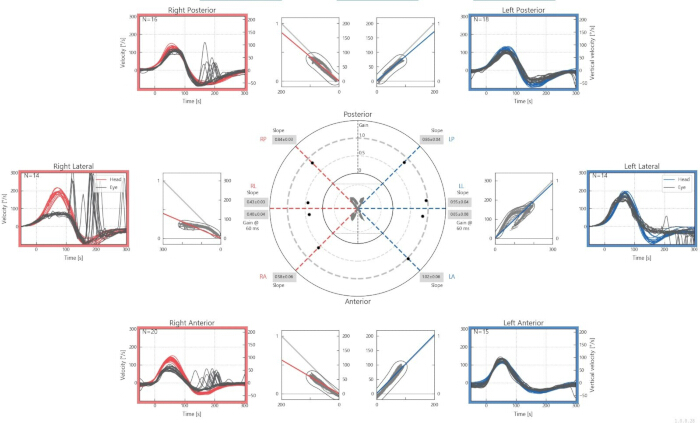
Figure 3: Representative vHIT findings in a patient with sudden sensorineural hearing loss with vertigo. Representative video Head Impulse Test (vHIT) recordings obtained from a 43-year-old female patient diagnosed with sudden sensorineural hearing loss with vertigo (SSHL-V). The right posterior semicircular canal demonstrated a normal vestibulo-ocular reflex (VOR) gain despite the presence of pathological compensatory saccades (CS), illustrating that pathological CS may occur in the absence of reduced VOR gain. This image is presented as a representative example and is not intended to be statistically representative of the study cohort. Abbreviations: vHIT = video head impulse test; VOR = vestibulo-ocular reflex; CS = compensatory saccades; SSHL-V = sudden sensorineural hearing loss with vertigo. Please click here to view a larger version of this figure.
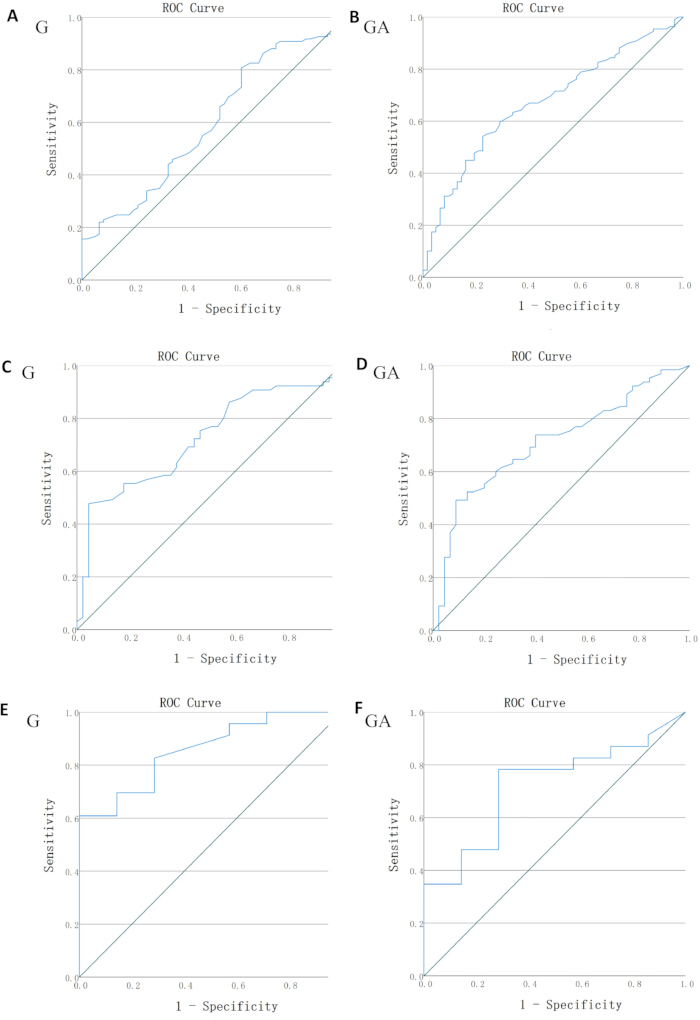
Figure 4: Receiver operating characteristic analysis of vHIT parameters for identifying caloric unilateral weakness within each disease group. Receiver operating characteristic (ROC) curves showing the performance of lateral semicircular canal (SCC) vestibulo-ocular reflex (VOR) gain and right lateral-left lateral SCC gain asymmetry (RL-LL GA) for discriminating caloric unilateral weakness (UW) status within each disease group. (A) Lateral SCC VOR gain in Ménière's disease (MD). (B) RL-LL gain asymmetry in MD. (C) Lateral SCC VOR gain in sudden sensorineural hearing loss with vertigo (SSHL-V). (D) RL-LL gain asymmetry in SSHL-V. (E) Lateral SCC VOR gain in vestibular neuritis (VN). (F) RL-LL gain asymmetry in VN. The optimal ROC-derived cut-off values were determined by maximizing the Youden index. Abbreviations: ROC = receiver operating characteristic; AUC = area under the curve; VOR = vestibulo-ocular reflex; SCC = semicircular canal; GA = gain asymmetry; RL-LL = right lateral-left lateral; UW = unilateral weakness; MD = Ménière's disease; SSHL-V = sudden sensorineural hearing loss with vertigo; VN = vestibular neuritis. Please click here to view a larger version of this figure.
| Characteristic | Young (18–44 yrs, n = 100) | Middle-aged (45–64 yrs, n = 154) | Elderly (≥65 yrs, n = 56) | Statistic | P value |
| Sex | χ²= 0.198 | 0.906 | |||
| Male [n (%)] | 43 (43.0) | 70 (45.5) | 24 (42.9) | ||
| Female [n (%)] | 57(57.0) | 84 (54.5) | 32 (57.1) | ||
| Disease type | χ² = 21.228 | 0.0003 | |||
| MD [n (%)] | 40 (40.0) | 98 (63.6) | 32 (57.1) | ||
| SSHL-V [n (%)] | 41 (41.0) | 49 (31.8) | 20 (35.7) | ||
| VN [n (%)] | 19 (19.0) | 7(4.5) | 4 (7.1) |
Table 1: Baseline characteristics across age groups. Baseline demographic and disease characteristics of participants stratified by age into young (18–44 years, n = 100), middle-aged (45–64 years, n = 154), and elderly (≥65 years, n = 56) groups. Sex and disease-type distributions are presented as numbers (percentages) and compared across age groups using the chi-square (χ2) test. Abbreviations: MD = Ménière’s disease; SSHL-V = sudden sensorineural hearing loss with vertigo; VN = vestibular neuritis. Bold P values indicate statistically significant differences (P < 0.05).
| Parameter | Young (18–44 yrs, n = 100) | Middle-aged (45–64 yrs, n = 154) | Elderly (≥65 yrs, n = 56) | Statistic | P value |
| VOR gain [median (Q1, Q3)] | |||||
| Lateral SCC | 1.060 (0.875,1.205) | 1.090 (0.940,1.228) | 1.130 (0.920,1.272) | H = 1.376 | 0.503 |
| Posterior SCC | 1.140 (0.877,1.312) | 1.070 (0.883,1.308) | 1.170 (0.860,1.333) | H = 0.145 | 0.93 |
| Anterior SCC | 1.205 (1.030,1.402) | 1.170 (0.962,1.380) | 1.300 (1.040,1.500) | H = 3.788 | 0.15 |
| CS positivity [n (%)] | |||||
| Lateral SCC | 43 (43.0) | 73 (47.4) | 21 (37.5) | χ² = 1.718 | 0.424 |
| Posterior SCC | 24 (24.0) | 37 (24.0) | 13 (23.2) | χ² = 0.016 | 0.992 |
| Anterior SCC | 13 (13.0) | 18 (11.7) | 5 (8.9) | χ² = 0.581 | 0.748 |
Table 2: Comparison of vHIT parameters across age groups. Comparison of video Head Impulse Test (vHIT) parameters among young (18–44 years, n = 100), middle-aged (45–64 years, n = 154), and elderly (≥65 years, n = 56) participants. Vestibulo-ocular reflex (VOR) gain is presented as median (Q1, Q3), whereas compensatory saccade (CS) positivity is presented as a number (percentage). VOR gain was compared using the Kruskal–Wallis test (H statistic), and categorical variables were compared using the chi-square (χ2) test. Abbreviations: VOR = vestibulo-ocular reflex; vHIT = video Head Impulse Test; SCC = semicircular canal; CS = compensatory saccades; Q1 = first quartile; Q3 = third quartile. A P value < 0.05 was considered statistically significant.
| Parameter | Young (18–44 yrs) | Middle-aged (45–64 yrs) | Elderly (≥65 yrs) | Statistic | P value |
| MD(N = 170) | n = 40 | n = 98 | n = 32 | ||
| Sex | χ² = 0.241 | 0.887 | |||
| Male [n (%)] | 17 (42.5) | 46 (46.9) | 15 (46.9) | ||
| Female [n (%)] | 23(57.5) | 52(53.1) | 17(53.1) | ||
| Side | χ² = 0.503 | 0.778 | |||
| Left [n (%)] | 19(47.5) | 53(54.1) | 17(53.1) | ||
| Right [n (%)] | 21 (52.5) | 45 (45.9) | 15 (46.9) | ||
| VOR gain [median (Q1, Q3)] | |||||
| Lateral SCC | 1.110 (0.975, 1.270) | 1.155 (0.980, 1.270) | 1.135 (0.900, 1.275) | H = 0.357 | 0.836 |
| Posterior SCC | 1.155 (0.900, 1.330) | 1.120 (0.910, 1.400) | 1.140 (0.875, 1.345) | H = 0.165 | 0.921 |
| Anterior SCC | 1.180 (1.000, 1.360) | 1.210 (1.030, 1.400) | 1.315 (1.075, 1.630) | H = 3.089 | 0.213 |
| CS positivity [n (%)] | |||||
| Lateral SCC | 17 (42.5%) | 34 (34.7%) | 13 (40.6%) | χ² = 0.886 | 0.642 |
| Posterior SCC | 8 (20.0%) | 15 (15.3%) | 6 (18.8%) | χ² = 0.522 | 0.770 |
| Anterior SCC | 5 (12.5%) | 9 (9.2%) | 3 (9.4%) | - | 0.887 |
| SSHL-V(N = 110) | n = 41 | n = 49 | n = 20 | ||
| Sex | |||||
| Male [n (%)] | 14(34.1) | 20(40.8) | 8(40.0) | χ² = 0.455 | 0.797 |
| Female [n (%)] | 27 | 29 | 12 | ||
| Side | χ² = 2.430 | 0.297 | |||
| Left [n (%)] | 23(56.1) | 25(51.0) | 7(35.0) | ||
| Right [n (%)] | 18(43.9) | 24(49.1) | 13(65.0) | ||
| VOR gain [median (Q1, Q3)] | |||||
| Lateral SCC | 1.06 (0.94, 1.22) | 1.04 (0.77, 1.20) | 1.16 (0.96, 1.25) | H = 2.691 | 0.261 |
| Posterior SCC | 1.14 (0.87, 1.28) | 1.03 (0.83, 1.23) | 1.17 (0.78, 1.30) | H = 1.895 | 0.388 |
| Anterior SCC | 1.34 (1.10, 1.47) | 1.15 (0.94, 1.36) | 1.29 (0.94, 1.47) | H = 4.811 | 0.090 |
| CS positivity [n (%)] | |||||
| Lateral SCC | 14 (34.1) | 35 (71.4) | 5 (25.0) | χ² = 18.092 | <0.001* |
| Posterior SCC | 14 (34.1) | 21 (42.9) | 5 (25.0) | χ² = 2.096 | 0.351 |
| Anterior SCC | 2 (4.9) | 6 (12.2) | 1 (5.0) | - | 0.379 |
| VN(N = 30) | n = 19 | n = 7 | n = 4 | ||
| Sex | 0.421 | ||||
| Male [n (%)] | 12 (63.2) | 4 (57.1) | 1 (25.0) | ||
| Female [n (%)] | 7(36.8) | 3(42.9) | 3(75.0) | ||
| Side | 0.284 | ||||
| Left [n (%)] | 11(57.9) | 5(71.4) | 4(100.0) | ||
| Right [n (%)] | 8 (42.1) | 2 (28.6) | 0 (0.0) | ||
| VOR gain [median (Q1, Q3)] | |||||
| Lateral SCC | 0.88 (0.66, 1.06) | 0.82 (0.44, 1.10) | 0.79 (0.45, 1.24) | H = 0.151 | 0.928 |
| Posterior SCC | 1.11 (0.76, 1.22) | 0.89 (0.76, 1.24) | 1.01 (0.65, 1.39) | H = 0.129 | 0.938 |
| Anterior SCC | 1.14 (0.96, 1.30) | 0.89 (0.72, 0.95) | 1.27 (1.13, 1.39) | H = 4.543 | 0.103 |
| CS positivity [n (%)] | |||||
| Lateral SCC | 12 (63.2) | 4 (57.1) | 3 (75.0) | - | 1.000 |
| Posterior SCC | 2 (10.5) | 1 (14.3) | 2 (50.0) | - | 0.185 |
| Anterior SCC | 6 (31.6) | 3 (42.9) | 1 (25.0) | - | 0.859 |
Table 3: Comparison of vHIT parameters across age groups according to disease type.
Age-related differences in video Head Impulse Test (vHIT) parameters were evaluated separately in patients with Ménière’s disease (MD), sudden sensorineural hearing loss with vertigo (SSHL-V), and vestibular neuritis (VN). Participants in each disease group were stratified as young (18–44 years), middle-aged (45–64 years), or elderly (≥65 years). Sex, affected side, vestibulo-ocular reflex (VOR) gain, and compensatory saccade (CS) positivity are reported. VOR gain is expressed as median (Q1, Q3), and categorical variables as number (percentage). Continuous variables were compared using the Kruskal–Wallis test (H statistic), while categorical variables were assessed using the chi-square (χ2) test, as applicable. Abbreviations: SCC = semicircular canal; Q1 = first quartile; Q3 = third quartile. P < 0.05 indicates statistical significance.
| Semicircular canal | Parameter | MD(n = 170) | SSHL-V(n = 110) | VN(n = 30) | χ² | P |
| Lateral SCC[n (%)] | G | 17 (10.0) | 22 (20.0) | 13 (43.3) | 21.57 | <0.001* |
| CS | 64 (37.6) | 54 (49.0) | 19 (63.3) | 8.48 | 0.014* | |
| G+CS | 16 (9.4) | 21 (19.1) | 13 (43.3) | 22.796 | <0.001* | |
| Posterior SCC[n (%)] | G | 10 (5.9) | 18 (16.4) | 4 (13.3) | 8.251 | 0.016* |
| CS | 29 (17.0) | 40 (36.3) | 5 (16.7) | 14.645 | <0.001* | |
| G+CS | 8 (4.7) | 16 (14.6) | 4 (13.3) | 8.617 | 0.013* | |
| Anterior SCC[n (%)] | G | 8 (4.7) | 3 (2.7) | 3 (10.0) | 2.923 | 0.232 |
| CS | 17 (10.0) | 9 (8.1) | 10 (33.3) | 15.481 | <0.001* | |
| G+CS | 3 (1.8) | 3 (2.7) | 2 (6.7) | - | 0.202 |
Table 4: Inter-group comparison of multidimensional vHIT parameters across the three disease groups. Comparison of abnormal video Head Impulse Test (vHIT) findings among patients with Ménière’s disease (MD; n = 170), sudden sensorineural hearing loss with vertigo (SSHL-V; n = 110), and vestibular neuritis (VN; n = 30). Abnormalities in vestibulo-ocular reflex gain (G), compensatory saccades (CS), and the combination of abnormal gain and compensatory saccades (G + CS) are presented as numbers (percentages) for the lateral, posterior, and anterior semicircular canals (SCCs). Inter-group differences were evaluated using the chi-square (χ2) test, as applicable. Bold P values indicate statistically significant differences (P < 0.05). For all statistically significant results, post-hoc pairwise comparisons were performed using Bonferroni correction (adjusted α = 0.05/3 = 0.0167).
| Diseases | Caloric Test | Lateral SCCs CS (+) | Lateral SCCs CS (-) | Total |
| MD | UW (+) | 49 | 60 | 109 |
| UW (-) | 15 | 46 | 61 | |
| SSHL-V | UW (+) | 40 | 25 | 65 |
| UW (-) | 14 | 31 | 45 | |
| VN | UW (+) | 18 | 5 | 23 |
| UW (-) | 1 | 6 | 7 |
Table 5: Relationship between caloric test results and lateral semicircular canal compensatory saccades on vHIT in patients with vestibular diseases. Distribution of caloric test results according to the presence or absence of pathological compensatory saccades (CS) in the lateral semicircular canals on video head impulse test (vHIT) among patients with Ménière’s disease (MD), sudden sensorineural hearing loss with vertigo (SSHL-V), and vestibular neuritis (VN). UW (+) denotes unilateral weakness ≥25% on caloric testing, and UW (−) denotes unilateral weakness <25%. Lateral SCC CS (+) indicates pathological compensatory saccades in the lateral semicircular canals, whereas lateral SCC CS (−) indicates normal compensatory saccades. Abbreviations: SCC = semicircular canal; CS = compensatory saccades; UW = unilateral weakness.
Supplementary File 1: Raw data showing participant demographics, disease type, affected side, UW (%), semicircular canal (SCC) gains, and compensatory saccades (CS) status for the posterior, lateral, and anterior SCCs. Please click here to download this file.
Discussion
The present study enrolled 310 patients with peripheral vestibular disorders (Ménière's disease, sudden sensorineural hearing loss with vertigo, and vestibular neuritis) between April 2020 and February 2025, which partially overlaps with the recruitment period and patient cohort of a previously published 5-year retrospective study from the same research group (Zhang et al., Clin Otolaryngol, 2025; recruitment period: October 2018 to July 2024). The estimated overlap accounts for approximately 32.9% of the present cohort. In contrast to the previous study, the present analysis included patients with pathological compensatory saccades on vHIT, regardless of VOR gain, thereby enabling evaluation of isolated CS abnormalities not analyzed in the prior study.
Despite this overlap, the two studies differ fundamentally in their analytical perspectives and primary findings. The previous study focused on stratifying the severity of unilateral caloric weakness, examining the patterns and risk associations of vHIT abnormalities across different UW levels. The present study, by contrast, adopted a disease-stratified approach and conducted the following novel analyses not performed in the earlier investigation: (a) characterizing the disease-specific patterns of multidimensional vHIT parameters (VOR gain, gain asymmetry, and compensatory saccades) across three common peripheral vestibular disorders; (b) assessing the relationship between CS status and caloric UW in patients with normal VOR gain; and (c) evaluating the potential confounding effect of age on vHIT parameters.
Accordingly, although both studies were based on retrospective data from the same institution, the present study makes an independent contribution by characterizing disease-specific vHIT parameter profiles and exploring the possibility that compensatory saccades are associated with early high-frequency vestibular dysfunction.
The video Head Impulse Test (vHIT) is a core technique for assessing high-frequency vestibulo-ocular reflex (VOR) function by providing quantitative measurements of semicircular canal (SCC) gain, gain asymmetry (GA), and compensatory saccades (CS). Previous studies have primarily focused on individual vHIT parameters in specific vestibular disorders. In contrast, the present study systematically characterized multidimensional vHIT profiles across three common peripheral vestibular disorders using a uniform testing protocol. The findings demonstrated that vHIT abnormalities were predominantly manifested as pathological CS and exhibited distinct patterns among the three disease groups, which may reflect differences in their underlying pathophysiology.
In patients with Ménière's disease (MD), the CS positivity rate in the lateral SCC (37.6%) was significantly higher than that in the posterior and anterior SCCs (P < 0.001), whereas the abnormal VOR gain rate was only 10.0%. Among the 64 patients with pathological CS, only 25.0% demonstrated reduced VOR gain. These findings suggest that high-frequency vestibular dysfunction during the acute phase of MD is often associated with normal lateral SCC gain and pathological CS. This pattern may be associated with endolymphatic hydrops, the hallmark pathological feature of MD. Endolymphatic hydrops may reduce the mechanical sensitivity of hair cells within the ampullary crests of the SCCs without producing a measurable reduction in VOR gain19. Nevertheless, the resulting impairment of vestibular function may be sufficient to trigger compensatory saccades as a central mechanism for maintaining gaze stability. In this setting, CS may serve as an associated finding that provides additional information beyond gain measurements in the context of subtle vestibular dysfunction.
Patients with sudden sensorineural hearing loss accompanied by vertigo (SSHL-V) demonstrated involvement of both the lateral and posterior SCCs. This distribution may reflect ischemic injury affecting multiple vestibular end organs secondary to inner-ear microcirculatory disturbances20. Oxidative stress resulting from impaired microcirculation may further aggravate hair-cell injury and contribute to the observed increase in pathological CS. Consequently, CS may be observed in association with vestibular dysfunction before VOR gain declines below the conventional abnormality threshold.
In vestibular neuritis (VN), the CS positivity rate in the lateral SCC reached 63.3%, whereas the VOR gain abnormality rate was 43.3%. Both measures were significantly higher than those observed in the vertical SCCs (P < 0.05). This pattern is consistent with selective inflammation or viral involvement of the vestibular nerve, together with the anatomical vulnerability of the lateral SCC21. Such injury may produce demyelination and axonal damage, resulting in marked impairment of high-frequency VOR function. Under these circumstances, central compensation may be insufficient to restore VOR symmetry, resulting in abundant pathological CS alongside reduced gain. This combination represents a pattern of concurrent gain reduction and pathological CS that appears characteristic of acute VN.
To further validate the disease-specific patterns observed in the within-group analyses, direct pairwise comparisons of vHIT multidimensional parameters were performed among the three disease groups. In the lateral SCC, the rate of reduced VOR gain in VN was significantly higher than that in both MD and SSHL-V (P < 0.0167). The combined G+CS parameter also showed significant differences between VN and the other two groups (P < 0.0167), suggesting that the coexistence of reduced gain and pathological CS in the lateral SCC may serve as a characteristic feature of acute VN. In the posterior SCC, the rates of reduced VOR gain, pathological CS, and combined G+CS abnormalities in SSHL-V were all significantly higher than those in MD (P < 0.0167), indicating that posterior SCC involvement may be a key differentiator between MD and SSHL-V. This finding is consistent with the within-group observation that SSHL-V exhibited multi-planar involvement of the lateral and posterior SCCs, whereas MD abnormalities were predominantly confined to the lateral SCC. Regarding the anterior SCC, significant differences were observed only within the CS-positive subgroup between VN and the other two groups; however, given the relatively small sample size of the VN group, this finding warrants further validation.
The higher caloric unilateral weakness (UW) values observed in the CS-positive groups further support an association between pathological CS and high-frequency vestibular dysfunction. Although physiological "microsaccades" may occur in healthy individuals, Xu et al.22 demonstrated that these differ from the pathological compensatory saccades observed in vestibular disorders. In the present study, CS were identified using established pathological criteria. Peripheral vestibular dysfunction may reduce SCC responsiveness and impair VOR effectiveness, thereby necessitating compensatory saccades to maintain visual fixation during rapid head movements. Compared with gain measurements alone, CS may be more sensitive for detecting dynamic impairment of the high-frequency VOR and may therefore provide complementary information regarding subtle vestibular dysfunction. Kabaya et al.23 demonstrated that even mild unilateral lateral SCC dysfunction may elicit pathological CS during vHIT. The present findings further suggest that CS may also reflect dysfunction involving the vertical SCCs. Consequently, the combination of normal VOR gain and pathological CS may be associated with high-frequency vestibular dysfunction in patients with acute MD and early SSHL-V, particularly when conventional gain measurements remain within the normal range. Furthermore, the positive association between CS positivity and increasing UW suggests that pathological CS may provide complementary information regarding the severity of caloric weakness. This observation extends previous findings that caloric UW values of at least 50% effectively predict overall vHIT abnormalities, including reduced gain and pathological CS24. In the present study, pathological CS were also observed in patients with mild-to-moderate caloric weakness, suggesting that CS may provide complementary information to caloric testing regarding high-frequency vestibular function across different stages of vestibular impairment.
The caloric test is widely regarded as the gold standard for assessing low-frequency vestibular function25. Thermal stimulation of the lateral SCC-vestibular nerve pathway is used to evaluate vestibular asymmetry, with UW ≥25% indicating clinically significant unilateral weakness17,26. The present study systematically evaluated the relationship between multidimensional vHIT parameters and caloric test results within each disease group. In patients with MD, lateral SCC VOR gain showed limited discriminative ability for caloric UW (AUC = 0.598, P = 0.034), with high sensitivity (80.7%) but low specificity (39.3%). In contrast, GA demonstrated a higher AUC (0.672, P < 0.001) and improved specificity (77.0%), whereas pathological CS achieved a specificity of 75.4% and a positive predictive value of 76.6%. These findings suggest that, in MD, where endolymphatic hydrops may preferentially affect low-frequency vestibular function while sparing high-frequency VOR gain, GA and CS may better reflect underlying vestibular dysfunction than gain alone. Accordingly, assessment of multiple vHIT parameters may reduce the underestimation of vestibular impairment in MD. Consistent with this interpretation, the ROC-derived optimal gain cut-off (1.265) was substantially higher than the predefined abnormality threshold of 0.8, suggesting that caloric abnormalities may occur despite preserved VOR gain.
In SSHL-V, both VOR gain and GA demonstrated moderate agreement with caloric test findings. Lateral SCC gain yielded an AUC of 0.721 (P < 0.001) with high specificity (95.6%), whereas GA produced an AUC of 0.712 (P < 0.001) and a specificity of 91.1%. Although VOR gain exhibited excellent specificity, its sensitivity was limited (47.7%). By comparison, pathological CS showed higher sensitivity (61.5%) with moderate specificity (68.9%). This pattern is consistent with the predominance of CS abnormalities observed in SSHL-V and suggests that CS may be present in association with subtle vestibular dysfunction before measurable gain reduction occurs. Therefore, the combined interpretation of VOR gain and CS may improve vestibular assessment in SSHL-V. The ROC-derived optimal gain cut-off of 0.95 further suggests that gain values close to the lower limit of the normal range may already be associated with caloric abnormalities in this population.
Among patients with VN, lateral SCC VOR gain demonstrated the strongest agreement with caloric test findings, yielding an AUC of 0.857 (P = 0.005) and a specificity of 100% at the optimal ROC-derived cut-off of 0.815. This finding is consistent with the severe and acute vestibular nerve injury characteristic of VN, which produces a substantial reduction of high-frequency VOR gain. In contrast, GA did not achieve statistical significance (AUC = 0.720, P = 0.082), possibly because profound unilateral vestibular loss reduced its discriminatory value. Pathological CS demonstrated a sensitivity of 78.3%, specificity of 85.7%, and positive predictive value of 94.7%. However, these estimates should be interpreted with caution because the VN subgroup was relatively small (n = 30), leading to wide confidence intervals and considerable uncertainty. Larger studies are needed to obtain more precise estimates of diagnostic performance in this population. Notably, the ROC-derived gain cut-off of 0.815 was close to the predefined abnormality threshold of 0.8, consistent with the pronounced gain reduction observed in acute VN. Collectively, the coexistence of reduced gain and pathological CS in VN may help distinguish this disorder from MD and SSHL-V. Furthermore, the selective involvement of the posterior SCC distinguishes SSHL-V from MD, highlighting the importance of multi-parameter vHIT assessment in the differential diagnosis of peripheral vestibular disorders.
Several limitations should be acknowledged. First, the relatively small number of patients with VN may have reduced statistical power, contributing to the wide confidence intervals observed for diagnostic performance estimates. Second, the retrospective cross-sectional design precluded assessment of temporal changes in vestibular function and did not permit determination of whether pathological CS precedes reductions in VOR gain. Third, although pooled age analyses did not identify significant associations between age and vHIT parameters, disease distribution differed significantly across age groups. Therefore, disease-specific age effects cannot be excluded and should be investigated in larger cohorts.
In conclusion, pathological compensatory saccades were frequently observed across peripheral vestibular disorders and provided complementary information beyond conventional VOR gain measurements. Distinct multidimensional vHIT patterns were observed among the three disease groups, with MD characterized predominantly by preserved gain accompanied by pathological CS, SSHL-V by involvement of multiple SCCs with predominant CS abnormalities, and VN by concurrent reductions in VOR gain and pathological CS. Combined assessment of VOR gain, gain asymmetry, and compensatory saccades may improve characterization of vestibular dysfunction and complement caloric testing in the evaluation of patients with peripheral vertigo.
Disclosures
The authors declare no conflicts of interest for this article. All authors confirm that no generative artificial intelligence (AI) or large language model (LLM) tools were used for any component of data analysis, manuscript drafting, figure generation/creation, or result interpretation throughout the research and manuscript preparation process. All presented data, textual content, and graphical materials were produced independently by the authors without AI-generated contributions.
Acknowledgements
This work was funded by the Science and Technology Projects in Guangdong (No. 2014A020212097) and the Clinical Research Project of the Chinese Medical Association (No. 07030480056).
Materials
| Name | Company | Catalog Number | Comments |
|---|---|---|---|
| Video Head Impulse Test | Interacoustics | EyeSeeCam 1.1 | The video head impulse test (vHIT) system, engineered for rapid and objective quantification of the vestibulo-ocular reflex (VOR), enables assessment of vestibular dysfunction in patients presenting with dizziness. Operating via real-time capture of head and eye movements through a high-speed camera, the system evaluates vestibular function, detects both covert and overt saccades, and supports vestibular function testing across all six semicircular canal planes. It is equipped with a lightweight anti-slip eye mask, ensuring both testing accuracy and patient comfort. |
| Video-nystagnography system | ZEHNIT Medical Technology | VertiGoggles-M system | Integrating a high-speed infrared binocular camera, the system enables high-precision 3D tracking of both ocular and head movements even under dark conditions, and supports real-time recording of horizontal, vertical, and torsional eye movements. It is indicated for the diagnostic evaluation of dizziness, vertigo, and balance disorders. Featuring plug-and-play USB connectivity, it is compatible with all standard caloric testing protocols. |
References
- Muelleman T, et al. Epidemiology of dizzy patient population in a neurotology clinic and predictors of peripheral etiology. Otol Neurotol. 2017;38:870-875.
- McGarvie LA, Curthoys IS, MacDougall HG, Halmagyi GM. What does the dissociation between the results of video head impulse versus caloric testing reveal about the vestibular dysfunction in Meniere's disease? Acta Otolaryngol. 2015;135:859-865.
- Guan R, Zhao Z, Guo X, Sun J. The semicircular canal function tests contribute to identifying unilateral idiopathic sudden sensorineural hearing loss with vertigo. Am J Otolaryngol. 2020;41:102461.
- Wang Y, Wang L, Jing Y, Yu L, Ye F. Association between hearing characteristics/prognosis and vestibular function in sudden sensorineural hearing loss with vertigo. Front Neurol. 2020;11:579757.
- Lee JY, et al. Dissociated results between caloric and video head impulse tests in dizziness: prevalence, pattern, lesion location, and etiology. J Clin Neurol. 2020;16:277-284.
- Molnar A, Maihoub S, Tamas L, Szirmai A. Comparison between caloric and video-head impulse tests in Meniere's disease and vestibular neuritis. Int J Audiol. 2023;62:393-399.
- Vallim MGB, Gabriel GP, Mezzalira R, Stoler G, Chone CT. Does the video head impulse test replace caloric testing in the assessment of patients with chronic dizziness? A systematic review and meta-analysis. Braz J Otorhinolaryngol. 2021;87:733-741.
- Shugyo M, et al. Comparison of the video head impulse test results with caloric test in patients with Meniere's disease and other vestibular disorders. Acta Otolaryngol. 2020;140:728-735.
- Perez-Fernandez N, Gallegos-Constantino V, Barona-Lleo L, Manrique-Huarte R. Clinical and video-assisted examination of the vestibulo-ocular reflex: a comparative study. Acta Otorrinolaringol Esp. 2012;63:429-435.
- Blodow A, Pannasch S, Walther LE. Detection of isolated covert saccades with the video head impulse test in peripheral vestibular disorders. Auris Nasus Larynx. 2013;40:348-351.
- Hamilton SS, Zhou G, Brodsky JR. Video head impulse testing (vHIT) in the pediatric population. Int J Pediatr Otorhinolaryngol. 2015;79:1283-1287.
- MacDougall HG, McGarvie LA, Halmagyi GM, Curthoys IS, Weber KP. Application of the video head impulse test to detect vertical semicircular canal dysfunction. Otol Neurotol. 2013;34:974-979.
- Tranter-Entwistle I, Dawes P, Darlington CL, Smith PF, Cutfield N. Video head impulse in comparison to caloric testing in unilateral vestibular schwannoma. Acta Otolaryngol. 2016;136:1110-1114.
- Basura GJ, et al. Clinical practice guideline: Meniere's disease executive summary. Otolaryngol Head Neck Surg. 2020;162:415-434.
- Chandrasekhar SS, et al. Clinical practice guideline: sudden hearing loss (update). Otolaryngol Head Neck Surg. 2019;161:S1-S45.
- Strupp M, et al. Acute unilateral vestibulopathy/vestibular neuritis: Diagnostic criteria. J Vestib Res. 2022;32:389-406.
- Lightfoot G, et al. The derivation of optimum criteria for use in the monothermal caloric screening test. Ear Hear. 2009;30:54-62.
- Hougaard DD, Abrahamsen ER. Functional testing of all six semicircular canals with video head impulse test systems. J Vis Exp. 2019;e59632.
- Liu XF, et al. Frequency characteristics of horizontal semicircular canal damage and ultrastructure analysis of the crista ampullaris in patients with Meniere's disease. Zhonghua Er Bi Yan Hou Tou Jing Wai Ke Za Zhi. 2021;56:698-703.
- Tsuzuki N, et al. Idiopathic sudden sensorineural hearing loss caused by infarction of the vestibulo-cochlear artery can be detected by testing semicircular canal function and audiometry: Proposal for angiopathic sudden sensorineural hearing loss. Otol Neurotol. 2025;46:616-620.
- Vlastarakos PV, et al. Developing a diagnostic algorithm for identifying vestibular neuronitis in acute dizziness: An overview of epidemiology, pathogenesis, and evidence-based guidelines for diagnostic approaches. Cureus. 2025;17:e78126.
- Xu M, et al. Microsaccades during video head impulse test in normal subjects. J Vestib Res. 2025;35:64-72.
- Kabaya K, Fukushima A, Katsumi S, Minakata T, Iwasaki S. Presence of corrective saccades in patients with normal vestibulo-ocular reflex gain in video head impulse test. Front Neurol. 2023;14:1152052.
- Zhang L, et al. Analysis of vestibular function assessment methods for patients with peripheral vertigo disease: A 5-year retrospective study. Clin Otolaryngol. 2025;50:897-904.
- Li X, et al. Clinical characteristics of patients with dizziness/vertigo showing a dissociation between caloric and video head impulse test results. Ear Nose Throat J. 2025;104:NP287-NP293.
- Honaker JA, Shepard NT. Performance of Fukuda stepping test as a function of the severity of caloric weakness in chronic dizzy patients. J Am Acad Audiol. 2012;23:616-622.