This study investigated the association between wound location and subsequent wound shape and closure rate in a mouse wound model. Dermo camera use enabled stable, consistent image acquisition, providing reliable data for evaluating temporal changes in wound morphology and the wound-healing process.
Method Article
Wound Position is Associated with Morphological Stability and Quantitative Accuracy in Murine Skin Healing Models
In This Article
Summary
Abstract
Intractable skin ulcers, including diabetic foot and pressure ulcers, are impactful clinical challenges. Therefore, appropriate skin wound models are required to develop treatments that promote wound healing. Many studies have used mice with defects covering the entire skin thickness. However, the location of the wound varied depending on the study, such as the midline of the back of the mouse or wounds created bilaterally on both sides of the spine. Wounds at the midline of the back heal in a circular shape. However, wounds on both sides of the spine can be distorted by movement. Therefore, differences in the location of the wound affected closure. Furthermore, although closure rate is commonly used to evaluate wound healing, accurate quantification is difficult using conventional imaging because camera height is not consistent. The use of a digital camera designed for skin observation (Dermo camera) enables wound imaging from a fixed position. Therefore, this protocol proposes methods for selecting the optimal wound site and performing wound imaging that are suitable for evaluating wound healing in mice and for histological analysis of extracellular matrix remodeling, including re-epithelialization and fibrosis.
Introduction
With an aging population, the number of patients with chronic wounds, including diabetic foot and pressure ulcers, is increasing, presenting a significant clinical problem1,2. However, effective treatments for these intractable skin conditions have yet to be established.
Mouse models of full-thickness skin defects are commonly used3. In this model, wounds are often created on the back of the mouse using a biopsy punch. However, the location of the wounds varies depending on the study approach used. The two most commonly used approaches are creating a wound along the midline and wounds on both sides of the spine. Wounds on the midline tend to close while maintaining a relatively circular shape. In contrast, healing wounds on both sides of the spine may become irregular because of body movements. Particularly concerning the histological observation and quantification of processes such as extracellular matrix remodeling during wound healing, it is essential to understand how differences in wound location influence healing.
Closure rates are frequently used as an indicator of wound healing efficacy. While wound area has traditionally been calculated by measuring maximum and minimum wound diameters using digital calipers4,5, Rogers et al. recently reported that estimating wound area based on width and longest diameter may result in overestimation compared with the digital planar measurement method6. The validity of digital planimetry, which uses captured images to assess wound healing, has recently been demonstrated7, but when taking images with a digital camera, deviations in height and calibration can impact quantitative results8,9. Stable imaging is thus essential for accurate assessment of wound healing. A skin observation camera (Dermo camera) has demonstrated the potential to resolve this issue.
This study assessed a method for stable wound visualization and examined associations between wound location and wound closure in mice.
Protocol
All procedures were approved by the Ethics Review Committee for Animal Experimentation at Nagasaki University. Eight male C57/BL6J mice aged 6 weeks were used in this study. This study was conducted in accordance with ARRIVE guidelines. Humane endpoints warranting euthanasia included significant weight loss (>20% of peak body weight), failure to ingest food, and markedly decreased activity in the cage. The reagents and the equipment used are listed in the Table of Materials.
1. Mouse wound model (the midline of the mouse’s back) (Figure 1A,B)
- Housing conditions
- House all mice in a biosafety facility under specific pathogen-free conditions at 22–25 °C with a 12-h light-dark cycle.
- Allow the mice unrestricted access to water and their regular diet.
- Preoperative preparation
- Induce anesthesia using an overdose of isoflurane, followed by intraperitoneal administration of medetomidine (0.75 mg/kg), midazolam (4.0 mg/kg), and butorphanol (5.0 mg/kg) (following institutionally approved protocols).
- After confirming adequate anesthesia, remove the fur from the back of the mouse using a shaver.
NOTE: If a wound is caused by a fight at the site where a full-thickness skin defect will be created, avoid that area. - Disinfect the mouse's back with 70% ethanol.
- Autoclave scissors, forceps, and other instruments before use.
- Creation of a full-thickness skin excisional wound
- Grasp the skin on the mouse's back in a horizontal section.
- Press a 4 mm biopsy punch against the skin to create two skin wounds directly above the spine.
3. Imaging wounds using a skin observation camera (Figure 2A–D)
- Capturing images
- Anesthetize the mouse with inhaled isoflurane delivered through the intratracheal route and place it in the prone position.
- Attach the adapter, which has a 6 mm diameter tip, to the skin observation camera (Figure 2B,C).
- Set the camera to Dermo mode (6 mm).
- Place the tip of the adapter firmly against the mouse's skin and capture an image (Figure 2D).
- NOTE: Be careful not to move the mouse's skin with the tip of the camera. Keep the Dermo camera tip in contact with the mouse skin to maintain a 6 mm field of view.
- Disinfect the tip of the adapter with 70% ethanol between animals and between repeated imaging of the same open wound.
4. Measurements and statistical analysis
- Measurement of wound area and calculating the closure rate
- Use ImageJ software version 1.54p to measure the wound area.
NOTE: Blind the assessor to the experimental groups to avoid measurement bias. - Use the Polygon Selection tool in ImageJ to outline the wound margin and measure the wound area.
- Calculate the wound closure rate as [(day 0 wound area − wound area at each time point) / day 0 wound area] × 100.
- Use ImageJ software version 1.54p to measure the wound area.
- Circularity index
- Open the image in ImageJ and outline the wound margin using the Polygon Selection tool.
- Select Shape descriptors in Set Measurements, then measure the wound and use the value shown as “Circ.” as the circularity index.
- Statistical analysis
- Analyze wound closure and circularity using a linear mixed-effects model in R version 4.6.0, with wound location, time, and their interaction as fixed effects and wound identity as a random effect. Perform post hoc comparisons between the midline and both sides groups at each time point using Sidak adjustment for multiple comparisons.
5. Tissue collection and section preparation
- Tissue collection
- Euthanize the mice using an overdose of isoflurane (following institutionally approved protocols).
- Use scissors to collect a skin sample.
- Soak the collected skin in a 4% paraformaldehyde solution at 4 °C overnight.
NOTE: To prevent deformation of the mouse skin, place the skin on thick paper and immerse it in the solution.
- Section preparation
- Wash three times for 10 min each with distilled water, then embed in paraffin using a fully automated embedding machine.
- Use a microtome to prepare 6 µm sections.
- Place the section in water at 37 °C to stretch the tissue.
- Transfer the sections to a slide of glass and dry overnight on a stretching plate at 37 °C.
6. Histological observations
- Masson’s trichrome stain
- Deparaffinize the glass slides by immersing them in xylene three times for 5 min each.
- Immerse the glass slides in 100% ethanol three times (5 min each), and in 90%, 80%, and 70% ethanol for 5 min each, then rehydrate them with distilled water.
- Soak in the first mordant for 20 min, then rinse under flowing water for 2 min.
- Incubate in Weigert's iron hematoxylin solution for 10 min, then rinse under flowing water for 10 min.
- Allow the sample to react with the second mordant for 30 s, rinse under running water for 1 min, and then soak it in a 1% acetic acid solution for 10 s.
- Incubate in 0.75% Orange G solution for 1 min, then rinse with a 1% acetic acid solution for 5 s.
- Incubate in Masson's stain solution B for 20 min, then rinse with a 1% acetic acid solution for 10 s.
- Allow to react in a 2.5% phosphotungstic acid solution for 15 min, then rinse with a 1% acetic acid solution for 5 s.
- Allow to react with aniline blue solution for 5 min, then rinse with a 1% acetic acid solution for 10 s.
- Sequentially immerse the slide in 70%, 80%, and 90% ethanol, followed by immersion in three changes of 100% ethanol and three changes of xylene. Then mount with a cover slip and seal it.
- Observe the stained sections under a microscope.
Results
No mice in the present study exhibited skin wounds due to fighting, apparent infection, excessive licking, or self-mutilation. Figure 1D shows the representative images captured using a digital dermo camera. Using this camera, it was possible to capture all images from a fixed height. Observing the changes over time at each wound site, the wounds created in the midline of the mouse back (No. 1–4) healed while remaining relatively circular (Figure 1D and Figure 3C). Variations in closure rate of midline wounds at 1 and 3 days after wound creation were observed, but these variations decreased thereafter (Figure 3A). In contrast, the wounds created on both sides of the spine (No. 5–8) became horizontally elongated and elliptical 1 day after creation (Figure 1D and Figure 3C). Linear mixed-effects model analysis revealed significant associations of wound location [F (1, 22) = 8.40, p = 0.0083], time [F (4, 88) = 14.40, p < 0.0001], and wound location × time interaction [F (4, 88) = 3.26, p = 0.0154] with wound circularity. Significant differences were observed between the two groups on days 3 and 7 (Figure 3C). These findings suggest that wounds created on either side of the spine become more distorted in shape than midline wounds. Furthermore, the wounds on the left side (No. 5 and 6) had a smaller wound area than those on the right side (No. 7 and 8) 1 day after wound creation (Figure 1D). The closure rates of the wounds created on both sides of the spine showed significant variations between the left and right sides at 1, 3, 5, and 7 days after wound creation (Figure 3B). Furthermore, the wound created relatively close to the spine (No. 7) closed more slowly than the remaining three wounds (No. 5, 6, 8) (Figure 1D and Figure 3B). These results suggest that even within the same individual, the closure rate may vary significantly depending on the wound location.
In comparison of closure rates of midline wounds with those of on either side of the spine, linear mixed-effects model analysis revealed significant effects of wound location [F (1, 22) = 22.01, p = 0.00011], time [F (4, 88) = 496.91, p < 0.0001], and the wound location × time interaction [F (4, 88) = 7.49, p < 0.0001] on wound closure. Post hoc comparisons with Sidak adjustment showed significantly greater wound closure in the bilateral group than in the midline group on days 1, 3, 5, and 7 (Figure 1D and Figure 3D).
Representative Masson’s trichrome-stained sections obtained 7 days after wound creation revealed re-epithelialization in both midline wounds and wounds on either side of the spine, as well as fibrous tissue formation (Figure 4).
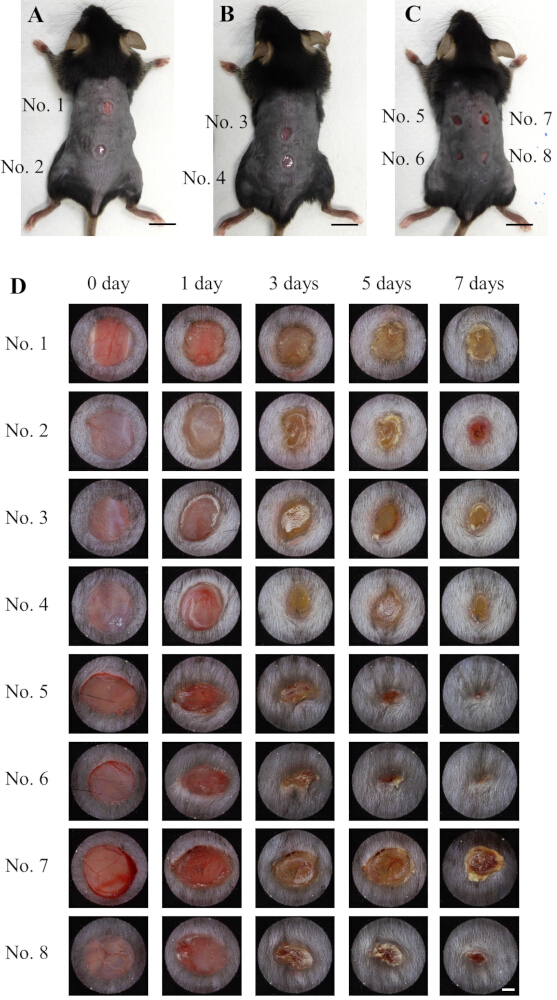
Figure 1: Location of the wound and the closure process. (A–C) Wounds created in this study. (D) Changes over time in each wound; diameter of the circle in the image = 6 mm. Scale bar = 1 cm (A–C); scale bar = 1 mm (D). Please click here to view a larger version of this figure.
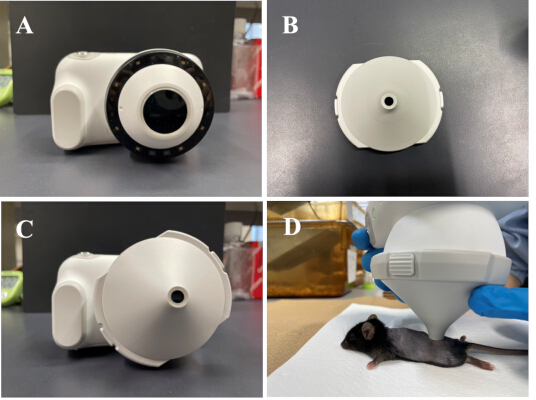
Figure 2: Dermo camera and methods for photographing wounds. (A) Dermo camera. (B) Adapter with a tip diameter of 6 mm. (C) Dermo camera with an adapter attached. (D) Photographing wounds using a dermal camera. Please click here to view a larger version of this figure.
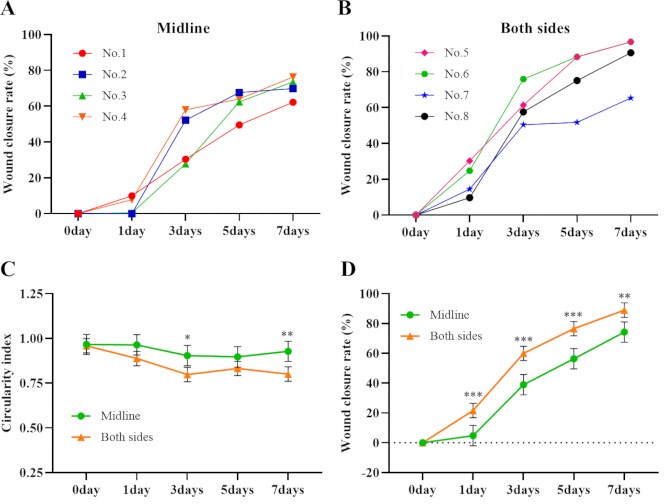
Figure 3: Wound closure rate. (A) Changes over time in the closure rate of representative wounds created in the midline of the mouse’s back. (B) Changes over time in the closure rate of representative wounds created in both sides of the spine. (C) Comparison of circularity index between the group of wounds created on the midline of the back of the mouse (n = 8 wounds/ 4 mice) and the group of wounds offset to either side of the spine (n = 16 wounds/ 4 mice) (estimated marginal mean ± 95% confidence interval; **p < 0.01, ***p < 0.001). (D) Comparison of closure rate between the group of wounds created on the midline of the back of the mouse (n = 8 wounds/ 4 mice) and the wounds offset to each side of the spine (n = 16 wounds/ 4 mice) (estimated marginal mean ± 95% confidence interval; *p < 0.05, **p < 0.01). Please click here to view a larger version of this figure.
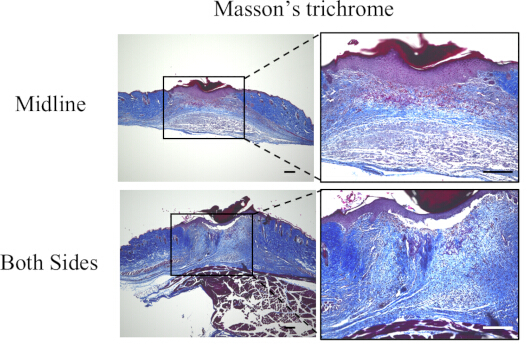
Figure 4: Masson’s trichrome-stained images. These images show representative stained sections of a midline wound and wounds on each side of the spine after 7 days. Scale bar = 100 µm. Please click here to view a larger version of this figure.
Discussion
Wounds were created at the midline of the back of the mouse or on both sides of the spine using a biopsy punch. These methods are commonly used in wound-healing studies involving mice10,11. Because skin retraction contributes to wound closure in mice, silicone splint rings are sometimes used12. This method requires suturing the ring directly to the skin of the mouse, which may increase stress on the animal and procedural burden13. Therefore, in the present study, we observed wound closure without application at the wound site. Consequently, wounds created on both sides of the spine were closer to those created at the midline. This suggests that when wound-healing speed is used as an outcome measure, it is not advisable to compare mouse models across different wound locations. Furthermore, creating a midline wound is considered more suitable for evaluating wound healing because it heals with less variation and retains a relatively circular shape compared with wounds created on both sides of the spine.
In addition to measurements of closure rate, histological analyses, such as re-epithelialization and extracellular matrix remodeling, are essential for evaluating wound healing. Creating wounds on both sides of the spine allows securing more wounds suitable for analysis in a small number of mice. Therefore, when creating wounds on both sides of the spine, it is necessary to consider that differences in wound morphology and closure may occur depending on the wound site, even within the same individual.
While digital planar imaging is useful for evaluating wound healing, imaging conditions can significantly impact quantitative results. Foltynski et al. reported that the use of two rulers for calibration can correct for camera tilt relative to the wound8. Barcenas et al. demonstrated the importance of standardizing lighting intensity, distance between camera and wound, camera angle relative to the wound, and mouse position during image acquisition9. The Dermo camera used in this study made it possible to meet these conditions easily by firmly pressing the tip of the adapter against the skin of the mouse, thereby enabling stable quantification. These results suggest that a Dermo Camera can be used to evaluate wound healing in mice.
This study had some limitations. First, considering animal welfare, the number of mice was limited to four per group, which should be considered when interpreting our findings. Second, we investigated the effects of differences in wound location in a mouse model of full-thickness skin excision. In recent years, the number of patients with cancer has increased, and the occurrence of radiation-induced skin injury has become a frequent concern14. Further research is thus required to determine whether the irradiation site affects mouse models of radiation-induced skin injury. Third, our histological evaluations were limited to qualitative observations. No quantitative analysis was performed. Further detailed investigations are thus required.
As the population ages, the number of patients with intractable skin diseases increases, and preclinical studies in animal models are essential for the development of effective treatments3. However, when using mice, experiments must be conducted to determine whether wound location affects healing.
Disclosures
The authors declare no conflicts of interest.
Acknowledgements
This work was supported by a grant from the Japan Society for the Promotion of Science, KAKENHI (Grant No. 25K02800), awarded to Ryoichi Mori, and funding from the Atomic Bomb Disease Institute, Nagasaki University, for all authors.
Materials
| Name | Company | Catalog Number | Comments |
|---|---|---|---|
| 0.75% Orange G Solution | MUTO PURE CHEMICALS CO.,LTD. | No. 40231 | |
| 2.5% Phosphotungstic Acid Solution | MUTO PURE CHEMICALS CO.,LTD. | No. 40182 | |
| 4% paraformaldehyde phosphate buffer solution | nacalai tesque | 09154-85 | |
| Acetic Acid | nacalai tesque | 08885-45 | |
| Aniline Blue Solution | MUTO PURE CHEMICALS CO.,LTD. | No. 40201 | |
| Biopsy punch | KAI | BP-40F | |
| Butorphanol | Meiji Animal Health | ||
| C57/BL6J | Japan SLC | ||
| Dermo camera | CASIO | DZ-D100 | |
| Ethanol | Japan Alchohol Trading CO., LTD | ||
| Excelsior AS embedding device | Shandon Diagnostics | A82300001 | |
| First Mordant | MUTO PURE CHEMICALS CO.,LTD. | No. 40061 | |
| Histo Core BIOCUT | Leica | 14051756235 | |
| Hot plate for paraffin section stretching | Sakura Finetek | PS-51 | |
| HS All-in One Fluorescence Microscope BZ-9000 | KEYENCE | ||
| ImageJ | NIH | version 1.54p | |
| Isoflurane | Wako | 4548995008299 | |
| Isotemp Water Baths | Fisher Scientific | GPD 02 | |
| Marinol 750cps | MUTO PURE CHEMICALS CO.,LTD. | 20091 | |
| Masson Stain Solution B | MUTO PURE CHEMICALS CO.,LTD. | No. 40251 | |
| Medetomidine | Kyoritu Seiyaku | ||
| Micro cover glass | MUTO PURE CHEMICALS CO.,LTD. | 24242 | |
| Micro Slides | MUTO PURE CHEMICALS CO.,LTD. | 271221 | |
| Midazolam | Wako | 4987481398337 | |
| PathoClean | Wako | 169-28327 | |
| R | R Foundation for Statistical Computing | version 4.6.0 | |
| Second Mordant | MUTO PURE CHEMICALS CO.,LTD. | No. 81411 | |
| Small diameter (6 mm) adapter | CASIO | DAS-100M | |
| Weigert's Iron Hematoxylin Solution 1 | MUTO PURE CHEMICALS CO.,LTD. | No. 40341 | |
| Weigert's Iron Hematoxylin Solution 2 | MUTO PURE CHEMICALS CO.,LTD. | No. 40351 |
References
- Graves N, Phillips CJ, Harding K. A narrative review of the epidemiology and economics of chronic wounds. Br J Dermatol. 2022;187(2):141-148.
- Pang Y, Du Y, Zhou W, Liu S, Yuan Y. Trend analysis of pressure ulcers in adults 60 years and older from 1990 to 2021 using joinpoint regression and Bayesian age period cohort models. Sci Rep. 2025;15(1):25198.
- Wu J, Xu N. Investigation of skin wound healing using a mouse model. Methods Mol Biol. 2020;2154:239-247.
- Fischer KS, et al. Protocol for the splinted, human-like excisional wound model in mice. Bio Protoc. 2023;13(3):e4606.
- Moreira C, Cassini-Vieira P, da Silva M, Barcelos L. Skin wound healing model-excisional wounding and assessment of lesion area. Bio Protoc. 2015;5(22): DOI:10.21769/BioProtoc.1661.
- Rogers LC, Bevilacqua NJ, Armstrong DG, Andros G. Digital planimetry results in more accurate wound measurements: a comparison to standard ruler measurements. J Diabetes Sci Technol. 2010;4(4):799-802.
- Huang CX, et al. Comparison of digital and traditional skin wound closure assessment methods in mice. Lab Anim Res. 2023;39:25.
- Foltynski P, et al. Wound area measurement with digital planimetry: improved accuracy and precision with calibration based on 2 rulers. PLoS One. 2015;10(8):134622.
- Bárcenas-García AE, et al. Digital planimetry for assessing wound closure kinetics in a mouse model. J Vis Exp. 2025;215:e67475.
- Yampolsky M, Bachelet I, Fuchs Y. Reproducible strategy for excisional skin-wound-healing studies in mice. Nat Protoc. 2024;19(1):184-206.
- Rhea L, Dunnwald M. Murine excisional wound healing model and histological morphometric wound analysis. J Vis Exp. 2020;(162):61616.
- Galiano RD, Michaels J 5th, Dobryansky M, Levine JP, Gurtner GC. Quantitative and reproducible murine model of excisional wound healing. Wound Repair Regen. 2004;12(4):485-492.
- Miller AW, Anderson AR, Suarez-Arnedo A, Segura T. Wound healing splinting devices for faster access and use. JID Innov. 2024;5(2):100332.
- Cheng J, Dong J, Fang Y, Zhang X, Dang X. Radiation-induced skin injury: a review of pathophysiology, assessment, management, and re-irradiation protocols. Front Oncol. 2026;15:1736717.