This protocol aims to use Mendelian randomization (MR) and NHANES data to investigate links between lifestyle, diet, and urinary stones.
Research Article
Causal Effects of Lifestyle and Dietary Factors on Urinary Stone Risk in a Genetic and Population-Based Study
July 7th, 2026
Shiyu Xu*1,2 , Jiaxi Fang*3 , Xiaoyu Wang*4 , Shuli Li1 , Wentao Shi5 , Honglin Liu6 , Shuai Ma7 , Wei Zhou1
1Department of Nephrology, Children's Hospital, Zhejiang University School of Medicine, National Clinical Research Center for Children and Adolescents' Health and Diseases, 2School of public health, Shanghai Jiao Tong University School of Medicine, 3Department of Ultrasound, Taizhou Central Hospital, 4Division of Gastroenterology and Hepatology, NHC Key Laboratory of Digestive Diseases, Renji Hospital, Shanghai Jiao Tong University School of Medicine, Shanghai Institute of Digestive Disease, 5Clinical Research Unit, Shanghai Ninth People's Hospital, Shanghai Jiao Tong University School of Medicine, 6Department of Clinical Laboratory, Zhongshan Second People's Hospital, 7Department of Nephrology, Shanghai Ninth People's Hospital, Shanghai Jiao Tong University School of Medicine
Opens in a new tab
In This Article
Summary
Loading...
$$\rightleftharpoonup{xx}$$
$$\longleftharp{xx}$$,
$$\longrightharp{xx}$$,
Abstract
Loading...
$$\rightleftharpoonup{xx}$$
$$\longleftharp{xx}$$,
$$\longrightharp{xx}$$,
This study evaluated how lifestyle habits and dietary factors influence urinary stone risk by integrating Mendelian randomization (MR) analysis with data from the National Health and Nutrition Examination Survey (NHANES). Instrumental variables were obtained from genome-wide association study datasets, while urinary stone outcomes were sourced from the FinnGen database. The primary MR analysis used the inverse-variance weighted approach, and additional MR methods verified the robustness of the findings. NHANES data further assessed the relationships between lifestyle characteristics, dietary patterns, and kidney stone occurrence. The MR analysis demonstrated that higher pre-tax income was inversely associated with urinary stone risk. Greater consumption of fresh fruits and tea, along with increased intake of potassium and vitamin E, also correlated with a lower likelihood of stone formation. NHANES analysis identified sleep deprivation, sleep disorders, depression, and elevated body mass index as significant risk factors for nephrolithiasis. In addition, pro-inflammatory dietary patterns characterized by higher Dietary Inflammatory Index scores increased stone risk, whereas adherence to HEI-2020, DASH, and aMED dietary patterns showed protective associations. These findings provide further insight into modifiable dietary and lifestyle determinants of urinary stone disease and may support the development of preventive and therapeutic strategies.
Introduction
Loading...
$$\rightleftharpoonup{xx}$$
$$\longleftharp{xx}$$,
$$\longrightharp{xx}$$,
The global incidence of urinary stones has escalated, affecting approximately 10% of the world's population at some point in their lives, with higher prevalence rates observed in industrialized countries1,2,3. This condition imposes a significant burden on healthcare systems because of the costs associated with diagnosis, treatment, and management of recurrent stone episodes. Additionally, urinary stones can lead to severe complications, including renal colic, hematuria, urinary tract infections, and chronic kidney disease, thereby affecting the patients' quality of life and increasing morbidity4,5.
Despite its high prevalence and substantial healthcare burden, the pathogenesis of urinary stones remains unclear. Current research has identified various risk factors associated with the formation of urinary stones, including dietary habits, fluid intake, obesity, metabolic disorders, and genetic predispositions6,7,8,9. While previous observational studies have individually linked various lifestyle behaviors or dietary factors to urinary stone risk, most have examined these exposures in isolation or without accounting for genetic confounding. Consequently, there is a critical need for robust methodologies to uncover the causal relationships between these risk factors and the development of urinary stones. Mendelian randomization (MR) is an analytical approach that utilizes genetic variants as instrumental variables to assess the causal effect of exposure on an outcome, thereby mitigating confounding and reverse causation10. By applying MR, researchers can strengthen causal inferences between risk factors and disease outcomes, thereby offering clearer insights into disease etiology.
In this study, we employed an MR approach to investigate the causal relationships between various risk factors and the risk of developing urinary stones. Moreover, we sought to validate our findings using data from the National Health and Nutrition Examination Survey (NHANES), a comprehensive and nationally representative dataset. By integrating genetic epidemiology with traditional epidemiological data, this study aimed to provide a more definitive understanding of the factors contributing to urinary stone formation and identify potential targets for prevention and intervention. We hypothesized that lifestyle and dietary factors exert causal effects on the risk of urinary stone formation, such that unhealthy behaviors increase risk while specific beneficial dietary components reduce risk.
Protocol
Loading...
$$\rightleftharpoonup{xx}$$
$$\longleftharp{xx}$$,
$$\longrightharp{xx}$$,
The research protocols for the National Health and Nutrition Examination Survey (NHANES) were approved by the Research Ethics Review Board (ERB) of the National Center for Health Statistics (NCHS). As NHANES datasets are publicly available, researchers do not need to seek separate approval from their own institutional review boards (IRBs). The summary statistics from this genome-wide association study (GWAS) are also publicly accessible. Consistent with the data repository’s terms of use and the approvals granted to the original study investigators, this secondary analysis did not require new IRB approval or additional individual informed consent. Each contributing GWAS study included details of ethical oversight and consent procedures in its original publication. All analyses were performed in accordance with institutional policies and the principles of the Declaration of Helsinki. The full protocol is detailed in Figure 1.
MR design
Two-sample MR is considered a method of identifying the causal relationship between the phenotype of exposure and the outcome with the use of genetic instruments (single-nucleotide polymorphisms [SNPs] ) as instrumental variables (IVs) from an accessible public dataset from large-sample genome-wide association studies (GWAS). By compensating for the typical drawbacks of residual confounding and reverse causality in observational studies, two-sample MR could reinforce the ability to infer the causality of an exposure-outcome association. A well-designed MR study was based on the following three assumptions: (i) relevance assumption: genetic variants are associated with risk factors; (ii) independence assumption: genetic variants are independent of confounding factors; and (iii) exclusion restriction assumption: genetic variants affect outcomes only through risk factors11,12.
Data source and selection of IVs
For this MR analysis, publicly available GWAS databases, including IEU openGWAS, the GWAS catalog, and published GWAS summary-level data, were searched to obtain eligible datasets for exposure. Therefore, additional ethical approval was not needed. The exposures were categorized into two groups: (i) lifestyle and (ii) dietary factors. For each exposure, the selection criteria were as follows: (1) the GWAS was conducted in individuals of European ancestry to minimize population stratification; (2) the sample size was sufficiently large (generally >100,000 participants) to ensure adequate statistical power for instrument variable selection; (3) the GWAS provided summary-level data including SNP-level effect estimates, standard errors, and p-values; and (4) the phenotype definition was consistent with our exposure of interest. When multiple datasets were available for the same exposure, we preferentially retained the dataset with the largest sample size, as larger samples provide more precise effect estimates and a greater number of genome-wide significant SNPs for use as instrumental variables. In cases where sample sizes were comparable, we selected the dataset with the most rigorous phenotype definition or the one that excluded overlapping samples with the outcome GWAS to avoid potential sample overlap bias.
Initially, we established a genome-wide significance threshold of p < 5E-8 to identify highly correlated SNPs with each exposure. However, due to the limited number of SNPs identified for certain potential risk factors when considered for exposure, we opted for a slightly higher cutoff ranging from p < 1E-7 to p < 1E-5. Detailed information on the exposures used in this study is provided in Supplementary Table 1. All SNPs were clumped to avoid the linkage disequilibrium under a strict clump window (r2 = 0.01 and kb = 5,000). Harmonization was performed in strict mode (action=3) to eliminate palindromic SNPs with intermediate allele frequencies. The strengths of the correlations between IVs and exposure factors were assessed using the F statistic, and IVs with F < 10 were eliminated to ensure the association strengths of genetic instruments for each putative risk factor and avoid weak instrument bias. Data for urinary stones (ncase = 9713, ncontrol = 366,693) were extracted from the FinnGen database (finngen_R9_N14_CALCUKIDUR), a large public project covering over 370,000 Finnish biobank participants13. Urinary stones were diagnosed according to the ICD-10.
MR statistical analysis
Instrumental variant selection, Mendelian randomization analyses, and data visualization were conducted in R using the packages that primarily support TwoSampleMR and MRPRESSO. Multiple MR approaches were applied, including the inverse-variance weighted random-effects model (IVW)14,15, MR-Egger16, weighted median17, weighted mode18, and simple mode19. The random-effects IVW model was used as the principal analytical approach because it provides reliable causal estimates through meta-analytic integration of Wald ratios for each instrumental variable when directional pleiotropy is not present. MR-Egger, weighted median, weighted mode, and simple mode analyses were additionally performed to evaluate the consistency and robustness of the findings.
Cochran’s Q statistic assessed heterogeneity among individual SNPs. Stability of the MR estimates was further examined through leave-one-out sensitivity analysis by sequentially removing each instrumental variable. The MR-Egger intercept test and the Mendelian Randomization Pleiotropy RESidual Sum and Outlier method evaluated the influence of pleiotropic and outlier SNPs on causal inference. Multiple-testing correction was performed using the Benjamini–Hochberg procedure with false discovery rate adjustment, and an adjusted p-value threshold of 0.0520 indicated statistical significance. Statistical power calculations for the MR analyses were conducted using an online tool available at https://sb452.shinyapps.io/power/. Causal associations were reported as odds ratios with corresponding 95% confidence intervals. All statistical analyses were carried out using R software version 4.2.2 developed by the R Foundation for Statistical Computing.
Observational study population and design
The 20,797 participants selected for the cross-sectional study were from the 2009–2020 cycle of the NHANES, a cross-sectional survey of a nationally representative sample of the U.S. civilian non-institutionalized population based on a stratified, multistage probability sampling design. The whole inclusion and exclusion criterion is shown in Supplementary Figure 1. Among the 24,593 participants who completed the Dietary Interview and the Kidney Conditions Questionnaire, those with missing data such as lifestyle and demographic information were excluded. All participants answered the Kidney Conditions Questionnaire and were asked “Ever had a kidney stones ? ” They were asked, A “ Yes ” answer was defined as a kidney stone.
Dietary pattern scores
Comprehensive dietary intake data were collected from NHANES participants to estimate energy consumption, nutrient intake, and additional food components derived from foods consumed during the 24-hour period preceding the interview. Because face-to-face dietary interviews provide greater accuracy and consistency, dietary data from the initial interview were used to evaluate diet quality and generate dietary quality indices. The Dietary Inflammatory Index (DII) was developed to assess the inflammatory characteristics of individual dietary patterns by incorporating 45 dietary components with either pro-inflammatory or anti-inflammatory properties21. Twenty-eight foods from the NHANES were used to calculate the DII. Higher positive DII scores were associated with greater pro-inflammatory capacity, whereas higher negative DII values were associated with greater anti-inflammatory capacity. The Healthy Eating Index-2020 (HEI-2020) is an updated version that assesses the fit between dietary intake and the new 2020–2025 U.S. Dietary Guidelines (DGA) and includes 13 groups: total fruits, whole fruits, vegetables and legumes, whole grains, dairy products, total protein foods, seafood and plant proteins, fatty acids, refined grains, sodium, added sugars, and saturated fat consumption22,23. The HEI-2020 scores range from 0 to 100, with higher scores reflecting healthier diets. The Dietary Approaches to Stop Hypertension (DASH) score consists of nine components (total fat, saturated fat, protein, fiber, cholesterol, calcium, magnesium, potassium, and sodium), with scores ranging from 0 to 9, with higher scores indicating greater adherence to the DASH dietary pattern24. The alternative Mediterranean Diet model (aMED) consists of nine components: vegetables, legumes, fruits, nuts, whole grains, red and processed meats, fish, alcohol, and the ratio of monounsaturated to saturated fats25. The aMed scores ranged from 0 to 9, with higher scores indicating greater adherence to the Mediterranean Diet model. All the dietary pattern scores described above were computed using the “dietaryindex” R package.
Lifestyle and covariates
Questionnaire data provided information on participant demographics, health conditions, and lifestyle characteristics, including age, sex, race or ethnicity, educational attainment, household income, physical activity, smoking habits, and alcohol consumption. Race and ethnicity were classified into non-Hispanic White, non-Hispanic Black, Mexican American, other Hispanic groups, and other racial or ethnic categories. Educational attainment was grouped into less than high school education and education beyond high school. Household income level was defined by the poverty income ratio (PIR): low (PIR < 1.30), moderate (1.30 ≤ PIR < 3.50), and high (≥ 3.50). A history of diabetic disease was obtained based on self-report (yes or no). Leisure time physical activity (LTPA) was categorized into three categories based on the intensity and duration of the exercise: moderate-intensity exercise < 75 min; 75–150 min; and ≥ 150 min, or vigorous activity ≥ 75 min. Sedentary behavior was classified as yes or no (≥ 6 and < 6 h) based on sedentary time. A depression score of ≥ 10 was categorized as a clinical depression threshold according to the PHQ-9 questionnaire score and depression. Smoking was categorized as having smoked (more than 100 cigarettes in total in the past). Alcohol consumption was categorized as never drinking, moderate drinking (≤ 2 drinks per day for men and ≤ 1 drink per day for women), and heavy drinking (> 2 drinks per day for men and > 1 drink per day for women). Sleep duration was classified into three categories (< 7, 7–9, and ≥ 9 h), and sleep problems were categorized as yes or no based on self-reporting. Body Mass Index (BMI) was categorized as thin or normal (< 25 kg/m2), overweight (25–30 kg/m2), or obese (> 30 kg/m2).
Statistical analysis
Participant characteristics were summarized for the overall study population and further categorized according to kidney stone status. Continuous variables were presented as mean values with standard errors, whereas categorical and ordinal variables were expressed as frequencies and percentages. Because NHANES uses a complex, nationally representative sampling design, 12-year sample weights were applied during the analyses. Logistic regression was used to assess the associations between dietary pattern scores, lifestyle, and kidney stones. In this case, the dietary pattern scores were divided into tertiles. In the regression models, Model 1 was adjusted for age (consecutive years), sex (male and female), and race (non-Hispanic white, non-Hispanic black, Hispanic, etc.), and additionally adjusted for education level, PIR, and history of diabetes in Model 2 based on Model 1. All analyses were two-sided tests, and a p-value < 0.05 was considered statistically significant. NHANES data were statistically analyzed using SAS, version 9.4.
Results
Loading...
$$\rightleftharpoonup{xx}$$
$$\longleftharp{xx}$$,
$$\longrightharp{xx}$$,
Mendelian randomization analysis of lifestyles with urinary stones
Figure 2 shows the random-effects IVW results between lifestyle factors and risk of urinary stones. We found that alcohol intake frequency (OR = 1.37, 95% CI = 1.14–1.66, p = 0.001) was causally associated with an elevated risk of urinary stones for genetically predicted 1-SD increases, whereas income before tax (OR = 0.31, 95% CI = 0.16–0.63, p = 0.001) showed a negative association with patients with urinary stones. After FDR adjustment, the results were robust. The supplementary methods show consistent coherent trends (Supplementary Figure 2, Supplementary Figure 3, Supplementary Figure 4, Supplementary Figure 5). The intercept test of the MR-Egger and MR-PRESSO tests indicated that MR analyses of urinary stones had no horizontal pleiotropy (p > 0.05). Leave-one-out analysis suggested that the observed result was not the effect of a single SNP (Supplementary Figure 6).
Mendelian randomization analysis of dietary factors with urinary stones
Figure 3 shows forest plots of the estimates for each exposure using the IVW MR analysis method, indicating that most of the diet-related factors had no genetic causal relationship with urinary stones. Fresh fruit intake (OR = 0.47, 95% CI = 0.25–0.87, p = 0.016), tea consumption (OR = 0.16, 95% CI = 0.05–0.49, p = 0.001), K (OR = 0.72, 95% CI = 0.57–0.91, p = 0.006), and vitamin E (OR = 0.61, 95% CI = 0.39–0.95, p = 0.029) were significantly associated with a decreased risk of urinary stones. After adjusting for FDR, the results were robust. The estimates were concordant and similar in size in MR-Egger, weighted median, weighted mode, and simple mode analyses, supporting a protective effect of the intake of fresh fruit, tea, K, and vitamin E against urinary stones (Supplementary Figure 7, Supplementary Figure 8, Supplementary Figure 9, Supplementary Figure 10). The intercept test of the MR Egger analysis and the MR-PRESSO test showed that there was no horizontal pleiotropy (p > 0.05) in the MR analyses. Leave-one-out analysis proved that our MR analyses were not driven by a single SNP (Supplementary Figure 11).
The Association Between Lifestyle, Diet, and urinary stones in NHANES 2009–2020
As shown in Supplementary Table 2, 20,797 participants were included in the analysis, of whom 2,037 had urinary stones. There were significant differences (p < 0.05) between the two groups, except for educational level (p = 0.557) and household income (p = 0.271). The results in Table 1 show that more alcohol consumption may significantly reduce the incidence of urinary stones (OR = 0.64, 95% CI = 0.46–0.89, p < 0.001), which is contrary to the findings of Mendelian randomization (Figure 2). In addition, sleep deprivation (OR = 1.21, 95% CI = 1.02–1.42, p = 0.027), sleep disorders (OR = 1.29, 95% CI = 1.09–1.52, p = 0.003), and depression increased the incidence of urinary stones. An elevated BMI was followed by an increased incidence of urinary stones (OR = 1.71, 95% CI = 1.42–2.06, p < 0.001). The DII diet was significantly positively associated with urinary stones (T2: OR = 1.22, 95% CI = 0.99–1.51; T3: OR = 1.38, 95% CI = 1.11–1.72), in contrast to the other three dietary patterns, which were significantly and negatively associated at T3 (p < 0.05). The results of the two models are generally consistent.
DATA AVAILABILITY:
The raw data for NHANES used in this study is publicly available via the NHANES repository at https://www.cdc.gov/nchs/nhanes/. The data for MR anlyasis in this study is accessed through the IEU OpenGWAS (https://gwas.mrcieu.ac.uk/) and FinnGen portal (https://www.finngen.fi/en) using documented accession identifiers. The outcome data is sourced from the following link: https://r9.risteys.finngen.fi/endpoints/N14_CALCUKIDUR. The exposure data is detailed in Supplementary Table 1. These datasets are all freely accessible to all individuals and organizations.
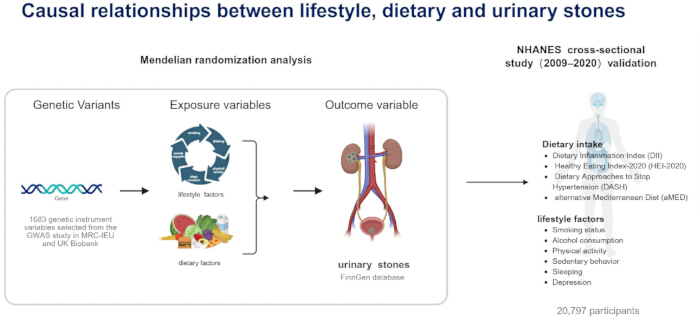
Figure 1: Flowchart of analysis in this study. Genetic variants associated with lifestyle and dietary factors were used in Mendelian randomization analyses to investigate causal relationships with urinary stone risk. NHANES cross-sectional data was also employed to analyze the relationship between lifestyle, dietary factors and urinary stone risk. Please click here to view a larger version of this figure.
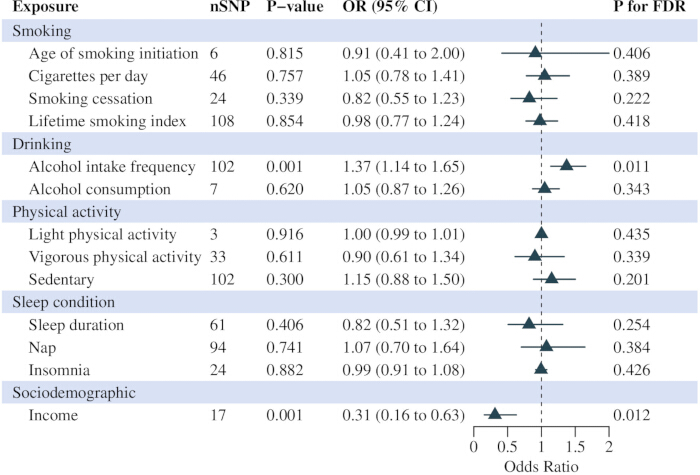
Figure 2: Lifestyle factors and their association with urinary stones (IVW). Odds ratios and 95% confidence intervals were calculated for smoking behavior, alcohol intake, physical activity, sleep condition, and sociodemographic factors. Horizontal error bars represent 95% confidence intervals for each odds ratio estimate. Please click here to view a larger version of this figure.
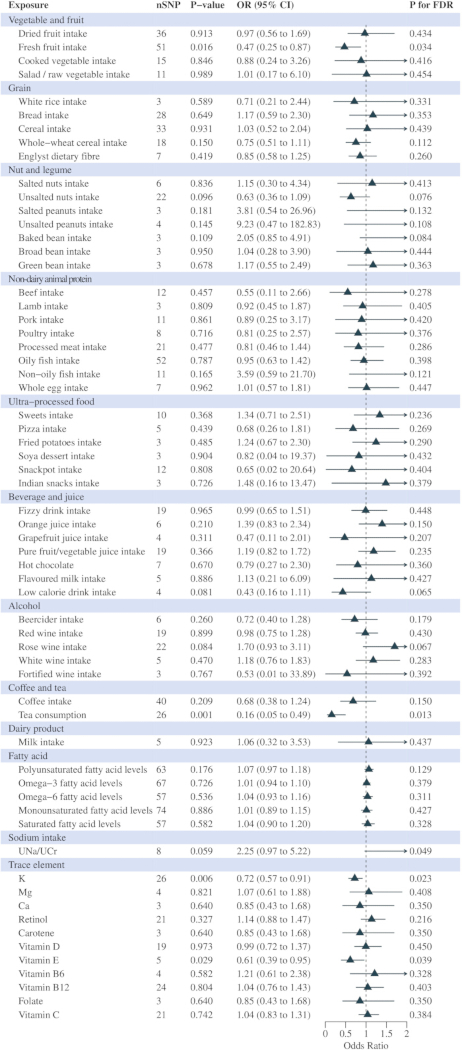
Figure 3: Dietary intake and their association with urinary stones (IVW). Odds ratios with 95% confidence intervals were calculated for multiple dietary exposures to evaluate their causal associations with urinary stone formation. Horizontal error bars represent 95% confidence intervals for each odds ratio estimate. Please click here to view a larger version of this figure.
| Lifestyles | Kidney Stone | |||||
| Model 1 | Model 2 | |||||
| OR | 95% CI | P-value | OR | 95% CI | P-value | |
| Smoking status | ||||||
| No-smoking | Reference | Reference | ||||
| Smoking | 1.08 | (0.87,1.34) | 0.489 | 1.03 | (0.83,1.29) | 0.767 |
| Alcohol consumption | ||||||
| No | Reference | Reference | ||||
| Moderate | 0.67 | (0.48,0.92) | 0.016 | 0.71 | (0.51,1.00) | 0.05 |
| Heavy | 0.6 | (0.43,0.84) | 0.003 | 0.64 | (0.46,0.89) | <0.001 |
| Physical activity | ||||||
| Inadequate | Reference | Reference | ||||
| Moderate | 0.88 | (0.65,1.19) | 0.386 | 0.91 | (0.66,1.24) | 0.531 |
| Adequate | 0.85 | (0.71,1.02) | 0.076 | 0.9 | (0.75,1.07) | 0.23 |
| Sedentary behavior | ||||||
| < 6 h | Reference | Reference | ||||
| ≥ 6 h | 1.03 | (0.88,1.21) | 0.72 | 1.02 | (0.87,1.20) | 0.772 |
| Sleeping time | ||||||
| < 6 h | 1.23 | (1.04,1.45) | 0.016 | 1.21 | (1.02,1.42) | 0.027 |
| 7-9 h | Reference | Reference | ||||
| ≥ 9 h | 0.96 | (0.75,1.23) | 0.743 | 0.93 | (0.73,1.18) | 0.525 |
| Sleeping problem | ||||||
| No | Reference | Reference | ||||
| Yes | 1.34 | (1.14,1.58) | <0.001 | 1.29 | (1.09,1.52) | 0.003 |
| Depression | ||||||
| No | Reference | Reference | ||||
| Yes | 1.64 | (1.16,2.33) | 0.006 | 1.53 | (1.05,2.22) | 0.029 |
| Body mass index | ||||||
| < 25 kg/m2 | Reference | Reference | ||||
| 25-30 kg/m2 | 1.16 | (0.91,1.49) | 0.236 | 1.15 | (0.89,1.48) | 0.284 |
| ≥ 30 kg/m2 | 1.84 | (1.53,2.21) | <0.001 | 1.71 | (1.42,2.06) | <0.001 |
| HEI-2020 | ||||||
| T1(< 45.40) | Reference | Reference | ||||
| T2(45.40-56.30) | 0.85 | (0.68,1.07) | 0.165 | 0.89 | (0.71,1.12) | 0.319 |
| T3(≥ 56.30) | 0.64 | (0.50,0.82) | <0.001 | 0.71 | (0.55,0.92) | 0.01 |
| DII | ||||||
| T1(< 0.44) | Reference | Reference | ||||
| T2(0.44-2.06) | 1.29 | (1.04,1.59) | 0.022 | 1.22 | (0.99,1.51) | 0.068 |
| T3(≥ 2.06) | 1.5 | (1.22,1.85) | <0.001 | 1.38 | (1.11,1.72) | 0.004 |
| aMed | ||||||
| T1(< 5.0) | Reference | Reference | ||||
| T2(5.0-6.0) | 0.85 | (0.66,1.09) | 0.202 | 0.86 | (0.67,1.10) | 0.227 |
| T3(≥ 6.0) | 0.73 | (0.56,0.97) | 0.028 | 0.79 | (0.61,1.04) | 0.091 |
| DASH | ||||||
| T1(< 2.90) | Reference | Reference | ||||
| T2(2.90-3.94) | 0.86 | (0.71,1.05) | 0.132 | 0.9 | (0.74,1.10) | 0.308 |
| T3(≥ 3.94) | 0.71 | (0.57,0.89) | 0.004 | 0.78 | (0.62,1.00) | 0.047 |
Table 1: Association between various lifestyles and urinary stones, NHANES 2009–2020. Odds ratios and 95% confidence intervals were calculated to evaluate associations between smoking status, alcohol consumption, physical activity, sedentary behavior, sleep duration, sleep problems, depression, body mass index, and dietary indices with urinary stone prevalence. Multivariable logistic regression models were adjusted for age, sex, gender, race or ethnicity, education level, family poverty income ratio, and history of diabetes. Values are presented as odds ratios with corresponding 95% confidence intervals and p-values. Model 1 adjusted for age, gender, and race/ethnicity; Model 2: Model 1+educational levels +family poverty income ratio+history of diabetes.
Supplementary Table 1: Characteristics of the GWAS summary data. Abbreviations: NA, not available; GWAS, genome-wide association study; MRC-IEU, Medical Research Council Integrative Epidemiology Unit; PMID, PubMed Unique Identifier; SNP, single-nucleotide polymorphism.Please click here to download this file.
Supplementary Table 2: Baseline characteristics: NHANES 2009–2020. Descriptive data were shown as mean (SE) while categorical variables were reported as n (%). P-values less than 0.05 (P-value < 0.05) were considered significant. Abbreviation: SE, standard error of mean; HEI, Healthy Eating Index; N, number.Please click here to download this file.
Supplementary Figure 1: Participant inclusion and exclusion in NHANES 2009–2020 kidney stone study. NHANES, National Health and Nutrition Examination Survey.Please click here to download this file.
Supplementary Figure 2: Lifestyle factors and their association with urinary stones (MR Egger).Please click here to download this file.
Supplementary Figure 3: Lifestyle factors and their association with urinary stones (weighted median). Please click here to download this file.
Supplementary Figure 4: Lifestyle factors and their association with urinary stones (weighted mode). Please click here to download this file.
Supplementary Figure 5: Lifestyle factors and their association with urinary stones (simple mode). Please click here to download this file.
Supplementary Figure 6: Lifestyle factors and their association with urinary stones (leave-one-out plots). Please click here to download this file.
Supplementary Figure 7: Dietary intake and their association with urinary stones (MR Egger). Please click here to download this file.
Supplementary Figure 8: Dietary intake and their association with urinary stones (weighted median). Please click here to download this file.
Supplementary Figure 9: Dietary intake and their association with urinary stones (weighted mode). Please click here to download this file.
Supplementary Figure 10: Dietary intake and their association with urinary stones (simple mode). Please click here to download this file.
Supplementary Figure 11: Dietary intake and their association with urinary stones (leave-one-out plot). Please click here to download this file.
Discussion
Loading...
$$\rightleftharpoonup{xx}$$
$$\longleftharp{xx}$$,
$$\longrightharp{xx}$$,
Based on Mendelian randomization findings, higher income, fresh fruit intake, tea consumption, and higher levels of potassium and vitamin E significantly reduce the risk of urinary stones. Based on NHANES data, insufficient sleep, sleep disorders, depression, high BMI, and a pro-inflammatory diet (high DII) increase the risk of kidney stones, whereas the HEI-2020, DASH, and aMED healthy dietary patterns reduce the risk.
The validity of this integrated Mendelian randomization (MR) and NHANES framework depends on several protocol-defined steps. SNP selection requires strict clumping (r2=0.01, kb=5,000) and harmonization to eliminate palindromic variants, with an F-statistic threshold above 10 to avoid weak instrument bias. A common issue is low SNP availability for exposures such as vitamin E, necessitating relaxed p-value thresholds (1E-5 to 1E-7); when this occurs, we recommend confirming results with stricter thresholds and recalculating F-statistics. For horizontal pleiotropy detected by MR-PRESSO, outlier SNPs should be removed. Compared with traditional observational studies that rely on self-reported diet and cannot exclude reverse causation, our MR approach uses genetic variants fixed at conception to provide stronger causal evidence. Unlike prior MR studies examining single exposures, our systematic evaluation of multiple lifestyle and dietary factors with FDR correction reduces selective reporting bias. The dual framework further offers triangulation by validating MR findings against nationally representative NHANES data. Aligning with the protocol, the use of relaxed p-value thresholds for low-heritability traits was justified by post-hoc F-statistics, supplementary MR methods consistently confirmed primary results, and leave-one-out sensitivity tests ensured robustness. Thus each protocol element directly contributed to causal validity and interpretability.
Our findings indicate that certain lifestyle and dietary factors play causal roles in the development of urinary stones. We observed a causal relationship between higher alcohol intake frequency and increased stone risk in both MR analysis and traditional epidemiological analysis, which is consistent with the results reported by Shringi et al. based on data from the NHANES 2007-2018 cycle26. Potential pathways include alcohol-induced dehydration, increased urinary uric acid and calcium excretion, and changes in urinary pH, all of which can favor stone formation27,28,29,30. Existing literature on the relationship between alcohol consumption and urinary stones presents a complex and conflicting picture. Some studies have suggested a potential inverse association, indicating a protective effect of alcohol31,32,33 and a meta-analysis has reported that higher alcohol consumption is associated with a lower incidence of urinary stones34. These results are consistent with the results of our analysis of the NHANES database. From a pathophysiological perspective, alcohol inhibits the secretion of antidiuretic hormone (ADH), thereby promoting diuresis and potentially reducing stone formation. However, long-term high-frequency alcohol consumption leads to urine concentration, resulting in elevated urinary concentrations of lithogenic substances such as calcium, oxalate, and uric acid, thereby increasing the probability of kidney stone formation. Overall, the causal relationship between alcohol consumption and urinary stones remains unclear and requires further research. Because Mendelian randomization offers a higher level of evidence than observational studies, its results should be preferentially considered. We also found that individuals with higher incomes are less likely to develop urinary stones than those with lower incomes. Similarly, a cohort study conducted by Eisner et al35 in 435 patients with urinary stones found that an increasing poverty level was associated with a significant increase in urine calcium.
The proposed mechanisms underlying the relationship between income and the risk of urinary stones are multifaceted. One possible explanation is that the observed association may be mediated by factors such as dietary patterns, hydration status, and overall health behaviors, which are often influenced by socioeconomic status. Interestingly, we also found that higher tea consumption was associated with a reduced stone risk. This is in line with previous research showing the protective effects of caffeine and other bioactive compounds in tea, such as polyphenols and various other phytochemicals, against stone formation, potentially through their diuretic, anti-inflammatory, and antioxidant properties36,37,38. The MR analysis conducted in this study also identified several dietary factors that appear to have a protective effect against urinary stones, such as fresh fruit, potassium, and vitamin E intake, In the NHANES study, healthier dietary patterns with lower DII scores, higher HEI-2020 scores, higher aMed scores, and higher DASH scores may play a protective role in the development of urinary stones. One study investigated the effects of fruits and vegetables in both healthy individuals and patients with hypocitraturia and urinary stones39. The results showed that complete elimination of fruits and vegetables from the diet in healthy subjects led to unfavorable changes in urinary stone risk factors, whereas supplementation with these foods significantly improved urine composition and decreased the relative saturation of calcium oxalate and uric acid in patients with hypermetric aciduria. These findings indicated that fruits and vegetables play important roles in the prevention of urinary stone formation. The inverse relationship between potassium intake and urinary stone risk observed in our study aligns with the known role of potassium in maintaining a healthy urinary pH and preventing the formation of uric acid and cystine stones40. Another interesting finding that warrants further investigation is the protective effect of high vitamin E levels. Vitamin E is an important antioxidant that may help mitigate oxidative stress and inflammation, and has been linked to the pathogenesis of urinary stones41,42. However, the specific mechanisms by which vitamin E influences stone formation are not yet fully understood and require further research.
However, the Mendelian randomization analysis and the use of the NHANES database in this study have several limitations. First, the three core assumptions of Mendelian randomization, namely the relevance assumption, the independence assumption, and the exclusion restriction assumption, may not be fully satisfied for all examined exposures. Violations of these assumptions could lead to biased causal estimates. Secondly, the availability and quality of GWAS summary statistics for certain exposures may be limited, which could potentially affect the statistical power and precision of the MR analyses. Additionally, the main limitation of the NHANES database is that its cross-sectional design precludes causal inference, and it may be subject to recall bias and unmeasured confounding factors.
Overall, the primary strength of this study is the use of an MR approach that leverages genetic variants as instrumental variables to infer the causal relationships between putative lifestyle and dietary factors and the outcome of urinary stones. Using genetic instruments, MR analysis can help overcome the limitations of traditional observational studies, such as residual confounding and reverse causation. The large-scale publicly available GWAS data used in this study also provided substantial statistical power to detect causal associations.
Acknowledgements
Loading...
$$\rightleftharpoonup{xx}$$
$$\longleftharp{xx}$$,
$$\longrightharp{xx}$$,
The work was supported by Medical and Health Science Program of Zhejiang Province (2025HY0499; 2025ZR046) and National Natural Science Foundation of China (82400854).
Materials
| Name | Company | Catalog Number | Comments |
|---|---|---|---|
| GWAS exposure databases | IEU OpenGWAS project | https://gwas.mrcieu.ac.uk/ | Publicly available genetic data related to exposure factors |
| GWAS outcome databases | FinnGen | https://www.finngen.fi/en | Publicly available genetic data related to kidney stones |
| NHANES 2009–2020 Demographics & Socioeconomic dataset | CDC NHANES | DEMO | Publicly available dataset with demographic, socioeconomic, and lifestyle variables |
| NHANES 2009–2020 Dietary intake | CDC NHANES | 24h recall | Dietary Intake Assessment |
| NHANES 2009–2020 Questionnaire | CDC NHANES | Questionnaire | Describe whether you have kidney stones |
| R | R Foundation | https://www.rproject.org(version 4.2.2 ) | Software used to analyze NHANES and mendelian data |
| SAS | SAS company | http://www.sas.com/(version 9.4) | Software used to analyze NHANES data |
References
Loading...
$$\rightleftharpoonup{xx}$$
$$\longleftharp{xx}$$,
$$\longrightharp{xx}$$,
- Edvardsson, V. O., Indridason, O. S., Haraldsson, G., Kjartansson, O., Palsson, R. Temporal trends in the incidence of kidney stone disease. Kidney Int. 83 (1), 146-152 (2013).
- Scales, C. D. Jr, Smith, A. C., Hanley, J. M., Saigal, C. S. Urologic Diseases in America Project. Prevalence of kidney stones in the united states. Eur Urol. 62 (1), 160-165 (2012).
- Romero, V., Akpinar, H., Assimos, D. G. Kidney stones: A global picture of prevalence, incidence, and associated risk factors. Rev Urol. 12 (2-3), e86-e96 (2010).
- Walter, K. Kidney stones. JAMA. 328 (9), 898(2022).
- Moe, O. W. Kidney stones: Pathophysiology and medical management. Lancet. 367 (9507), 333-344 (2006).
- Shavit, L., et al. Effect of being overweight on urinary metabolic risk factors for kidney stone formation. Nephrol Dial Transplant. 30 (4), 607-613 (2015).
- Ferraro, P. M., Taylor, E. N., Gambaro, G., Curhan, G. C. Dietary and lifestyle risk factors associated with incident kidney stones in men and women. J Urol. 198 (4), 858-863 (2017).
- Ferraro, P. M., Taylor, E. N., Curhan, G. C. Factors associated with sex differences in the risk of kidney stones. Nephrol Dial Transplant. 38 (1), 177-183 (2023).
- Soucie, J. M., Coates, R. J., Mcclellan, W., Austin, H., Thun, M. Relation between geographic variability in kidney stones prevalence and risk factors for stones. Am J Epidemiol. 143 (5), 487-495 (1996).
- Smith, G. D., Ebrahim, S. 'Mendelian randomization': Can genetic epidemiology contribute to understanding environmental determinants of disease? Int J Epidemiol. 32 (1), 1-22 (2003).
- Burgess, S., et al. Guidelines for performing mendelian randomization investigations: Update for summer 2023. Wellcome Open Res. 4, 186(2019).
- Emdin, C. A., Khera, A. V., Kathiresan, S. Mendelian randomization. JAMA. 318 (19), 1925-1926 (2017).
- Kurki, M. I., et al. Finngen provides genetic insights from a well-phenotyped isolated population. Nature. 613 (7944), 508-518 (2023).
- Burgess, S., Dudbridge, F., Thompson, S. G. Combining information on multiple instrumental variables in mendelian randomization: Comparison of allele score and summarized data methods. Stat Med. 35 (11), 1880-1906 (2016).
- Burgess, S., et al. Using published data in mendelian randomization: A blueprint for efficient identification of causal risk factors. Eur J Epidemiol. 30 (7), 543-552 (2015).
- Bowden, J., Davey Smith, G., Burgess, S. Mendelian randomization with invalid instruments: Effect estimation and bias detection through egger regression. Int J Epidemiol. 44 (2), 512-525 (2015).
- Bowden, J., Davey Smith, G., Haycock, P. C., Burgess, S. Consistent estimation in mendelian randomization with some invalid instruments using a weighted median estimator. Genet Epidemiol. 40 (4), 304-314 (2016).
- Hartwig, F. P., Davey Smith, G., Bowden, J. Robust inference in summary data mendelian randomization via the zero modal pleiotropy assumption. Int J Epidemiol. 46 (6), 1985-1998 (2017).
- Milne, R. L., et al. Identification of ten variants associated with risk of estrogen-receptor-negative breast cancer. Nat Genet. 49 (12), 1767-1778 (2017).
- Wang, H., Qiu, Y., Guo, H., Yin, Y., Liu, P. Information-incorporated gene network construction with fdr control. Bioinformatics. 40 (3), (2024).
- Zhao, L., Sun, Y., Liu, Y., Yan, Z., Peng, W. A j-shaped association between dietary inflammatory index (dii) and depression: A cross-sectional study from nhanes 2007-2018. J Affect Disord. 323, 257-263 (2023).
- Zhan, J. J., et al. Dietaryindex: A user-friendly and versatile r package for standardizing dietary pattern analysis in epidemiological and clinical studies. Am J Clin Nutr. 120 (5), 1165-1174 (2024).
- Jayanama, K., et al. Relationship between diet quality scores and the risk of frailty and mortality in adults across a wide age spectrum. BMC Med. 19 (1), 64(2021).
- Ferguson, C. C., Knol, L. L., Ellis, A. C. Visceral adiposity index and its association with dietary approaches to stop hypertension (dash) diet scores among older adults: National health and nutrition examination surveys 2011-2014. Clin Nutr. 40 (6), 4085-4089 (2021).
- Oddo, V. M., et al. Adherence to a mediterranean diet is associated with lower depressive symptoms among u.S. Adults. Nutrients. 14 (2), (2022).
- Shringi, S., Raker, C. A., Chonchol, M., Tang, J. Alcohol intake and prevalent kidney stone: The national health and nutrition examination survey 2007-2018. Nutrients. 16 (17), (2024).
- Yang, S., et al. Association between alcohol and urolithiasis: A mendelian randomization study. Urolithiasis. 51 (1), 103(2023).
- Siener, R. Impact of dietary habits on stone incidence. Urol Res. 34 (2), 131-133 (2006).
- Kuo, R. L., et al. Urine calcium and volume predict coverage of renal papilla by randall's plaque. Kidney Int. 64 (6), 2150-2154 (2003).
- Kramer, H. J., Choi, H. K., Atkinson, K., Stampfer, M., Curhan, G. C. The association between gout and nephrolithiasis in men: The health professionals' follow-up study. Kidney Int. 64 (3), 1022-1026 (2003).
- Kim, S. Y., Yoo, D. M., Bang, W. J., Choi, H. G. Obesity is positively associated and alcohol intake is negatively associated with nephrolithiasis. Nutrients. 14 (19), (2022).
- Ferraro, P. M., Taylor, E. N., Gambaro, G., Curhan, G. C. Soda and other beverages and the risk of kidney stones. Clin J Am Soc Nephrol. 8 (8), 1389-1395 (2013).
- Wang, H., et al. Consumption of tea, alcohol, and fruits and risk of kidney stones: A prospective cohort study in 0.5 million chinese adults. Nutrients. 13 (4), (2021).
- Wang, X., et al. Systematic review and meta-analysis of the effect of alcohol intake on the risk of urolithiasis including dose-response relationship. Urol Int. 94 (2), 194-204 (2015).
- Eisner, B. H., Sheth, S., Dretler, S. P., Herrick, B., Pais, V. M. Jr Effect of socioeconomic status on 24-hour urine composition in patients with nephrolithiasis. Urology. 80 (1), 43-47 (2012).
- Jeong, B. C., Kim, B. S., Kim, J. I., Kim, H. H. Effects of green tea on urinary stone formation: An in vivo and in vitro study. J Endourol. 20 (5), 356-361 (2006).
- Itoh, Y., et al. Preventive effects of green tea on renal stone formation and the role of oxidative stress in nephrolithiasis. J Urol. 173 (1), 271-275 (2005).
- Peerapen, P., Thongboonkerd, V. Caffeine prevents kidney stone formation by translocation of apical surface annexin a1 crystal-binding protein into cytoplasm: In vitro evidence. Sci Rep. 6, 38536(2016).
- Meschi, T., et al. The effect of fruits and vegetables on urinary stone risk factors. Kidney Int. 66 (6), 2402-2410 (2004).
- Wagner, C. A., Mohebbi, N. Urinary ph and stone formation. J Nephrol. 23, Suppl 16. S165-S169 (2010).
- Huang, H. S., Chen, J., Chen, C. F., Ma, M. C. Vitamin e attenuates crystal formation in rat kidneys: Roles of renal tubular cell death and crystallization inhibitors. Kidney Int. 70 (4), 699-710 (2006).
- Huang, H. S., Ma, M. C., Chen, J. Low-vitamin e diet exacerbates calcium oxalate crystal formation via enhanced oxidative stress in rat hyperoxaluric kidney. Am J Physiol Renal Physiol. 296 (1), F34-F45 (2009).
Reprints and Permissions
Request permission to reuse the text or figures of this JoVE article
Request Permission