This protocol describes the development and evaluation of an interpretable ensemble tree-based machine learning model using routinely collected clinical data to predict osteoporosis risk in patients with diabetes.
Research Article
Multimodel Interpretable Machine Learning for Osteoporosis Prediction in Diabetes Using a Large Critical Care Electronic Health Record Database
Opens in a new tab
In This Article
Summary
Loading...
$$\rightleftharpoonup{xx}$$
$$\longleftharp{xx}$$,
$$\longrightharp{xx}$$,
Abstract
Loading...
$$\rightleftharpoonup{xx}$$
$$\longleftharp{xx}$$,
$$\longrightharp{xx}$$,
Diabetes mellitus is associated with increased skeletal fragility and elevated fracture risk; however, early identification of osteoporosis (OP) in diabetic populations remains challenging. This study aimed to develop and compare multiple machine-learning (ML) models for predicting OP among patients with diabetes, while evaluating their clinical utility and enhancing model transparency using SHapley Additive exPlanations (SHAP). Using routinely collected demographic and laboratory data from the MIMIC-IV database, multiple ML algorithms, including tree ensembles, gradient boosting, and linear baselines, were trained and validated. Model performance was comprehensively evaluated using discrimination metrics, including the area under the receiver operating characteristic curve (AUC) and precision–recall analysis, as well as probability calibration curves and decision curve analysis (DCA) to assess net clinical benefit. The best-performing model was further interpreted using SHAP to quantify and visualize feature contributions at both global and individual levels. Among all evaluated models, ensemble tree-based methods showed improved performance. The ExtraTrees classifier achieved the highest validation performance (AUC = 0.862; average precision = 0.866). Furthermore, the selected model exhibited excellent probability calibration (Brier score = 0.154) and demonstrated substantial net clinical benefit across a wide range of risk thresholds in the DCA. SHAP analysis identified gender and age as the most influential predictors, followed by routine hematologic and metabolic laboratory indicators. Local explanations provided clinically interpretable insights into individual predictions. An interpretable ensemble tree-based model effectively predicts OP risk in patients with diabetes using routinely available clinical variables. The integration of SHAP improves clinical transparency, and strong calibration coupled with positive net clinical benefit supports its potential implementation as a reliable decision-support tool for early OP risk stratification in diabetic populations.
Introduction
Loading...
$$\rightleftharpoonup{xx}$$
$$\longleftharp{xx}$$,
$$\longrightharp{xx}$$,
Diabetes mellitus and osteoporosis (OP) are highly prevalent chronic conditions that increasingly coexist, creating a substantial burden through fragility fractures, disability, and healthcare costs. In patients with type 2 diabetes (T2D), fracture risk is paradoxically elevated even when areal bone mineral density (BMD) measured by dual-energy X-ray absorptiometry (DXA) is preserved or higher than expected, highlighting that bone “quality” and systemic metabolic factors contribute importantly to skeletal fragility1,2. Despite DXA being the clinical standard for diagnosing OP, its accessibility and uptake remain limited in many settings, and DXA-based assessment may undercapture diabetes-related skeletal risk. At the population level, meta-analytic evidence suggests that OP is common among individuals with diabetes, though prevalence estimates vary across cohorts and clinical contexts3. Therefore, there is a critical clinical need and strong motivation to develop pragmatic, scalable risk-prediction tools that leverage routinely collected clinical data to identify high-risk patients earlier, thereby guiding targeted screening and individualized prevention strategies.
In recent years, machine learning (ML) methods have been increasingly used to model complex, non-linear relationships in clinical data and to build OP risk predictors for patients with diabetes. Prior studies have demonstrated promising discrimination using algorithms such as gradient boosting, support vector machines, neural networks, and nomogram-style tools. Specifically, recent advancements have explored innovative modeling strategies, such as the fusion of ML with fuzzy logic, to predict OP and diabetes-related risks based on modifiable factors4,5,6. However, a significant research gap remains: many existing models were developed in restricted subgroups (e.g., exclusively postmenopausal women or elderly T2D patients) and evaluated within a limited set of candidate algorithms, leaving uncertainty about which modeling choices are optimal for broader diabetic populations and heterogeneous electronic health record (EHR) data. Furthermore, a critical barrier to the clinical adoption of these high-performing ML models is their “black box” nature, which limits clinician trust and hinders translation into actionable decision support. SHapley Additive exPlanations (SHAP) provides a solution by offering case-level explanations, attributing each prediction to individual features using Shapley values, thereby enabling clinicians to verify whether the model’s reasoning aligns with clinical plausibility.
To address these gaps, we developed and validated an OP risk prediction framework for patients with diabetes using the Medical Information Mart for Intensive Care IV (MIMIC-IV) critical care EHR database7. The novelty of this study lies in the comprehensive benchmarking across multiple ML model families combined with transparent SHAP-based interpretability within a large, clinically complex diabetic cohort. Unlike studies centered on a single algorithm, our end-to-end approach systematically selects the best-performing model based on rigorous validation and provides transparent, patient-level explanations. This framework aims to deliver both robust predictive performance and clinically actionable insights, supporting earlier risk stratification for OP among patients with diabetes.
Protocol
Loading...
$$\rightleftharpoonup{xx}$$
$$\longleftharp{xx}$$,
$$\longrightharp{xx}$$,
Data source and ethics statement
This retrospective study used data from the MIMIC-IV (version 3.1), a publicly available, de-identified critical care EHR database hosted on PhysioNet. The database includes demographic information, vital signs, laboratory tests, diagnoses, procedures, and medications.
Access to MIMIC-IV requires credentialed authorization and adherence to the PhysioNet data use agreement and training requirements. The investigators completed the required training and were granted access (certificate number: 68351548). Because the database is de-identified, this study analyzed anonymized data and did not involve direct contact with patients; therefore, informed consent was not required. The complete, step-by-step executable modeling workflow is illustrated in Figure 1.
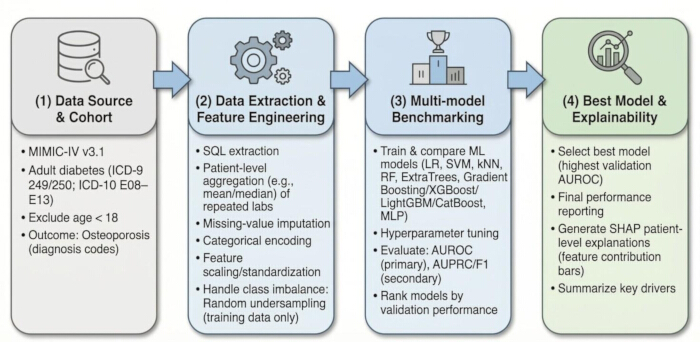
Figure 1. Overall modeling workflow for osteoporosis (OP) risk prediction in patients with diabetes. Schematic representation of the study pipeline, including cohort identification, data extraction, feature engineering, multi-model benchmarking, model selection based on validation performance, and SHAP-based interpretability of the final model. Please click here to view a larger version of this figure.
Study population and data extraction
Data were extracted from the Medical Information Mart for Intensive Care IV (MIMIC-IV) database using a database management tool. To ensure reproducibility, the exact SQL queries, including table names and filtering logic used for cohort retrieval, are provided in Supplementary File 1. Adult patients (≥18 years old) diagnosed with diabetes mellitus were identified using ICD-9 codes (249, 250) and ICD-10 codes (E08–E13). The primary outcome, OP, was defined using ICD-9 codes (733.x) and ICD-10 codes (M80, M81, M82). Within the initial eligible diabetic cohort (n = 46,226), 3,672 positive events (patients with OP) and 42,554 negative events (patients without OP) were identified. A detailed patient selection and attrition flowchart is presented in Figure 2.
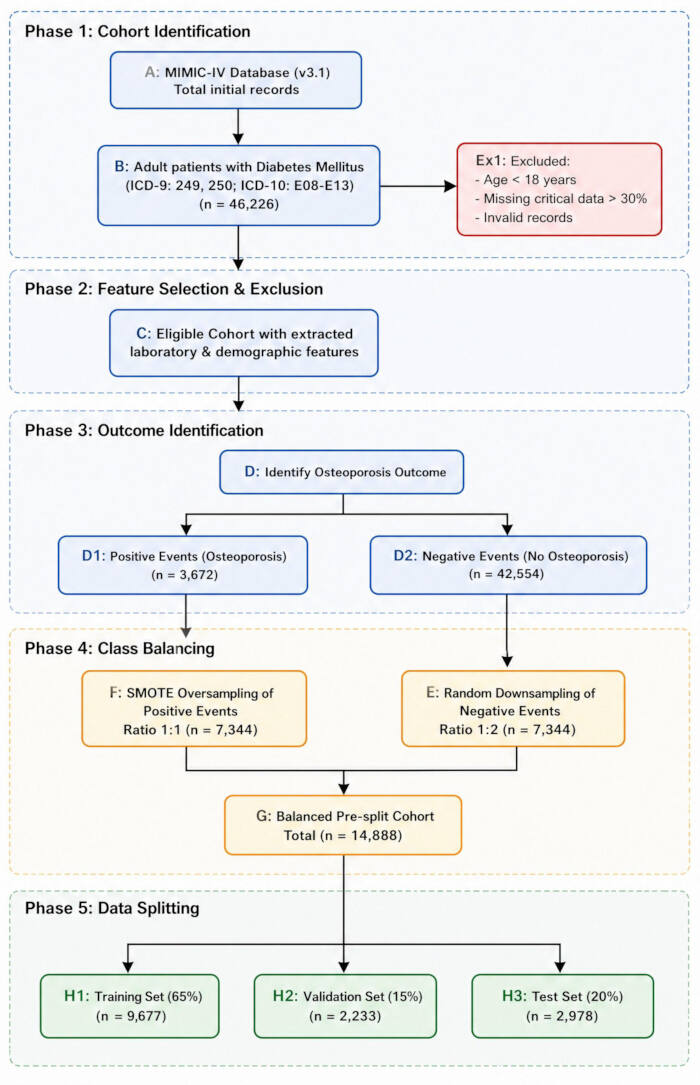
Figure 2. Flowchart of patient selection and cohort construction. The flowchart illustrates the stepwise cohort derivation from the MIMIC-IV (v3.1) database. Adult patients with diabetes mellitus were identified using ICD codes, followed by exclusion of patients with age <18 years, missing critical data >30%, or invalid records. The final cohort was divided into OP (positive events) and non-OP (negative events). Class imbalance was addressed using random undersampling and SMOTE applied to the training data prior to stratified dataset splitting. Please click here to view a larger version of this figure.
Feature engineering
To ensure fair benchmarking across multiple ML algorithms and precise reproducibility, an identical sequence of preprocessing steps was applied: feature selection, missing value imputation, continuous feature scaling, class balancing, and dataset splitting. The full list of input features, including variable names, units, and data sources, is detailed in Table 1.
| Features | Total (n = 14,688) | Training set (n = 9,546) | Validation set (n = 2,204) | Test set (n = 2,938) | P value |
| Gender | 0.345 | ||||
| Male | 6222 (42.36%) | 4045 (42.37%) | 935 (42.42%) | 1242 (42.27%) | |
| Female | 8466 (57.64%) | 5501 (57.63%) | 1269 (57.58%) | 1696 (57.73%) | |
| Age | 0.28 (−0.40, 0.94) | 0.28 (−0.43, 0.94) | 0.23 (−0.46, 0.89) | 0.28 (−0.39, 0.95) | 0.1655 |
| Red Blood Cells | −0.14 (−0.79, 0.49) | −0.13 (−0.79, 0.49) | −0.17 (−0.83, 0.48) | −0.14 (−0.76, 0.49) | 0.3641 |
| Hematocrit | −0.14 (−0.81, 0.52) | −0.13 (−0.80, 0.52) | −0.14 (−0.87, 0.51) | −0.16 (−0.81, 0.52) | 0.3709 |
| Hemoglobin | −0.12 (−0.79, 0.52) | −0.12 (−0.79, 0.51) | −0.15 (−0.86, 0.53) | −0.13 (−0.78, 0.52) | 0.3616 |
| RDW | −0.16 (−0.59, 0.45) | −0.17 (−0.59, 0.46) | −0.14 (−0.59, 0.45) | −0.17 (−0.60, 0.42) | 0.5803 |
| Phosphate | −0.14 (−0.60, 0.38) | −0.15 (−0.61, 0.38) | −0.11 (−0.57, 0.38) | −0.13 (−0.56, 0.34) | 0.415 |
| MCV | 0.05 (−0.50, 0.63) | 0.06 (−0.50, 0.65) | 0.03 (−0.49, 0.65) | 0.02 (−0.50, 0.59) | 0.5408 |
| Magnesium | −0.10 (−0.52, 0.37) | −0.10 (−0.52, 0.37) | −0.10 (−0.52, 0.37) | −0.09 (−0.50, 0.37) | 0.7797 |
| White Blood Cells | −0.16 (−0.47, 0.21) | −0.16 (−0.47, 0.20) | −0.15 (−0.48, 0.25) | −0.16 (−0.46, 0.20) | 0.6856 |
| Anion Gap | −0.12 (−0.64, 0.45) | −0.13 (−0.64, 0.45) | −0.07 (−0.61, 0.48) | −0.13 (−0.64, 0.45) | 0.1217 |
| Creatinine | −0.30 (−0.48, 0.01) | −0.30 (−0.48, 0.01) | −0.30 (−0.46, 0.01) | −0.30 (−0.48, −0.00) | 0.3323 |
| MCH | 0.11 (−0.48, 0.62) | 0.12 (−0.48, 0.62) | 0.11 (−0.47, 0.62) | 0.09 (−0.48, 0.61) | 0.5195 |
| Platelet Count | −0.09 (−0.61, 0.49) | −0.09 (−0.61, 0.49) | −0.08 (−0.62, 0.47) | −0.10 (−0.62, 0.48) | 0.9709 |
| MCHC | −0.00 (−0.59, 0.59) | −0.00 (−0.60, 0.59) | −0.00 (−0.57, 0.58) | 0.00 (−0.57, 0.60) | 0.9263 |
| Chloride | 0.05 (−0.54, 0.64) | 0.05 (−0.52, 0.65) | 0.03 (−0.59, 0.62) | 0.07 (−0.52, 0.62) | 0.4675 |
| Potassium | −0.07 (−0.67, 0.53) | −0.09 (−0.67, 0.53) | −0.07 (−0.67, 0.53) | −0.07 (−0.62, 0.53) | 0.3071 |
| Sodium | 0.05 (−0.56, 0.60) | 0.05 (−0.55, 0.60) | −0.00 (−0.60, 0.60) | 0.07 (−0.57, 0.61) | 0.3492 |
| Urea Nitrogen | −0.28 (−0.60, 0.29) | −0.28 (−0.60, 0.29) | −0.26 (−0.59, 0.31) | −0.28 (−0.59, 0.25) | 0.6826 |
| Total Calcium | 0.02 (−0.61, 0.59) | 0.02 (−0.61, 0.59) | −0.01 (−0.59, 0.56) | 0.01 (−0.61, 0.60) | 0.8203 |
Table 1. Baseline characteristics and engineered features of the study cohort. Categorical variables are presented as n (%). Continuous variables are presented as median (interquartile range) of standardized values. P values were calculated to compare distributions across the training, validation, and test sets using appropriate statistical tests.
Continuous variables with repeated measurements were aggregated using the arithmetic mean within the entire ICU stay observation window to yield a single feature vector per patient. Variables with a missingness rate exceeding 30% were excluded. For the remaining numerical variables, missing values were imputed using the K-Nearest Neighbors (KNN) algorithm (n_neighbors = 5, weights = 'uniform'). Categorical variables were imputed using the most frequent category and subsequently transformed using binary mapping, with any unseen categories assigned a vector of zeros.
Continuous variables were standardized using the z-score scaling formula (). Features exhibiting zero variance were explicitly removed prior to scaling. All preprocessing parameters (µ and σ.) were estimated strictly on the training set and applied consistently to the validation and test sets.
Given the severe class imbalance (3,672 vs. 42,554), a hybrid balancing strategy was applied exclusively to the training data to avoid inflating performance estimates. First, random undersampling was used to reduce the majority negative class to achieve a 1:2 (positive:negative) ratio (yielding 7,344 negative samples). Next, the Synthetic Minority Over-sampling Technique (SMOTE) was applied to the positive class to achieve a final 1:1 balanced ratio (7,344 vs. 7,344)8.
Finally, the cohort was split at the patient level into training (65%), validation (15%), and test (20%) sets using stratified sampling. To strictly control all random processes across imputation, balancing, and splitting, a global random seed (random_state = 42) was enforced.
Model architecture
To identify the most suitable predictive model for OP risk in patients with diabetes, a large-scale benchmarking framework was used to compare 70 ML algorithm variants under an identical data representation and evaluation protocol. Candidate model families included regularized linear classifiers, support vector machines (SVMs), kNN, tree ensembles, gradient boosting architectures, and multilayer perceptrons9,10,11,12,13,14,15,16,17.
Rather than using a traditional grid search, hyperparameter optimization was performed by evaluating predefined, robust configurations across these 70 model variants on the training split. Selection was strictly based on maximizing the area under the receiver operating characteristic (ROC) curve (AUC) on the validation set. The final best-performing model was configured with n_estimators = 200, with other parameters remaining at default settings of the software package listed in the Table of Materials. Evaluation metrics, including AUC, accuracy, F1-score, precision, and recall, were calculated using a default 0.5 probability threshold.
To support clinical transparency, SHAP was applied to the selected model using the TreeExplainer method. Given the tree-based nature of the final model, exact tree path-dependent expected values were used as the background configuration.
Results
Loading...
$$\rightleftharpoonup{xx}$$
$$\longleftharp{xx}$$,
$$\longrightharp{xx}$$,
Model performance comparison
To identify the optimal predictive approach for OP in patients with diabetes, multiple ML models were systematically compared. A regularized linear classifier (logistic regression) was included as a baseline control model. The overall performance comparison is summarized in Figures 3–6. Across all evaluated models, ensemble tree-based methods outperformed the linear baseline in terms of discriminative performance.
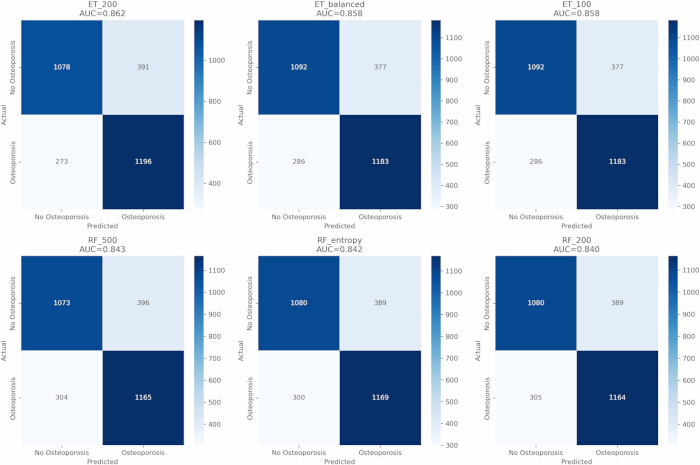
Figure 3. Confusion matrices of top-performing models. Confusion matrices for representative models evaluated on the validation set, including ET_200, ET_balanced, ET_100, RF_500, RF_entropy, and RF_200. Each matrix displays counts of true negatives, false positives, false negatives, and true positives, illustrating classification performance across models. Please click here to view a larger version of this figure.
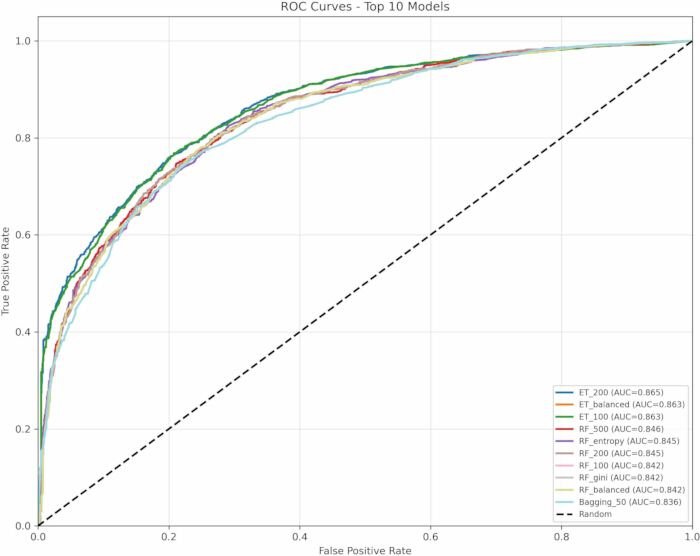
Figure 4. Receiver operating characteristic (ROC) curves for the top 10 models. ROC curves comparing the top-performing models. The x-axis represents the false positive rate and the y-axis represents the true positive rate. The diagonal dashed line indicates random classifier performance. Area under the curve (AUC) values for each model are provided in the legend. Please click here to view a larger version of this figure.
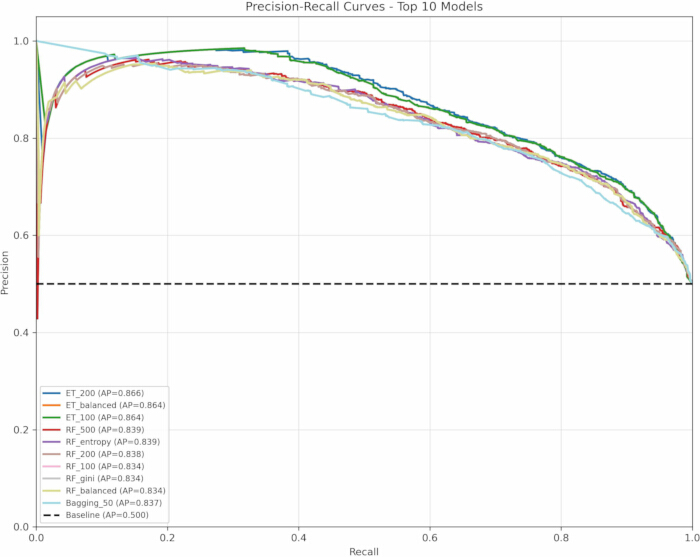
Figure 5. Precision–Recall curves for the top 10 models. Precision–Recall curves comparing model performance under class imbalance conditions. The x-axis represents recall and the y-axis represents precision. The horizontal dashed line indicates the baseline precision corresponding to class prevalence. Average precision (AP) values are provided in the legend. Please click here to view a larger version of this figure.
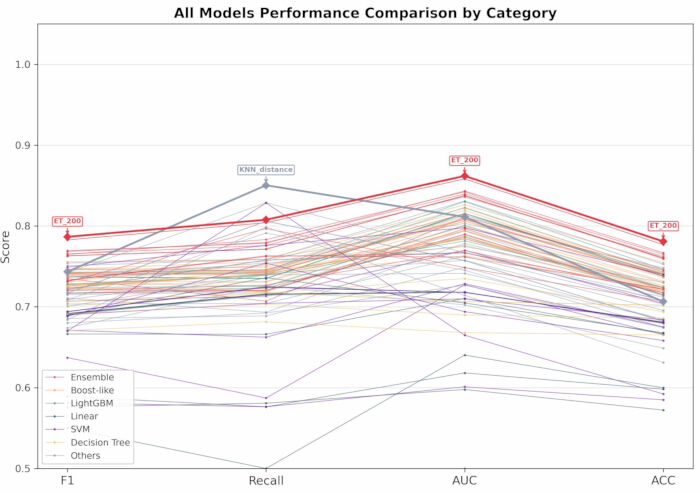
Figure 6. Performance comparison of all models by category. Comparison of model performance across evaluation metrics, including F1 score, recall, AUC, and accuracy (ACC). Models are grouped by category (ensemble, boosting-based, linear, support vector machine, decision tree, and others). Each line represents an individual model configuration, with top-performing configurations highlighted. Please click here to view a larger version of this figure.
Among these models, the ExtraTrees configuration with 200 estimators (ET_200) demonstrated the highest validation performance, achieving an AUC of 0.862, an accuracy of 0.781, an F1-score of 0.787, and a recall of 0.808 (Figure 6). ROC and precision–recall analyses further confirmed this result, with ET_200 achieving the highest ROC-AUC (0.865) and average precision (0.866) among the top-performing models (Figure 4 and Figure 5).
Calibration and clinical utility
To assess whether model discrimination translated into reliable probability estimates, calibration and clinical utility were evaluated. Calibration curves (Figure 7) showed that the top-performing models, particularly ET_200 (Brier score = 0.154), produced probability estimates that closely aligned with the ideal calibration line. Decision curve analysis (Figure 8) was performed to evaluate net clinical benefit across a range of threshold probabilities. The ET_200 model demonstrated consistently higher net benefit compared to the “treat-all” and “treat-none” strategies across a broad range of threshold probabilities, indicating its potential clinical utility.
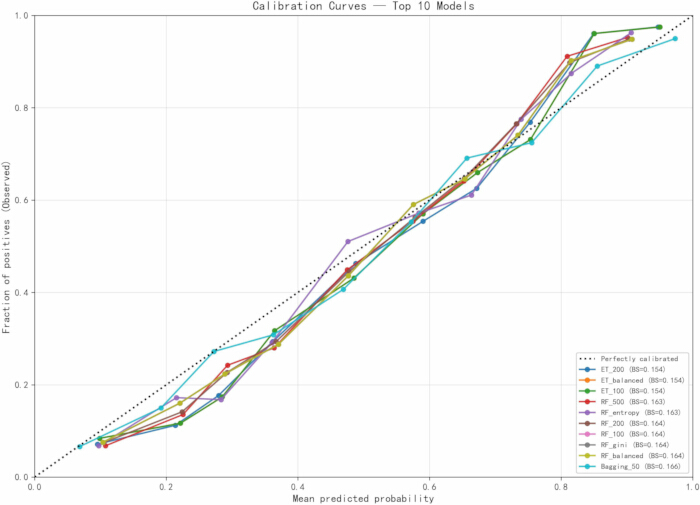
Figure 7. Calibration curves of the top-performing models. Calibration curves comparing predicted probabilities with observed outcome frequencies. The x-axis represents mean predicted probability and the y-axis represents the observed fraction of positive cases. The diagonal reference line indicates perfect calibration. Brier scores for each model are provided in the legend. Please click here to view a larger version of this figure.
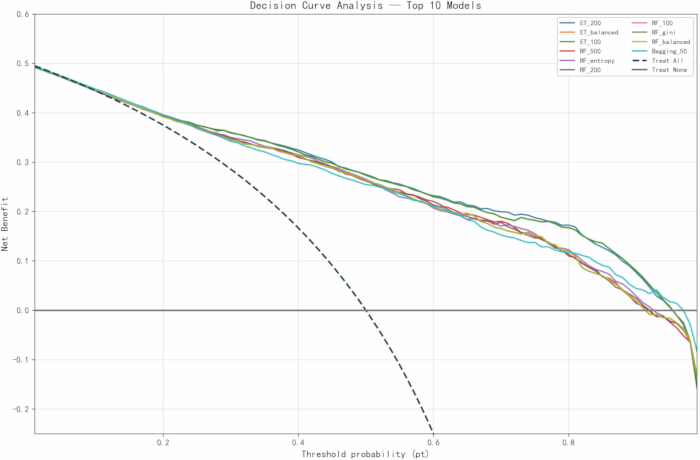
Figure 8. Decision curve analysis of the top-performing models. Decision curve analysis evaluating net clinical benefit across a range of threshold probabilities. The x-axis represents threshold probability and the y-axis represents net benefit. The horizontal line indicates the “treat none” strategy, and the sloped line indicates the “treat all” strategy. Models with curves above both baselines provide greater clinical utility. Please click here to view a larger version of this figure.
Model interpretability using SHAP
To improve interpretability, SHAP was applied to the selected model. Global feature importance analysis (Figure 9) identified gender and age as the most influential predictors, followed by routinely collected laboratory variables. The SHAP summary (beeswarm) plot (Figure 10) illustrated both the direction and distribution of feature effects across the cohort. Higher or lower feature values were associated with corresponding increases or decreases in predicted OP risk. SHAP dependence plots (Figure 11) further demonstrated the relationships between key features and their contributions to model predictions, providing insight into patient-level variability.
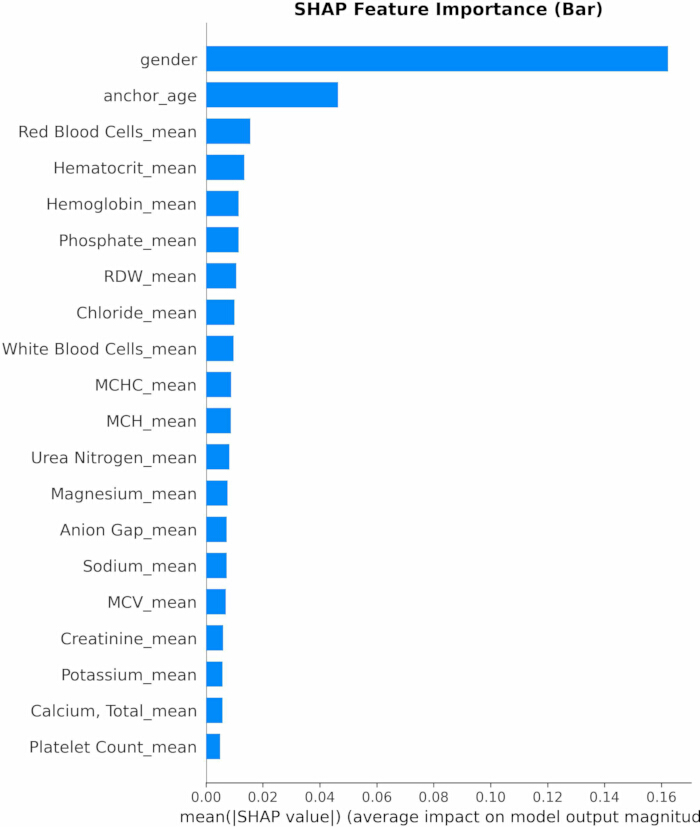
Figure 9. Global feature importance based on SHAP values. Bar plot showing the mean absolute SHAP values for each feature. Values represent the average magnitude of each feature’s contribution to the model output across all patients, indicating relative importance. Please click here to view a larger version of this figure.
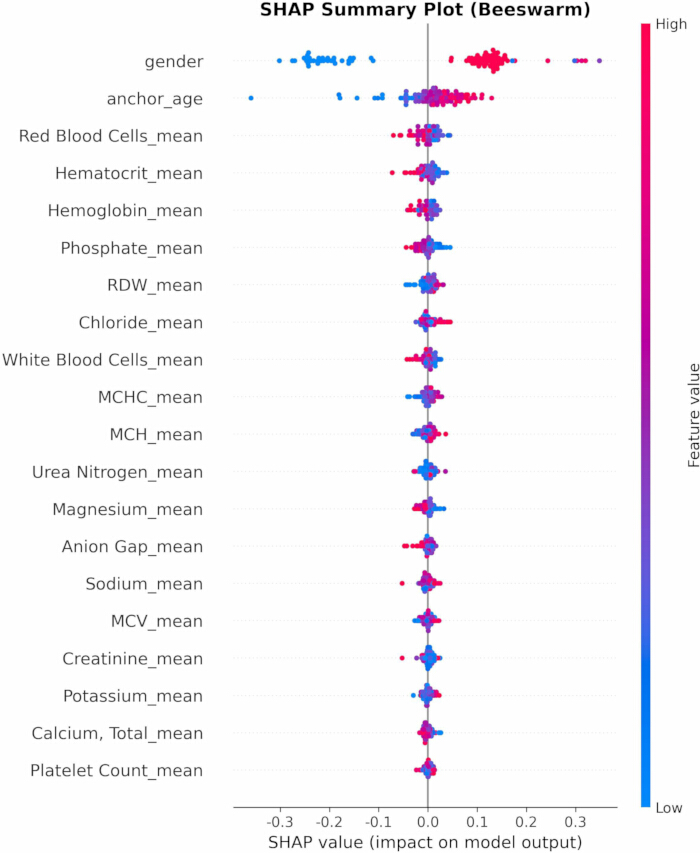
Figure 10. SHAP summary (beeswarm) plot for the selected model. Each point represents an individual patient. The x-axis shows SHAP values indicating the direction and magnitude of feature impact on the prediction. Color represents feature value (low to high). Features are ordered by overall importance. Please click here to view a larger version of this figure.
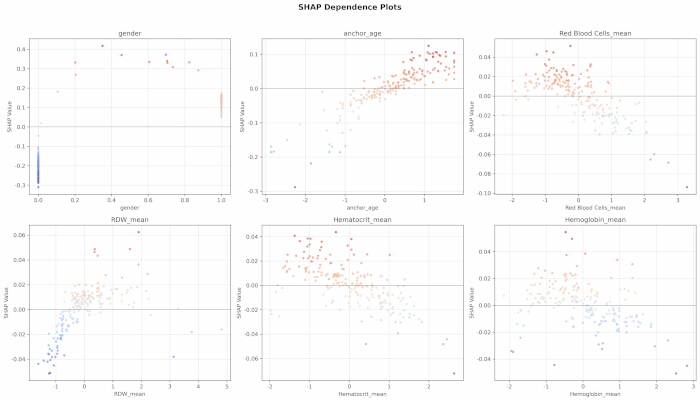
Figure 11. SHAP dependence plots for selected features. Scatter plots showing the relationship between feature values (x-axis) and corresponding SHAP values (y-axis). These plots illustrate how individual features influence model predictions and reveal potential non-linear effects across patients. Please click here to view a larger version of this figure.
In summary, an interpretable ensemble tree-based model (ExtraTrees) demonstrated strong performance for predicting OP risk in patients with diabetes using routinely collected clinical variables. Compared to the baseline linear model, the selected model showed improved discrimination, reliable probability calibration, and greater net clinical benefit. The integration of SHAP provided transparent interpretation of model predictions. These findings support the potential application of this approach for OP risk stratification in diabetic populations.
Data availability:
Data for this study were obtained from the publicly available Medical Information Mart for Intensive Care IV (MIMIC-IV, version 3.1) database hosted on PhysioNet (https://physionet.org/content/mimiciv/3.1/). Access to MIMIC-IV requires completion of the relevant training and a data use agreement; therefore, the authors are not permitted to directly share raw individual-level data. Aggregated data and analysis code used to construct and evaluate the prediction models are available from the corresponding author upon reasonable request.
Supplementary File 1. SQL scripts for cohort retrieval and data extraction from the MIMIC-IV database. This file contains the SQL queries used to identify the study cohort, define outcome variables, and extract patient demographics and laboratory measurements from the MIMIC-IV database. The queries were executed using PostgreSQL and are provided in full to ensure reproducibility of cohort construction and data extraction procedures.Please click here to download this file.
Discussion
Loading...
$$\rightleftharpoonup{xx}$$
$$\longleftharp{xx}$$,
$$\longrightharp{xx}$$,
In this study, multiple ML algorithms were systematically compared to identify an optimal predictive model for OP among patients with diabetes. Ensemble tree–based methods, particularly the ExtraTrees model, showed improved discrimination, reliable probability calibration, and greater net clinical benefit compared to linear baselines and other algorithm families. These findings indicate that nonlinear interactions and complex feature relationships are important for accurately capturing OP risk in diabetic populations.
To enhance clinical transparency, SHAP were applied to interpret the selected model. The analysis identified gender and age as the most influential predictors, consistent with established biological evidence linking aging and hormonal changes (e.g., estrogen deficiency or relative hypogonadism) to deterioration of bone microarchitecture. In addition to demographic factors, hematologic indices (e.g., hemoglobin and red cell distribution width) and routine metabolic chemistry measures contributed to risk prediction. These markers may reflect the cumulative physiological effects of chronic inflammation, renal dysfunction, and acid-base imbalance, which are associated with skeletal vulnerability in diabetes. Recent studies also highlight the role of nutritional status and modifiable lifestyle factors in diabetes–OP comorbidity18,19. The prominence of routinely collected laboratory variables suggests that the model captures broader systemic physiological processes relevant to bone health20,21,22.
From a clinical perspective, the combination of discrimination, probability calibration, and SHAP-based interpretability provides a useful basis for decision support. SHAP dependence plots further supported patient-level interpretation by illustrating non-linear and value-dependent relationships between clinical features and predicted risk. By leveraging routinely available EHR data, this framework may assist clinicians in identifying high-risk patients earlier and guide targeted screening and preventive strategies23,24,25.
While ensemble tree methods performed well in this setting, alternative approaches warrant further investigation. Future studies could explore deep learning models, such as recurrent neural networks, to incorporate longitudinal EHR data and capture temporal disease progression. In addition, integrating multi-modal data sources—such as imaging-derived bone density measures or unstructured clinical text—may improve predictive performance and provide a more comprehensive assessment of OP risk.
Despite these findings, several limitations should be acknowledged. First, the models were developed and validated using retrospective data from a single critical care database (MIMIC-IV), which may limit generalizability to broader patient populations. Second, certain clinically relevant variables—such as duration of diabetes, medication adherence, bone turnover markers, and dietary factors—were not available. Future prospective studies using multi-institutional datasets are needed to validate these findings and further evaluate the clinical utility of this approach.
Disclosures
Loading...
$$\rightleftharpoonup{xx}$$
$$\longleftharp{xx}$$,
$$\longrightharp{xx}$$,
The authors declare that the research was conducted in the absence of any commercial or financial relationships that could be construed as a potential conflict of interest.
Acknowledgements
Loading...
$$\rightleftharpoonup{xx}$$
$$\longleftharp{xx}$$,
$$\longrightharp{xx}$$,
The authors gratefully acknowledge the financial support from the Nantong Municipal Science and Technology Project (Grant No. JC2023039) and the Social Development Guidance Program of Nantong Science and Technology Bureau (Grant No. MSZ2023054).
Materials
| Name | Company | Catalog Number | Comments |
|---|---|---|---|
| CatBoost | Yandex | v1.2 (or applicable) | Gradient boosting algorithm optimized for categorical features |
| imbalanced-learn (SMOTE) | Scikit-learn Contrib | v0.11 (or applicable) | Library used to perform Synthetic Minority Over-sampling Technique for class balancing |
| LightGBM | Microsoft Corporation | v4.0 (or applicable) | Gradient boosting framework based on decision trees |
| Matplotlib | Matplotlib Development Team | v3.7 (or applicable) | Visualization library used for plotting figures and performance curves |
| MIMIC-IV Clinical Database | PhysioNet | v3.1 | Publicly available critical care electronic health record dataset used as the data source |
| Navicat Premium | PremiumSoft CyberTech Ltd. | v17.0 | Database management tool used for SQL-based data extraction |
| NumPy | NumPy Developers | v1.24 (or applicable) | Numerical computing library used for array operations and data processing |
| OpenPyXL | Eric Gazoni, Charlie Clark | v3.1 (or applicable) | Library used for reading and writing Excel files |
| Pandas | Pandas Development Team | v2.0 (or applicable) | Data manipulation and analysis library for structured datasets |
| PostgreSQL | PostgreSQL Global Development Group | v14 (or applicable) | Relational database system used to query and manage MIMIC-IV data |
| Python | Python Software Foundation | v3.8+ (or applicable) | Programming language used for data processing, modeling, and analysis |
| Scikit-learn | Scikit-learn Developers | v1.3 (or applicable) | Machine learning library used for model development, preprocessing, and evaluation |
| SciPy | SciPy Developers | v1.10 (or applicable) | Scientific computing library used for statistical analysis |
| Seaborn | Michael Waskom | v0.12 (or applicable) | Statistical data visualization library for enhanced graphical outputs |
| SHAP (SHapley Additive exPlanations) | Scott Lundberg | v0.42 (or applicable) | Framework used to interpret model predictions using feature attribution values |
| XGBoost | DMLC (Distributed Machine Learning Community) | v2.0 (or applicable) | Gradient boosting algorithm widely used for structured data modeling |
Reprints and Permissions
Request permission to reuse the text or figures of this JoVE article
Request Permission