Regional scanning electron microscopy (SEM)-energy-dispersive spectroscopy (EDS) was applied to retinal explants. Results showed residual iron at the injury bed and in the distal retina after removal of the iron foreign body, and the platform is suitable for investigating iron accumulation-triggered retinal injury.
Forschungsartikel
Scanning Electron Microscopy-Energy Dispersive Spectroscopy Evaluation of a Retinal Explant Model of Iron Intraocular Foreign Body Injury
* These authors contributed equally
In diesem Artikel
Zusammenfassung
Zusammenfassung
Iron intraocular foreign body (IOFB) can cause retinal damage, which may be related to the release, transfer, and tissue infiltration of iron particles. Sustained retinal impairment may occur after surgical removal of an iron IOFB, while direct in situ evidence of residual retinal iron deposition remains limited. A retinal explant model combined with regional scanning electron microscopy (SEM)-energy-dispersive spectroscopy (EDS) was used to examine retinal morphology and elemental distribution after iron foreign body exposure and removal. SEM analysis showed that, in the Fe group, the retinal surface at the foreign body bed was rough, with exposed blood vessels and scattered visible particles, whereas the control group showed a dense and intact retinal structure. Regional EDS analysis showed that iron was not detected in the control group but was elevated at the foreign body bed (Fe-Bed) in the Fe group (k-ratio: 0 ± 0 vs. 0.082 ± 0.040, n = 3, P < 0.05), with abnormal distributions of potassium and calcium also observed (k-ratio: 0.001 ± 0.002 vs. 0.013 ± 0.006 and 0.001 ± 0.003 vs. 0.014 ± 0.006, n = 3, all P < 0.05). Iron deposition was further detected in the contralateral distal retinal region (Fe-Far) of the Fe group (k-ratio: 0.036, n = 1). Comparison of the defined regions demonstrated that residual iron was not restricted to the direct contact area after removal of the iron foreign body. These findings confirm persistent iron retention in local and distal retinal tissue after foreign body clearance. The regional SEM-EDS explant platform provides a practical laboratory approach for detecting residual retinal iron and examining associated elemental changes after iron IOFB exposure. This method can be used to investigate IOFB-related iron accumulation-mediated retinal damage in an ex vivo experimental setting.
Einleitung
Iron is the most common causative agent of intraocular foreign body (IOFB) injuries in both daily life and occupational settings1. Ocular iron retention can cause siderosis. Clinical observations have shown that even when iron IOFBs are retained only in the anterior segment, the posterior segment retina can still be damaged2. Additionally, retinal function can continue to deteriorate months or years after IOFB removal3. These clinical manifestations indicate a probable concealed chronic toxic source within the eye that may migrate freely and exert persistent deleterious effects beyond routine detection.
Adaptive optics (AO) dynamic imaging has been reported to detect micron-sized particles after iron IOFB removal, providing morphological clues regarding residual and transferred iron particles4. However, the resolution of this technology is limited to the micron level and provides only information on particle morphology and location without identifying elemental composition. These limitations make the detection of submicron iron particles inconclusive.
In recent years, the concept of ferroptosis has been proposed to describe an iron-dependent form of cell death5. Previous studies have mainly examined organelle morphological changes using transmission electron microscopy (TEM) or detected marker expression levels using molecular biology techniques6. However, effective in situ detection methods for assessing the spatial distribution and quantitative accumulation of iron elements remain lacking. Clinically, retinal damage caused by iron IOFB is often regarded as the result of intertwined toxic, mechanical, and inflammatory factors, making it difficult to isolate the core toxic effect of iron7. Therefore, the present study focuses on obtaining direct evidence of iron accumulation in retinal tissue. Iron accumulation is an upstream prerequisite for ferroptosis; clarification of the extent of iron accumulation provides an experimental foundation for investigating ferroptosis-related mechanisms.
The combination of scanning electron microscopy (SEM) and energy-dispersive X-ray spectroscopy (EDS) provides a means to this end. SEM enables clear visualization of surface micromorphology8. EDS enables qualitative and semi-quantitative elemental analysis of the observed microregion, allowing detection of elemental distribution and content8. The combination of SEM and EDS enables imaging and elemental analysis of nanoparticles9. This technology has high sensitivity to magnetic metal elements and is suitable for detecting trace metal particles in tissues.
Accordingly, the present study employs a retinal explant model and SEM-EDS technology to systematically observe surface morphology and analyze elemental composition across different retinal regions. The aim is to provide an explanatory basis for the clinical manifestations of IOFB injuries and a usable experimental model for future investigations of iron accumulation-related injury mechanisms.
Protokoll
The animal experiments were approved by the Animal Experimentation Ethics Committee of the Joint Shantou International Eye Center of Shantou University and the Chinese University of Hong Kong (EC 20230317 (1)-P12) and were performed in accordance with the Statement on the Use of Animals in Ophthalmic and Vision Research from the Association for Research in Vision and Ophthalmology. The present study was performed at the Animal Laboratory of the Joint Shantou International Eye Center of Shantou University and the Chinese University of Hong Kong, Shantou, China, and the Analysis and Testing Center, Shantou University, Shantou, China. The research tools used in this protocol are listed in the Table of Materials.
1. Animals
Eight-week-old female C57BL/6J mice were maintained in a specific pathogen-free animal facility at a constant room temperature of 22 °C, humidity of 50–60%, a 12 h/12 h light-dark cycle, and an indoor light intensity of 350–400 lux. The animals had free access to sterilized food and water. Six mice were randomly divided into two groups (n = 3 per group): the control (Blank) group and the Fe (iron block) group.
2. Retinal explant culture and iron block treatment experiment
C57BL/6J mice were humanely euthanized via gradual carbon dioxide (CO2) asphyxiation in accordance with institutional animal care guidelines. No anesthesia was administered prior to euthanasia. After CO2 exposure, death was thoroughly confirmed by the permanent cessation of spontaneous respiration and the complete absence of corneal and pedal reflexes. Ocular enucleation was performed only after stable and irreversible death was fully verified to ensure no residual vital signs.
Right eyeballs were immediately enucleated within 30 s, disinfected twice with 75% ethanol, and washed twice in anatomical buffer (1× PBS + sodium pyruvate [1 mM] + penicillin-streptomycin [1×] + amphotericin B [1×]). The retinas were separated and cut into four-leaf-clover shapes, laid flat on filter paper with the ganglion cell layer facing upward, and dried with regular filter paper. The retinal explants were placed in a 48-well plate and cultured in an incubator at 37 °C and 5% CO2 with 0.8 mL of medium (Neurobasal-A + B-27 [1×] + GlutaMAX [1×] + penicillin-streptomycin [1×] + amphotericin B [1×]).
On Day 1, all culture medium was replaced. On Day 3, after half of the culture medium was replaced, an autoclaved iron block (2 mm × 2 mm × 2 mm, 99.9% purity, 63.1 mg) was placed in the retinal midperipheral region of the experimental group, corresponding to one of the four retinal leaflets. A white-light image was captured under the microscope using a mobile phone through the eyepiece. On Day 4, after another white-light image of the culture medium was acquired under the microscope using a mobile phone, the culture medium and the iron block were removed. The explants were transferred to a new 48-well plate. The sampling process was conducted on ice and completed within 30 min.
3. Specimen information and allocation
A total of six experimental mice were randomly divided into two groups, the control group and the Fe group, with three mice in each group. To standardize experimental conditions, only the right eye of each mouse was used, yielding a total of 6 eyes for subsequent retinal separation. Six retinal samples were successfully isolated, cut into four-leaf-clover shapes, and randomly assigned to the two groups. In the Fe group, one retinal leaflet was randomly selected and defined as Fe-a, where the iron block was placed. No sample loss, damage, or exclusion occurred at any stage of sample preparation, processing, or data analysis. All six retinal samples underwent the same systematic characterization, including white-light imaging, SEM imaging, EDS mapping, and elemental quantification.
4. Electron microscope pretreatment
The retinal explant was soaked in 2.5% glutaraldehyde and stored at 4 °C for 24 h. After removal of the glutaraldehyde, the explant was soaked three times in PBS (0.1 M, without NaCl: Na2HPO4, 11.5 g/L + KH2PO4, 2.7 g/L) for 15 min each. The explant was then dehydrated once for 15 min at each concentration in a graded ethanol series (30%, 50%, 70%, 80%, 90%, 95%, and 100%), followed by dehydration three times in anhydrous ethanol for 15 min each.
Filter paper was cut into 5 mm × 5 mm pieces. The location of the foreign body bed, corresponding to the iron block, was marked on the filter paper. The explant was transferred to a new 48-well plate, volatilized and dried in a drying oven at 30 °C for 6 h, and then vacuumed and stored at room temperature.
5. Field-emission scanning electron microscopy of retinal explants
The retinal explants were placed on carbon conductive adhesive and firmly attached to the sample stage, ensuring that the sample height was consistent, the surface was flat, the height was <30 mm, and the weight was <500 g. The samples were coated with a platinum (Pt) film by vacuum spraying using an ion-sputtering instrument. The sputtering coating parameters were as follows: platinum target (purity: 5N; specification: 50 mm × 0.2 mm) and coating time of 150 s.
After uniform platinum coating, the sample stage was clamped onto the sample chamber base. After venting the field-emission scanning electron microscope (FE-SEM) chamber, the sample holder was installed, the chamber was sealed, and vacuum pumping was initiated. Imaging was performed after a high vacuum of <10−4 Pa was achieved. An accelerating voltage of 5 kV was used to reduce beam-induced sample damage. Focus, brightness, contrast, and astigmatism were sequentially optimized. Morphological micrographs were collected from low to high magnification, with a surface-morphology detection depth of <10 nm.
Detection regions included the foreign body bed (Fe-Bed) and a region 2–3 mm from the foreign body (Fe-Far; lateral lobe on the opposite side) in the Fe group. In the control group, detection regions included the midperipheral region, defined as within 2 mm of the retinal leaflet edge, and the posterior region, defined as within a 1 mm radius around the optic disc.
6. Energy-dispersive spectrometer
After FE-SEM imaging, the elemental surface distribution of the sample was scanned by energy-dispersive spectroscopy (EDS). EDS analysis was performed on an SEM model equipped with a silicon drift detector (SDD) at an accelerating voltage of 15 kV, a working distance of 8.5 mm, and a 60 µm aperture. The spectral acquisition time was 60 s (real time), and the background signal was subtracted. The EDS detection depth was 1–2 µm. The EDS software automatically deducted the proportion of platinum.
During quantitative analysis, the k-ratio of each element was calculated as  .
 referred to the net count of characteristic X-rays, with the background signal subtracted, detected from a specific element in the sample under investigation, whereas
 referred to the net count of characteristic X-rays for the same element measured from a standard sample of known composition under identical experimental conditions. The parameters were corrected for ZAF (atomic number, absorption, and fluorescence) using the software provided by EDS. Final results were reported as corrected weight percentage (wt%), wt% sigma (standard deviation from ≥5 replicate analyses), and atomic percentage (at%). The wt% sigma reflects counting statistics and measurement reproducibility.
7. Overview of the procedure
Retinas from C57BL/6J mice were collected for retinal explant culture experiments. The experimental group was treated with iron blocks, whereas the control group received blank treatment. One day later, the retinal explants were transferred and subjected to electron microscopy pretreatment, including fixation, dehydration, drying, and platinum coating, as described above. Finally, FE-SEM and EDS analyses were performed (Figure 1). During experimental operation, a range of undesirable issues may occur owing to improper handling, instrument conditions, and sample-related factors. Table 1 summarizes frequent experimental obstacles, plausible triggers, and actionable solutions for reference.
8. Statistical analysis
Standardized biological and technical replicates were adopted. No blinding test was performed, and multiple-comparison correction was performed. Only the midperipheral and Fe-Bed regions were included in the statistical comparison. Iron particles within the Fe-Far region exhibited unstable size, number, and distribution, potentially biasing measurements. By contrast, iron blocks in the Fe-Bed region had fixed dimensions, mass, and placement, yielding consistent detection conditions and reproducible data for statistical evaluation.
For continuous variables, normality was first evaluated. If all observations within a group were constant, such as when all values were equal to zero, the data were considered not to follow a normal distribution without applying the Shapiro-Wilk test; otherwise, the Shapiro-Wilk test was applied. Variables meeting the normality assumption (P ≥ 0.05) were further assessed for homogeneity of variances using Levene’s test. Equal variances (P ≥ 0.05) were analyzed using the independent-samples t-test, whereas unequal variances were analyzed using Welch’s t-test. Variables that did not follow a normal distribution, including those directly considered constant, were compared using the Mann-Whitney U test. A two-tailed P < 0.05 was considered statistically significant.
Ergebnisse
Advantages of the retinal explant model
Mouse retinas were removed and spread on filter paper. After a stable culture, the retinal explants were treated with iron blocks. The iron blocks were less likely to shift on the flattened retinas, allowing more precise localization of the foreign body beds than in the animal model, in which the retinal surface is curved and the eyeball can rotate (Figure 1). During the experiment, parameters including the composition of the culture medium, the size, shape, and position of the iron blocks, and the culture duration could be precisely controlled. All explants were maintained under the same environmental conditions. The model construction experiments could be repeated. This method, therefore, provides a controllable and repeatable approach for studying retinal damage caused by IOFBs.
Microscopic observation of the retinal explant model
Before and after treatment of the retinal explants, changes in retinal appearance, including color, texture, and overall morphology, could be directly observed under a microscope in real time. An iron block was placed on one corner of the retinal explant for 24 h. Microscopic observation showed that the retinas in the Fe group became brownish-yellow, differing from their appearance before iron placement and from those in the control group. Notably, retinal regions near the Fe-Bed showed deep brown discoloration (Figure 2).
Microscopic morphological analysis of the retinal surface
SEM showed that 24 h of iron block treatment caused changes in the retinal surface over the Fe-Bed. In the wide-view SEM images, the retinal surface in the control group remained dense and compact without vascular exposure (Figure 3A), whereas the Fe group showed a rough retinal surface with exposed blood vessels (Figure 3B). The corresponding higher-magnification images showed the same findings in the control (Figure 3C) and Fe (Figure 3D) groups. In addition, a particle approximately 20 µm × 25 µm was observed in the Fe-Far region of one sample, with loose edges and extensive surrounding areas showing loose infiltration traces (Figure 3D).
Energy spectrum analysis of elements on the retinal surface
EDS was performed to analyze retinal surface elemental distribution in the control and Fe groups (n = 3 per group). Elemental mapping first showed that Fe was undetectable in the control retinal regions but was present at the foreign body bed and in the distal retinal region of the Fe group (Figure 4). Face-total EDS spectra and the corresponding quantitative parameters further showed the elemental profiles of the control region, Fe-Bed, and Fe-Far (Figure 5). Statistical comparison of elemental k-ratios between the control and Fe groups was then performed (Figure 6).
Compared with the control group, the Fe group showed significantly lower k-ratio values of C (0.574 ± 0.064 vs. 0.316 ± 0.116, P = 0.028) and S (0.015 ± 0.002 vs. 0.011 ± 0.001, P = 0.039). By contrast, the k-ratios of K, Ca, and Fe were significantly higher in the Fe group (K: 0.001 ± 0.002 vs. 0.013 ± 0.006, P = 0.046; Ca: 0.001 ± 0.003 vs. 0.014 ± 0.006, P = 0.046; Fe: 0 ± 0 vs. 0.082 ± 0.040, P = 0.024). No significant differences were found in the k-ratios of O (P = 0.204), Na (P = 0.179), or P (P = 0.05) between the two groups. Student’s t-test was used for C, O, Na, and S, and the Mann-Whitney U test was used for P, K, Ca, and Fe.
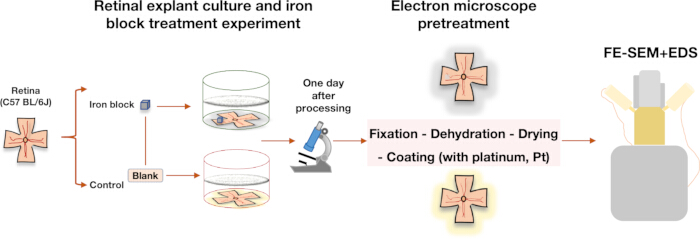
Figure 1: Experimental procedure. Retinal explants were cultured, with the experimental group treated with iron blocks for 1 day and the control group receiving blank treatment. Microscopic observation, electron microscopy pretreatment, field-emission scanning electron microscopy (FE-SEM), and energy-dispersive spectroscopy (EDS) were subsequently performed. Please click here to view a larger version of this figure.
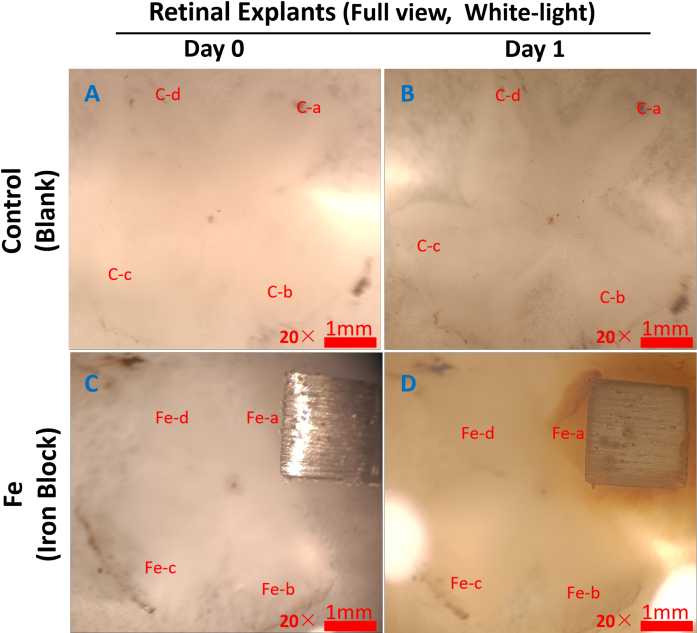
Figure 2: White-light images of retinal explants under the microscope. Representative images are shown. The retinal explant was shaped like a four-leaf clover, with each leaflet labeled clockwise. In the control group (A, B), the four leaflets were labeled C-a, C-b, C-c, and C-d. In the Fe group (C, D), the four leaflets were labeled Fe-a, Fe-b, Fe-c, and Fe-d. The iron block was placed on the Fe-a leaflet. Compared with the retinal explant before treatment (C), the retinal explant became brownish-yellow 1 day after iron block treatment, particularly around the iron block (D, Fe-a). At the corresponding time point, no significant change was observed in the retinal explants of the control group (A, B). Please click here to view a larger version of this figure.
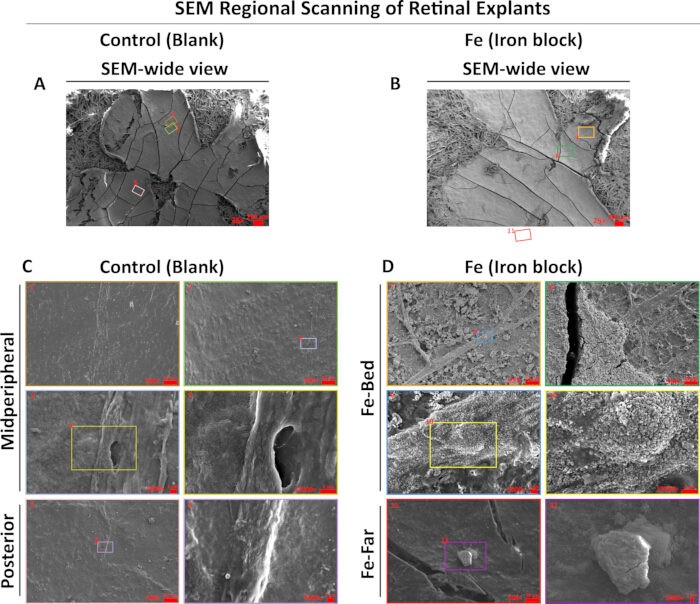
Figure 3: Iron block foreign bodies cause changes in retinal surface morphology. Representative images are shown. A wide-view SEM image of a retinal explant in the control group following blank treatment is shown in (A), with the corresponding color-marked and digit-numbered SEM images shown in (C). A wide-view SEM image of a retinal explant in the Fe group following iron block treatment is shown in (B), with the corresponding color-marked and digit-numbered SEM images shown in (D). Compared with the control group, the retinal surface in the Fe group, particularly at the foreign body bed, appeared rough, with exposed blood vessels and particle adhesion. SEM, scanning electron microscopy; Fe-Bed, foreign body bed position of the iron block; Fe-Far, region 2–3 mm from the foreign body bed on the lateral leaflet of the opposite side. Please click here to view a larger version of this figure.
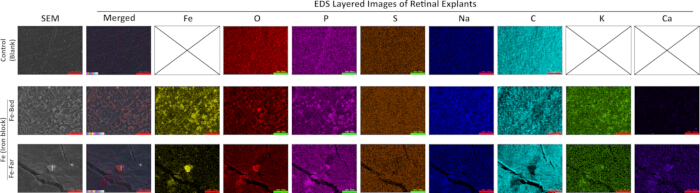
Figure 4: SEM-EDS elemental mapping of the retinal surface in the control and Fe groups. Representative images are shown. SEM images and corresponding EDS elemental distribution maps are shown for the midperipheral retina in the control group (Control), the foreign body bed (Fe-Bed), and the distal retina (Fe-Far) in the Fe group. Different colors in the EDS maps represent different elements. Fe was not detected in the control group but was detected on the retinal surface in the Fe group. The distribution patterns of K and Ca were similar to that of Fe. SEM, scanning electron microscopy; EDS, energy-dispersive spectroscopy; Fe-Bed, foreign body bed position of the iron block; Fe-Far, region 2–3 mm from the foreign body bed on the lateral leaflet of the opposite side; Fe, iron; O, oxygen; P, phosphorus; S, sulfur; Na, sodium; C, carbon; K, potassium; Ca, calcium. Please click here to view a larger version of this figure.
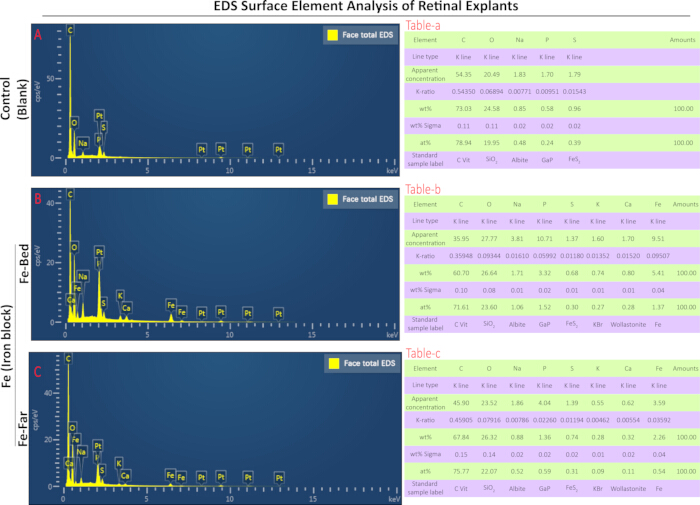
Figure 5: Face-total EDS spectra and corresponding parameters. Representative images with corresponding data are shown. The face-total EDS spectrum and parameter list of the midperipheral retina in the control group are shown in (A) and Table-a, respectively. The face-total EDS spectrum and parameter list of the foreign body bed in the Fe group are shown in (B) and Table-b, respectively. The face-total EDS spectrum and parameter list of the distal retina in the Fe group are shown in (C) and Table-c, respectively. The parameter lists include detected elements, line type, apparent concentration, K-ratio, wt%, wt% sigma, at%, and standard sample label. EDS, energy-dispersive spectroscopy; Fe-Bed, foreign body bed position of the iron block; Fe-Far, region 2–3 mm from the foreign body bed on the lateral leaflet of the opposite side; Fe, iron; O, oxygen; P, phosphorus; S, sulfur; Na, sodium; C, carbon; K, potassium; Ca, calcium. Line type indicates the characteristic X-ray spectral line. The K-ratio is the ratio of the net count of characteristic X-rays from the element in the sample to that of the standard sample under identical conditions. wt% indicates the weight percentage, or mass fraction, of the element after matrix correction. wt% sigma indicates the standard deviation of the weight percentage, reflecting the statistical error of the quantitative result. at% refers to the atomic proportion of a specific element relative to the total atoms of all detected elements in the test sample. The x-axis represents X-ray energy in kilo-electron-volts (keV), and the y-axis represents signal intensity in counts per second per electron volt (cps/eV). Please click here to view a larger version of this figure.
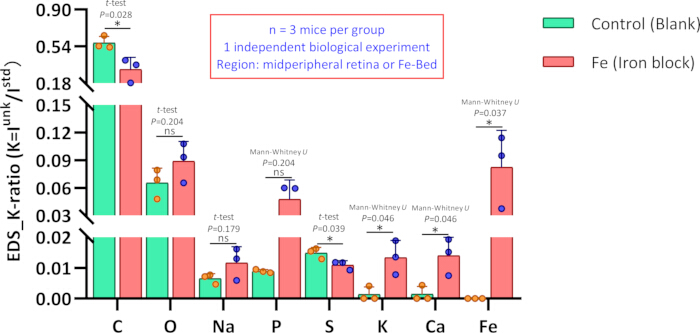
Figure 6: Comparison of elemental K-ratios on the retinal surface between the control and Fe groups. Elemental K-ratios at the midperipheral retinal region in the control group (Blank) were compared with those at the foreign body bed (Fe-Bed), located in the midperipheral region, in the Fe group (Iron block). n = 3 mice per group; data were obtained from one independent biological experiment. Compared with the control group, the K-ratios of C and S after iron block treatment were significantly decreased, whereas the K-ratios of K, Ca, and Fe were significantly increased. Fe was not detected in the examined region of the control group. Elemental K-ratios are presented as mean ± standard deviation for Blank vs. Iron block, with corresponding P values: C, 0.574 ± 0.064 vs. 0.316 ± 0.116 (P = 0.028); O, 0.065 ± 0.016 vs. 0.089 ± 0.021 (P = 0.204); Na, 0.007 ± 0.002 vs. 0.012 ± 0.005 (P = 0.179); P, 0.009 ± 0.001 vs. 0.048 ± 0.021 (P = 0.05); S, 0.015 ± 0.002 vs. 0.011 ± 0.001 (P = 0.039); K, 0.001 ± 0.002 vs. 0.013 ± 0.006 (P = 0.046); Ca, 0.001 ± 0.003 vs. 0.014 ± 0.006 (P = 0.046); and Fe, 0 ± 0 vs. 0.082 ± 0.040 (P = 0.024). Statistical analyses of elemental K-ratios between the two groups were performed using Student’s t-test for C, O, Na, and S and the Mann-Whitney U test for P, K, Ca, and Fe. Fe, iron; O, oxygen; P, phosphorus; S, sulfur; Na, sodium; C, carbon; K, potassium; Ca, calcium; ns, P ≥ 0.05; *P < 0.05. Please click here to view a larger version of this figure.
Image-processing statement
All micrographs were subjected only to uniform cropping and layout arrangement; no selective adjustments to brightness or contrast were applied. EDS intensity scales were not modified post-acquisition.
DATA AVAILABILITY:
The Data Availability Statement has been updated in the revised manuscript. The supplementary materials have been uploaded to Zenodo and are available at: https://doi.org/10.5281/zenodo.22052770.
| Problem | Possible Cause | Solution |
| During culture, the retinal explant may detach from the Whatman filter paper. | During construction of the retinal explant model, the retina was not fully flattened or sufficiently dried. | Ensure that the retina is cut uniformly with sufficient length into a four-leaf-clover shape so that it can lie completely flat on the Whatman filter paper. Appropriately extend the drying time to approximately 3 min and use a larger piece of ordinary filter paper. |
| Local folding and curling of the retinal explant may occur during culture. | Residual vitreous body was not completely removed during retinal separation. | During retinal separation, completely remove the vitreous body before cutting toward the limbus. Maintaining retinal attachment during vitreous removal allows more complete clearance. |
| The part of the retinal inner limiting membrane not in contact with the iron block may show severe mechanical damage. | The retina was damaged by forceps during the experiment. | Use atraumatic, non-toothed forceps and avoid clamping the inner surface of the retina. |
| The dehydrated retinal explant may curl severely. | The Whatman filter paper was too thin or the cutting size was too small. | When trimming the specimen, remove only the irregular edges and do not separate the Whatman filter paper from the retina. |
| During SEM morphological imaging, some images may appear blurry or distorted or may show abnormal bright areas. | The explant is non-conductive. Under electron-beam irradiation, charge accumulation on the explant surface can cause electron-beam deflection, resulting in blurry or distorted images or abnormal bright areas. | Ensure uniform platinum coating of the sample. |
Table 1: Common problems, possible causes, and solutions during retinal explant preparation and SEM-EDS analysis. The table summarizes frequently encountered experimental issues during retinal explant culture, fixation, dehydration, drying, sample mounting, SEM imaging, and EDS analysis, together with plausible causes and corresponding troubleshooting measures.
Diskussion
The retinal explant model of iron intraocular foreign body (IOFB) injury combined with scanning electron microscopy (SEM)-energy-dispersive spectroscopy (EDS) provides an approach for characterizing retinal surface morphological changes and iron accumulation. Direct contact between partial retinal tissue and iron fragments enables localized iron exposure, while SEM and EDS permit comparative analysis of surface microstructure and elemental distribution at the foreign body bed and distal retinal regions. Compared with traditional in vivo animal models, the SEM-EDS system provides improved positioning accuracy, experimental controllability, and repeatability while reducing individual differences and environmental interference10. The method was designed to determine whether residual iron remains in retinal tissue after removal of iron foreign bodies. The tissue cleaning, fixation, and preprocessing procedures for SEM-EDS detection were designed to simulate the clinical workflow of vitrectomy combined with foreign body removal. After 24 h of co-culture with iron fragments, retinal tissue showed visible yellow-brown discoloration and detectable iron particle deposition. EDS confirmed iron deposition at the injury bed and distal retinal regions (Figure 2, Figure 3, and Figure 4). Compared with conventional imaging examinations, SEM-EDS provides direct visualization of microstructural changes and elemental alterations4. SEM observations showed roughening of the retinal surface and exposure of blood vessels 24 h after iron treatment (Figure 3D), consistent with reported clinical manifestations of iron IOFB injury11. EDS elemental mapping showed the spatial distribution of elements on the retinal surface (Figure 4), while EDS scanning provided K-ratio, wt%, and at% data (Figure 5). Persistent retinal iron retention after foreign body removal provides a basis for subsequent investigations of iron-mediated injury mechanisms. EDS elemental profiling also detected changes in potassium (K) and calcium (Ca) distribution and content (Figure 4, Figure 5 and Figure 6), indicating heterogeneous elemental deposition of iron-related substances after iron block intervention.
The analytical framework integrates a retinal explant model with SEM and EDS to characterize regional variations in retinal surface morphology and elemental composition. The primary goal is to confirm persistent retinal iron deposition after removal of intraocular iron foreign bodies. The rinsing and fixation procedures used for SEM-EDS sample preparation mimic the clinical workflow of foreign body removal combined with vitrectomy. The integrated method enables correlation of macroscopic tissue phenotypes, microscopic structural alterations, and in situ elemental distribution. EDS elemental analysis identified alterations in retinal potassium, calcium, and sulfur levels following iron exposure. Analytical electron microscopy (AEM) and nano-secondary ion mass spectrometry (nano-SIMS) have previously been used for correlative analysis of transition metals in the retinal pigment epithelium and choroid at the ultrastructural level12. X-ray fluorescence microscopy (XFM) has also been used to map the spatial distribution of biologically relevant metals, including zinc, copper, and iron, in the mouse retina13. These studies demonstrate the application of spatially resolved elemental analysis in retinal research. Compared with nano-SIMS and XFM, SEM-EDS has greater accessibility for routine laboratory use. The present results demonstrate that SEM-EDS can detect minute iron deposits on the retinal surface.
The retinal explant model has several limitations. Retinal explants are ex vivo models and lack intraocular blood supply, immune responses, the blood-retinal barrier, and aqueous humor circulation, all of which contribute to clearance and repair mechanisms. Consequently, the model cannot simulate the migration of iron particles to blood vessels or chronic inflammatory processes. In future studies, in vivo models such as intravitreal iron injection may provide more physiologically relevant data. In addition, EDS detects elemental types and content but cannot distinguish iron valence states. Iron valence is relevant to toxicity because previous studies have reported that ferrous rather than ferric iron is lethal14. Correlative microscopy and spectroscopy techniques, including electron energy-loss spectroscopy (EELS), have been used to detect iron valence states and may provide a complementary approach15.
In vivo animal models and high-precision elemental detection techniques provide alternative approaches for IOFB injury studies. In vivo iron injection models are limited by higher experimental costs, individual differences, imprecise foreign body localization, and lower sampling repeatability. Advanced analytical techniques, including AEM, nano-SIMS, and XFM, permit high-sensitivity spatial mapping of biological metals in retinal tissue. However, these techniques are limited by instrument availability, cost, complex sample preparation, and low throughput12,13. In comparison, the SEM-EDS workflow provides a combination of detection accuracy, accessibility, and operability for retinal elemental analysis.
The SEM-EDS analytical platform can be applied to research scenarios beyond iron-associated retinal surface morphological and elemental changes. This method can be extended to characterize retinal elemental alterations induced by other metal substances, such as copper, and to evaluate the biosafety of ophthalmic biomaterials by monitoring elemental release from intraocular implants and surgical devices. Furthermore, this platform can serve as a quantitative screening tool for candidate therapeutic agents targeting iron-related retinal alterations. The efficacy of experimental interventions can be assessed by comparing SEM-EDS-detected variations in iron deposition distribution and retinal elemental composition before and after treatment.
Future work will focus on mechanistic exploration and translational application. Combining SEM-EDS elemental quantification with transcriptomic and metabolomic profiling enables multidimensional analysis of potential pathological pathways correlated with retinal iron accumulation, including aberrant calcium channel activity, phospholipid metabolism disturbance, and metallothionein depletion. Although ferroptosis and iron-mediated retinal adverse alterations are hypothesized as potential underlying mechanisms in ocular iron disorders, the present study does not include histological, cellular viability, or ferroptosis-specific validation. Therefore, relevant mechanistic exploration remains exploratory and requires further verification. In addition, quantitative elemental parameters acquired via SEM-EDS can be integrated with clinical imaging features to develop machine learning models, which may support quantitative evaluation of ocular iron deposition characteristics in future clinical investigations.
Offenlegungen
The authors declare no competing interests.
Author Contributions:
Xiaoting Mai contributed to conceptualization, funding acquisition, preparation of the original draft, and review and editing of the manuscript. Haoyu Chen contributed to conceptualization, funding acquisition, investigation, and review and editing of the manuscript. Peixin Zhang contributed to methodology, including animal experiments, explant preparation, and SEM-EDS acquisition, as well as investigation, preparation of the original draft, and statistical analysis. Jiayang Chen contributed to SEM-EDS acquisition, investigation, preparation of the original draft, and raw data validation. Jingmin Xu contributed to animal experiments, explant preparation, SEM-EDS acquisition, investigation, figure preparation, and statistical analysis. Chong-Bo Chen contributed to animal experiments, explant preparation, and investigation. Bingrong Zhuang contributed to SEM-EDS acquisition and investigation. Jiajian Liang contributed to animal experiments and explant preparation. Shaofen Huang contributed to animal experiments and explant preparation. Yifan Chen contributed to animal experiments. Zhen Xichuan Zhang contributed to animal experiments. Zhenmao Wang contributed to material management and investigation. Wai Kit Chu contributed to the review and editing of the manuscript.
Danksagungen
This study was supported by grants from the National Natural Science Foundation of China (No. 82301203), the Guangdong Basic and Applied Basic Research Foundation (No. 2024A1515220074), and the Institutional Funds of Gansu Provincial Hospital (No. 25GSSYA-13).
Materialien
| Name | Unternehmen | Katalognummer | Kommentare |
|---|---|---|---|
| Adobe Illustrator | Adobe Inc. | — | Software used for figure layout, annotation, and preparation of SEM/EDS composite figures; version not provided |
| Amphotericin B | Gibco, USA | 15290026 | Antifungal reagent used in retinal explant washing and culture medium; 250 µg/mL, 50 mL |
| Aqueous glutaraldehyde | Electron Microscopy Sciences, USA | 16220 | Fixative used for retinal explant preparation before SEM/EDS analysis; EM grade, 25% |
| B-27 supplement | Gibco, USA | 0080085SA | Supplement used in retinal explant culture medium; 50×, 10 mL |
| Biological safety cabinet | Thermo, USA | 51028226 | Cabinet used for aseptic preparation and handling of retinal explants and culture materials |
| C57BL/6J mice | Beijing Vital River Laboratory Animal Technology, China | — | Eight-week-old female mice used for retinal explant preparation; animals assigned to control and Fe groups |
| Cell and tissue culture dish | Biofil, China | TCD0100060 | 60 mm culture dish used during retinal tissue preparation and handling |
| Cell and tissue culture plate | Biofil, China | TCP011048 | 48-well plate used for retinal explant culture and experimental treatment |
| Centrifuge tubes | Biofil, China | CFT011150 | 15 mL laboratory tubes used for preparation and handling of solutions |
| CO2 incubator | Thermo, USA | 51033775 | Incubator used for retinal explant culture at 37 °C and 5% CO2 |
| Electric thermostatic blast drying oven | Shanghai Boxun Industrial, China | GZX-9140MBE | Drying oven used to dry retinal explants at 30 °C for 6 h before SEM preparation |
| Energy-dispersive spectrometer | Oxford Instruments, UK | OXFORD Aztec X-Max 20 | EDS system used for elemental mapping and elemental composition analysis of retinal explants |
| Ethanol | Xilong Science, China | 12803401 | Reagent used for disinfection and graded dehydration during retinal explant preparation; 500 mL |
| GlutaMAX | Gibco, USA | 35050061 | Culture-medium supplement used for retinal explant culture; 100×, 200 mM, 100 mL |
| GraphPad Prism | GraphPad Software, Inc. | — | Software used for generation of statistical graphs; version 8.0 |
| IBM SPSS Statistics | IBM | — | Software used for statistical analysis; version 27.0 |
| Ice machine | Xueke, China | IMS-40 | Equipment used to provide ice during sample collection and processing |
| Ion sputtering instrument | Ningbo Supu Electronics, China | Mini Coater | Instrument used for platinum coating of retinal explants before SEM analysis; coating time, 150 s |
| Low-temperature refrigerator (−20 °C) | Haier, China | DW-30L508 | Refrigerator used for storage of temperature-sensitive laboratory materials at −20 °C |
| Low-temperature refrigerator (4 °C) | Haier, China | SC-279GA | Refrigerator used for sample and reagent storage at 4 °C; fixed retinal explants were maintained at 4 °C |
| Manual pipette | Eppendorf Research, Germany | — | Adjustable pipettes used for liquid handling; volume ranges: 0.5–10 µL, 5–100 µL, and 50–1000 µL |
| Microcentrifuge tube | NEST, China | 615001 | 1.5 mL tube used for small-volume sample or reagent handling |
| Micro suction tips | Biofil, China | — | Pipette tips used for liquid transfer; 10 µL, 100 µL, and 1000 µL |
| Mobile phone | Huawei, China | Maimang 5 | Used through the microscope eyepiece to capture white-light images of retinal explants |
| Neurobasal-A medium, without phenol red | Gibco, USA | 12349015 | Basal medium used for retinal explant culture; 1×, 500 mL |
| Ophthalmic operating instrument set | MR, China | — | Instrument set used for enucleation and retinal dissection; includes microscopic eye scissors, toothless forceps, toothed forceps, ophthalmic forceps, and stainless-steel sterilization box |
| Penicillin-Streptomycin | Gibco, USA | 15140122 | Antibiotic mixture used in retinal explant culture medium; 10,000 units/mL penicillin G sodium and 10,000 µg/mL streptomycin, 100 mL |
| Platinum target | Supu Instrument (Shenzhen) Co., Ltd. | HQ20240302 | Purity, 5N (99.9%); specification, 50 mm × 0.2 mm |
| Potassium dihydrogen phosphate (KH2PO4) | Xilong Science, China | 10204401 | Reagent used to prepare phosphate buffer for retinal explant washing; 500 g |
| Precision pH test paper | Woye, China | — | Test paper used for pH assessment; measurement range, pH 4.5–9.0 |
| Pure iron block | Qinghe County Xingye Metal Materials, China | 1655873856 | Iron block used for retinal explant treatment; 2 mm × 2 mm × 2 mm; stated purity, 99.9% |
| Sodium phosphate dibasic (Na2HPO4) | Xilong Science, China | 10105901 | Reagent used to prepare phosphate buffer for retinal explant washing; 500 g |
| Sodium pyruvate | Gibco, USA | 11360070 | Reagent included in the retinal explant washing buffer; stock concentration, 100 mM |
| Sodium sulfate anhydrous | Xilong Science, China | 10104602 | Laboratory reagent; 500 g |
| Software for EDS | Oxford Instruments | — | Aztec software used for EDS acquisition, elemental mapping, and quantitative elemental analysis; version 3.3 SP1 |
| Software for SEM | ZEISS, Germany | — | SmartSEM software used for SEM image acquisition and instrument operation; version 6.01 |
| Steam sterilizer | Shandong Xinhua Medical Devices, China | T25 | Sterilizer used for autoclaving experimental materials, including the iron block |
| Stereoscopic microscope | Leica, Germany | M29.5 | Microscope used for retinal explant preparation and white-light observation |
| Thermal field-emission scanning electron microscope | ZEISS, Germany | GeminiSEM 300 | FE-SEM used to examine retinal surface morphology before EDS elemental analysis |
| Vacuum sealer | Midea, China | CFO7X7-100B | Equipment used for vacuum treatment/storage of dried retinal explants before SEM/EDS analysis |
| Water purification machine | Millipore, USA | ELIX5 | System used to provide purified laboratory water |
| Whatman Grade 4 filter paper | Cytiva, USA | 1004-110 | Filter paper used to support and flatten retinal explants during culture and processing; 110 mm, 100/pk |
| WPS Office-Excel | Kingsoft Corporation | — | Spreadsheet software used for raw-data recording and organization; software manufacturer and version should be verified |
| WPS Office-PPT | Kingsoft Corporation | — | Presentation software used for preparation and labeling of schematic and white-light image figures; software manufacturer and version should be verified |
Referenzen
- Casini G et al. Ocular siderosis: a misdiagnosed cause of visual loss due to ferrous intraocular foreign bodies-epidemiology, pathogenesis, clinical signs, imaging and available treatment options. Doc Ophthalmol. 2021;142(2):133–152.
- He N, Lv Z. A rare asymptomatic metallic intraocular foreign body retained in the anterior chamber for 15 years: a case report. Medicine (Baltimore). 2021;100(25). doi:10.1097/MD.0000000000026470.
- Chiquet C et al. [Risk factors for secondary retinal detachment after extraction of intraocular foreign bodies]. Can J Ophthalmol. 2002;37(3):168–176.
- Faure C et al. Functional and high resolution retinal imaging assessment in a case of ocular siderosis. Doc Ophthalmol. 2014;128(1):69–75.
- Dixon SJ, Olzmann JA. The cell biology of ferroptosis. Nat Rev Mol Cell Biol. 2024;25(6):424–442.
- Mi Y et al. Melatonin inhibits ferroptosis and delays age-related cataract by regulating SIRT6/p-Nrf2/GPX4 and SIRT6/NCOA4/FTH1 pathways. Biomed Pharmacother. 2023;157:114048. doi:10.1016/j.biopha.2022.114048.
- Loporchio D et al. Intraocular foreign bodies: a review. Surv Ophthalmol. 2016;61(5):582–596.
- Badawy RE, Mohamed DA. Evaluation of new bioceramic endodontic sealers: an in vitro study. Dent Med Probl. 2022;59(1):85–92.
- Azam S, Liu S, Bhattacharyya S, Mishra DP. Prevalence of nano-sized coal mine dust in North and Central Appalachian coal mines—insights from SEM-EDS imaging. J Hazard Mater. 2024;476:135226. doi:10.1016/j.jhazmat.2024.135226.
- Mumcuoglu T et al. An animal model (guinea pig) of ocular siderosis: histopathology, pharmacology, and electrophysiology. Curr Eye Res. 2015;40(3):314–320.
- Cai Q et al. Retinal evaluation by fundus angiography before and after vitrectomy and foreign body removal in a patient with ocular siderosis: a case report. Ann Transl Med. 2022;10(6):388. doi:10.21037/atm-22-1114.
- Biesemeier A et al. Transition metals and trace elements in the retinal pigment epithelium and choroid: correlative ultrastructural and chemical analysis by analytical electron microscopy and nano-secondary ion mass spectrometry. Metallomics. 2018;10(2):296–308.
- Grubman A et al. X-ray fluorescence microscopic measurement of elemental distribution in the mouse retina with age. Metallomics. 2016;8(10):1110–1121.
- Shu W et al. Ferrous but not ferric iron sulfate kills photoreceptors and induces photoreceptor-dependent RPE autofluorescence. Redox Biol. 2020;34:101469. doi:10.1016/j.redox.2020.101469.
- Zeng Y et al. Exploring valence states of abnormal mineral deposits in biological tissues using correlative microscopy and spectroscopy techniques: a case study on ferritin and iron deposits from Alzheimer's disease patients. Ultramicroscopy. 2021;231:113254. doi:10.1016/j.ultramic.2021.113254.