Electron paramagnetic resonance (EPR) spectroscopy was employed to detect nitric oxide from bovine aortic endothelial cells and superoxide radical anion from human neutrophils using iron (II)-N-methyl-D-glucamine dithiocarbamate, Fe(MGD)2 and 5,5-dimethyl-1-pyroroline-N-oxide, DMPO, respectively.
A subscription to JoVE is required to view this content. Sign in or start your free trial.
Method Article
Detection of Nitric Oxide and Superoxide Radical Anion by Electron Paramagnetic Resonance Spectroscopy from Cells using Spin Traps
In This Article
Summary
Abstract
Reactive nitrogen/oxygen species (ROS/RNS) at low concentrations play an important role in regulating cell function, signaling, and immune response but in unregulated concentrations are detrimental to cell viability1, 2. While living systems have evolved with endogenous and dietary antioxidant defense mechanisms to regulate ROS generation, ROS are produced continuously as natural by-products of normal metabolism of oxygen and can cause oxidative damage to biomolecules resulting in loss of protein function, DNA cleavage, or lipid peroxidation3, and ultimately to oxidative stress leading to cell injury or death4.
Superoxide radical anion (O2•-) is the major precursor of some of the most highly oxidizing species known to exist in biological systems such as peroxynitrite and hydroxyl radical. The generation of O2•- signals the first sign of oxidative burst, and therefore, its detection and/or sequestration in biological systems is important. In this demonstration, O2•- was generated from polymorphonuclear neutrophils (PMNs). Through chemotactic stimulation with phorbol-12-myristate-13-acetate (PMA), PMN generates O2•- via activation of nicotinamide adenine dinucleotide phosphate (NADPH) oxidase5.
Nitric oxide (NO) synthase which comes in three isoforms, as inducible-, neuronal- and endothelial-NOS, or iNOS, nNOS or eNOS, respectively, catalyzes the conversion of L- arginine to L-citrulline, using NADPH to produce NO6. Here, we generated NO from endothelial cells. Under oxidative stress conditions, eNOS for example can switch from producing NO to O2•- in a process called uncoupling, which is believed to be caused by oxidation of heme7 or the co-factor, tetrahydrobiopterin (BH4)8.
There are only few reliable methods for the detection of free radicals in biological systems but are limited by specificity and sensitivity. Spin trapping is commonly used for the identification of free radicals and involves the addition reaction of a radical to a spin trap forming a persistent spin adduct which can be detected by electron paramagnetic resonance (EPR) spectroscopy. The various radical adducts exhibit distinctive spectrum which can be used to identify the radicals being generated and can provide a wealth of information about the nature and kinetics of radical production9.
The cyclic nitrones, 5,5-dimethyl-pyrroline-N-oxide, DMPO10, the phosphoryl-substituted DEPMPO11, and the ester-substituted, EMPO12 and BMPO13, have been widely employed as spin traps--the latter spin traps exhibiting longer half-lives for O2•- adduct. Iron (II)-N-methyl-D-glucamine dithiocarbamate, Fe(MGD)2 is commonly used to trap NO due to high rate of adduct formation and the high stability of the spin adduct14.
Protocol
1. Culture of Bovine Aortic Endothelial Cells (BAEC)
- Proper aseptic techniques were followed.
- In a water bath, warm medium without antibiotics at 37 °C.
Note: The medium consists of phenol free Dulbecco's modified Eagle's medium (DMEM) with 4.5 g/L D-glucose, 4 mM L-glutamine, 1% non-essential amino acids, supplemented with 10% fetal bovine serum (FBS) and 2.5 mg/L endothelial growth factor.
- Remove the T75 flask containing cells from the incubator and clean the surface of the flask with 70% ethanol before placing it inside the hood.
- Remove the old medium using an aspirator and wash twice with 5 ml of Dulbecco's phosphate buffer saline (DPBS).
- Add 2 ml of trypsin and wait for 4-5 min for cells to detach while periodically inspecting under the microscope.
- Add 3 ml of the medium and repeatedly mix using a pipette to separate the cells and create an even suspension.
- Transfer 5 ml of the medium with trypsin to a 15 ml tube and centrifuge at 121 g for 5 min.
- Remove the supernatant using an aspirator. Add 5 ml of DPBS and mix thoroughly. Centrifuge at 121g for 5 min.
- Aspirate the supernatant and re-suspend the cell pellet by adding 6 ml of the medium.
- On a 6-well plate, add 1 ml of the cell suspension to each well then add 1 ml of the medium. Mix the suspension using a pipette.
- Label the plate and incubate overnight at 37 °C and 5% CO2.
2A. Detection of NO with BAEC Cell
- Proper aseptic techniques were followed.
- Remove the 6-well plate from the incubator and aspirate the medium from the first well. Wash the cells twice with 1 ml DPBS.
- Add 210 μl of 1.9 mM iron(II)sulfate heptahydrate (FeSO4.7H2O, prepare freshly by dissolving 0.8 mg in 1 ml DPBS with CaCl2 and MgCl2) and 210 μl of ammonium N-methyl-D-glucamine dithiocarbamate (MGD, prepare freshly by dissolving 2.7 mg in 500 μl DPBS with CaCl2 and MgCl2) using a ratio of 1:7. (Note: This ratio where excess MGD is used has been conventionally employed for the preparation of Fe2+-MGD complex due to the fact that the yield for Fe3+-MGD is maximized in the presence of excess MGD. The addition of ascorbate in solution to stabilize the Fe2+-MGD is not necessary since the NO-Fe3+-MGD formed is endogenously reduced to the EPR detectable NO-Fe2+-MGD by ascorbate, hydroquinone, or cysteine with conversion efficiency of up to 99.9%.. The low spin diamagnetic state of Fe2+ allows the detection of NO using flat cell or capillary tube without the need of a low temperature device)15.
- Swirl the resulting suspension well and add 4.6 μl of calcium ionophore (CaI) (prepared from a stock solution of 1.9 mM by dissolving 1 mg in 1 ml DMSO).
- Swirl the solution again and incubate at 37 °C for 36 min in order to further allow reduction of NO-Fe3+-MGD to the EPR detectable NO-Fe2+-MGD.
- Collect the supernatant (425 μl) in an Eppendorf tube and transfer to an EPR flat cell (or to a 50 μl capillary tube).
- EPR acquisition parameters are: microwave frequency: 9.8 GHz; center field: 3427 G; modulation amplitude: 6.0 G; sweep width: 100 G; receiver gain: 1 x 10⁵; microwave power: 10 mW; total number of scans: 121; sweep time: 10 s; and time constant: 20 ms. (Note: Since parameters will vary from one instrument and experimental conditions to another, therefore, only the center field, frequency and modulation amplitude are the most important parameters to consider.)
- Record the spectra at room temperature and the 2-D spectra were integrated to reduce the background noise and baseline corrected using Bruker WinEPR Data Processing software or other data processing software. For quantification of adduct formation, standard plots of concentration versus signal intensity (or area) can be constructed using an NO donor SNAP.
2B. eNOS Uncoupling Experiment
- Remove the 6-well plate from the incubator and aspirate the medium from the second well and wash twice with 1 ml DPBS.
- A peroxynitrite donor, 5-amino-3-(4-morpholinyl)-1,2,3-oxadiazolium chloride (SIN-1) was used to uncouple eNOS16. Add 100 μl of 0.5 mM SIN-1 (Mr 206.6 g/mol, from 10 mM stock solution freshly prepared by dissolving 1 mg SIN-1 in 500 μl of PBS with no Ca/Mg ions) and dilute to 2 ml with DPBS and 10% FBS.
- Incubate for 2 h at 37 °C and 5% CO2.
- Remove the plate from incubator and wash twice with DPBS.
- Add 210 μl of 2.8 mM FeSO4.7H2O and 210 μl of 19.6 mM MGD freshly prepared according to the procedure mentioned above.
- Swirl the solution and add 4.6 μl of 1.9 mM CaI.
- Swirl the solution again and incubate at 37 °C for 36 min.
- Collect the supernatant (425 μl) in an Eppendorf tube and transfer to an EPR flat cell.
- EPR acquisition parameters are: microwave frequency: 9.8 GHz; center field: 3427 G; modulation amplitude: 6 G; sweep width: 100 G; receiver gain: 1 x 10⁵; microwave power: 10 mW; total number of scans: 121; sweep time: 10 s; and time constant: 20 ms.
- Record the spectra and the 2-D spectra were integrated to reduce the background noise and baseline corrected as mentioned above.
3. Detection of O2•- from Polymorphonuclear Neutrophils (PMNs)
- Neutrophils were isolated from human blood sample as previously described17.
- Make a stock solution of 1 M DMPO* in PBS containing 0.1 mM diethylenetriamine-pentaacetic acid (DTPA). DMPO has a melting point of 25-29 °C so it is more convenient to pipette liquid DMPO (density ~ 1.02 g/ml at 25 °C) in to a glass vial (Note: do not use plastic vials for weighing since pure DMPO reacts with plastic). Frozen DMPO can be melted by running luke warm water on to the vial (Note: do not run hot water as DMPO may decompose).
- It is important to use high purity DMPO (> 99%) since some of the commercially available spin traps contain paramagnetic impurities, and therefore, it is imperative to run EPR spectrum of just the DMPO solution alone (10 mM in this case). It is critical that no background signal is evident (see Figure 3A).
- Prepare stock solution (1 mg/ml) of phorbol-12-myristate-13-acetate (PMA) in DMSO. Make aliquots by diluting the solution to 10 μg/ml in PBS.
- In a 1.5 ml Eppendorf tube, prepare a solution with a total volume of 0.6 ml by following the sequence of addition: ~106 cells per ml of PMN, D-glucose (1 mg/ml) and albumin (1 mg/ml), 10 mM DMPO and 0.2 μg/ml of PMA. (Note: PMA is the radical activator and should be added last).
- Transfer the solution to an EPR flat cell.
- EPR acquisition parameters conditions are: microwave frequency: 9.8 GHz; center field: 3486 G; modulation amplitude: 0.5 G; sweep width: 100 G; receiver gain: 5 x 10⁵; total number of scans: 10; sweep time: 30 s; microwave power: 20 mW; and time constant: 81 ms. For quantification of adduct formation, standard plots of concentration versus signal intensity (or area) can be constructed using the stable nitroxides such as TEMPO or 3-carboxylic acid-PROXYL.
* Important note on the use of DMPO: By using a flat cell, one can increase the cell density and thereby increasing the signal intensity of the spin adduct but the half-life of O2•- adduct of DMPO is short (t1/2 ~ 1 min) which decomposes to DMPO-OH. DMPO can be substituted using the same concentrations of EMPO, BMPO or DEPMPO which are available commercially for increased adduct stability with t1/2 ~ 8 and 14 min, respectively.
4. Representative Results
Spin trapping of NO radical was performed using Fe2+-MGD. Figure 2A and 2B show no EPR signal from Fe2+-MGD or mixture of Fe2+-MGD with CaI, indicating that no NO background signal originates from these reagents. BAEC upon stimulation with CaI releases NO which reacts with Fe2+-MGD to form the spin adduct, NO-Fe2+-MGD, and shows a characteristic triplet signal with hyperfine splitting constant (hfsc) value of aN = 12.66 G and g-factor of g= 2.040. (Figure 2C). The hfsc value was determined using the WINSIM simulation program that can be downloaded from NIEHS EPR Software Database website. The experimental hfsc is consistent with the literature value of aN=12.70 G and g = 2.04118 for NO-Fe2+-MGD adduct. Similarly, the effect of SIN-1 on BAEC lowered the NO production due to eNOS uncoupling as shown in Figure 2D.
DMPO spin trap was used for O2•- detection. DMPO alone did not give a signal as shown in the Figure 3A confirming that the spin trap is free from paramagnetic impurities. Figure 3B is the spectrum of DMPO and PMNs only, and similarly, there is no detectable signal suggesting that the DMPO does not cause activation of the enzyme NADPH oxidase. Figure 3C shows the observed EPR signal upon stimulation of PMN by PMA. The hfsc values for this signal were determined to be aN =14.71 G, aβ-H =11.40 G and aγ-H =1.25 G, and are consistent with the literature values of aN =14.3 G, aβ-H =11.7 G and aγ-H =1.3 G 19 for DMPO-O2H adduct.
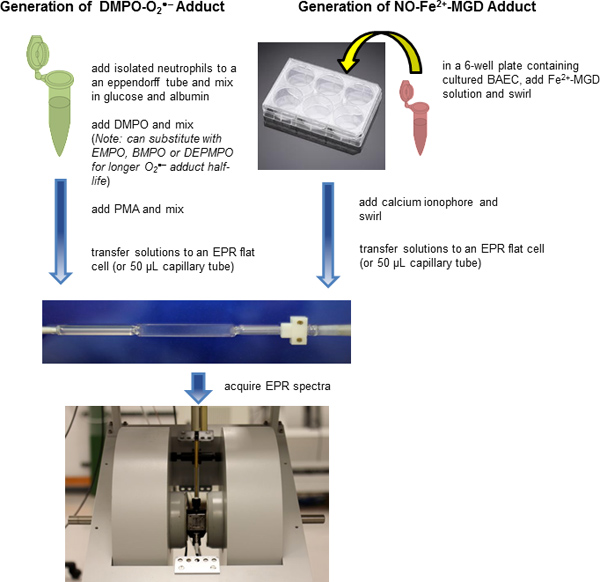
Figure 1. Flow chart for the detection of radicals from neutrophils and BAEC using EPR spin trapping. (A) PMNs were mixed with DMPO and PMA, and the resulting mixture transferred to an EPR flat cell for data acquisition. (B) BAEC were grown on a plate, and washed with DPBS. The spin trap Fe(MGD)2 was added along with CaI. The solution was mixed thoroughly and incubated. The mixture was transferred to an EPR flat cell for EPR data acquisition.
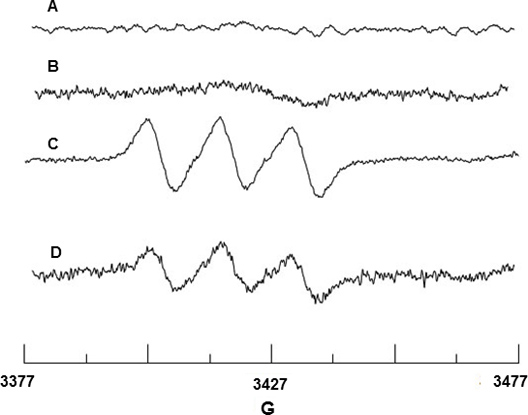
Figure 2. EPR detection of NO from BAEC. (A) Spectrum of Fe2+-MGD only (B) Spectrum of Fe2+-MGD + CaI only. (C) Triplet spectrum resulting from NO trapping by Fe2+-MGD using CaI-stimulated cells. (D) Spectrum showing decrease in NO production due to 0.5 mM SIN-1 treatment of cells.
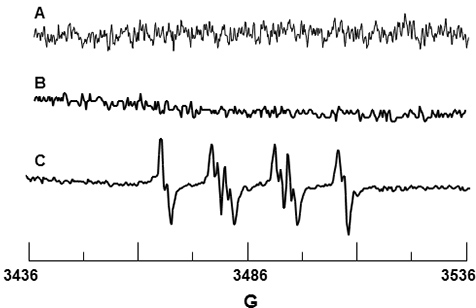
Figure 3. EPR detection of DMPO-O2H from activated neutrophils. (A) Spectrum of 10 mM
DMPO only. (B) Spectrum of PMN alone in the presence of 10 mM DMPO. (C) Spectrum of PMN activated by PMA in the presence of 10 mM DMPO.
Access restricted. Please log in or start a trial to view this content.
Discussion
EPR spin trapping has been employed in a wide range of biomedical applications for quantifying and identifying free radicals. Spin trapping is highly sensitive, capable of detecting radicals at concentrations ranging from nM to μM thus making it suitable for application in biological systems. The formation of the paramagnetic adduct, NO-Fe2+-MGD, is the basis of NO detection via EPR. Fe2+-MGD reacts with NO rapidly18 at a rate of ~ 106 M-1 s-1....
Access restricted. Please log in or start a trial to view this content.
Disclosures
No conflicts of interest declared.
Acknowledgements
This work was funded by the NIH National Heart, Lung, and Blood Institute grant RO1 HL81248.
Access restricted. Please log in or start a trial to view this content.
Materials
| Name | Company | Catalog Number | Comments |
|---|---|---|---|
| Phenol free DMEM medium High glucose 1X | GIBCO | 31053 | |
| 0.25% Trypsin- EDTA | GIBCO | 25200 | |
| L-Glutamine | Fisher Scientific | BP379-100 | |
| MEM Non Essential Amino acids | GIBCO | 11140 | |
| Fetal Bovine serum | Atlanta Biologicals | S11550 | |
| Endothelial Growth factor | Millipore | 02-102 | |
| CaI | Enzo Life Sciences | A-23187 | Dissolve in DMSO |
| SIN-1 | Enzo Life Sciences | BML-CN245-0020 | |
| DMPO | Dojindo Laboratories | D048-10 | |
| FeSO4.7H2O | Sigma Aldrich | 215422-250G | Dissolve in PBS with Ca and Mg |
| MGD | Enzo Life Sciences | ALX-400-014-M050 | Dissolve in PBS with Ca2+ and Mg2+ |
| BAEC cells | Cell Systems | 2B2-C75 | |
| DMSO | Fisher Scientific | BP231-100 | |
| DPBS | Sigma Aldrich | D8537 | |
| DPBS with CaCl2 and MgCl2 | Sigma Aldrich | D8662 | |
| Phorbol-myristate acetate (PMA) | Sigma Aldrich | 79346-1MG |
References
- Winterbourn, C. C. Reconciling the chemistry and biology of reactive oxygen species. Nat. Chem. Biol. 4, 278-286 (2008).
- Winterbourn, C. C., Hampton, M. B. Thiol chemistry and specificity in redox signaling. Free Radic. Biol. Med. 45, 549-561 (2008).
- Oxygen, Gene Expression, and Cellular Function. Clerch, L. B., Massaro, D. J. , (1997).
- Gutteridge, J. M. C., Halliwell, B. Antioxidants: Molecules, medicines, and myths. Biochem. Biophys. Res. Commun. 393, 561-564 (2010).
- Sumimoto, H. Structure, regulation and evolution of Nox-family NADPH oxidases that produce reactive oxygen species. FEBS J. 275, 3249-3277 (2008).
- Ignarro, L. J. Editor Nitric Oxide: Biology and Pathobiology. , Academic Press. San Diego, CA. (2009).
- Moreau, M. Differential effects of alkyl- and arylguanidines on the stability and reactivity of inducible NOS heme-dioxygen complexes. Biochemistry. 45, 3988-3999 (2006).
- Vasquez-Vivar, J. Superoxide generation by endothelial nitric oxide synthase: the influence of cofactors. Proc. Natl. Acad. Sci. U. S. A. 95, 9220-9225 (1998).
- Villamena, F. A., Zweier, J. L. Detection of reactive oxygen and nitrogen species by EPR spin trapping. Antioxid. Redox Signal. 6, 619-629 (2004).
- Finkelstein, E., Rosen, G. M., Rauckman, E. J. Spin trapping of superoxide and hydroxyl radical: practical aspects. Arch. Biochem. Biophys. 200, 1-16 (1980).
- Frejaville, C. 5-Diethoxyphosphoryl-5-methyl-1-pyrroline N-oxide (DEPMPO): a new phosphorylated nitrone for the efficient in vitro and in vivo spin trapping of oxygen-centered radicals. J. Chem. Soc., Chem. Commun. , 1793-1794 (1994).
- Olive, G., Mercier, A., Le Moigne, F., Rockenbauer, A., Tordo, P. 2-Ethoxycarbonyl-2-methyl-3,4-dihydro-2H-pyrrole-1-oxide: Evaluation of the spin trapping properties. Free Radical. Biol. Med. 28, 403-408 (2000).
- Villamena, F. A., Zweier, J. L. Superoxide radical trapping and spin adduct decay of 5-tert-butoxycarbonyl-5-methyl-1-pyrroline N-oxide (BocMPO): kinetics and theoretical analysis. J. Chem. Soc., Perkin Trans. 2, 1340-1344 (2002).
- Tsuchiya, K. Nitric oxide-forming reactions of the water-soluble nitric oxide spin-trapping agent, MGD. Free Radical Biol. Med. 27, 347-355 (1999).
- Vanin, A. F., Poltorakov, A. P., Mikoyan, V. D., Kubrina, L. N., van Faassen, E. Why iron-dithiocarbamates ensure detection of nitric oxide in cells and tissues. Nitric Oxide. 15, 295-311 (2006).
- RojasWahl, R. U. Decomposition mechanism of 3-N-morpholinosydnonimine (SIN-1): A density functional study on intrinsic structures and reactivities. J. Mol. Model. 10, 121-129 (2004).
- Klempner, M. S., Gallin, J. I. Separation and functional characterization of human neutrophil subpopulations. Blood. 51, 659-669 (1978).
- Pou, S. Spin trapping of nitric oxide by ferro-chelates: kinetic and in vivo pharmacokinetic studies. Biochim. Biophys. Acta. 1427, 216-226 (1999).
- Finkelstein, E., Rosen, G. M., Rauckman, E. J. Spin trapping. Kinetics of the reaction of superoxide and hydroxyl radicals with nitrones. J. Am. Chem. Soc. 102, 4994-4999 (1980).
- Britigan, B. E., Rosen, G. M. Spin-trapping and human neutrophils. Limits of detection of hydroxyl radical. J. Biol. Chem. 264, 12299-12302 (1989).
- Frejaville, C. 5-(Diethoxyphosphoryl)-5-methyl-1-pyrroline N-oxide: A new efficient phosphorylated nitrone for the in vitro and in vivo spin trapping of oxygen-centered radicals. J. Med. Chem. 38, 258-265 (1995).
- Snyrychova, I. Improvement of the sensitivity of EPR spin trapping in biological systems by cyclodextrins: A model study with thylakoids and photosystem II particles. Free Radical Biol. Med. 48, 264-274 (2010).
- Han, Y. Lipophilic beta-cyclodextrin cyclic-nitrone conjugate: Synthesis and spin trapping studies. J. Org. Chem. 74, 5369-5380 (2009).
- Han, Y., Tuccio, B., Lauricella, R., Villamena, F. A. Improved spin trapping properties by beta-cyclodextrin-cyclic nitrone conjugate. J. Org. Chem. 73, 7108-7117 (2008).
- Hardy, M. Detection, characterization, and decay kinetics of ROS and thiyl adducts of mito-DEPMPO spin trap. Chem. Res. Toxicol. 20, 1053-1060 (2007).
- Kim, S. -U. Fast reactivity of a cyclic nitrone-calix[4]pyrrole conjugate with superoxide radical anion: Theoretical and experimental studies. J. Am. Chem. Soc. 132, 17157-17173 (2010).
Access restricted. Please log in or start a trial to view this content.
Reprints and Permissions
