Here, we present a protocol for an open-source, modifiable normothermic ex vivo perfusion system designed to overcome the high cost and limited flexibility of existing platforms, enabling more accessible, cost-efficient, and iterative use in pre-clinical biomedical research.
Method Article
An Open-Source Normothermic Perfusion System Designed for Research Scientists
In This Article
Summary
Abstract
The integration of ex vivo perfusion machines for human organs prior to transplantation has improved outcomes for recipients and increased organ availability while revealing novel avenues of investigation for translational medicine. However, these machines have limited availability for experimental modifications while presenting a significant upfront cost investment and prohibitive per-use cost to the research scientist. Furthermore, there is a significant need for improved pre-clinical models in biomedical research that allow for authentic interrogation of cellular processes in the multi-cellular organ setting.
To provide access to similar technology for the greater research community, we constructed a cost-effective modular normothermic perfusion machine entirely from readily sourced parts run with user-modifiable Python code. Since the system is devoid of customized hardware, investigators can construct and augment the system as required for individualized research applications.
Herein, we describe the machine set-up and perfusion process in detail, convey our experience with porcine and human organs, and provide early proof-of-concept experimental results. These studies demonstrate the potential to interrogate pathophysiology and complex cellular processes using intact human tissue.
Introduction
Although short-duration (<12 h) normothermic machine perfusion has been previously employed for kidneys and livers prior to transplant1,2,3,4,5, prolonged normothermic ex vivo liver perfusion became a reality in 2020 with the Liver4Life machine6. The intent of this technology was geared toward the expansion of viable donor organs, but the possible translational applications were readily apparent to the research community7,8,9,10,11,12. For bench scientists and conventional research laboratories, these clinical tools are almost assuredly out of reach due to significant upfront and recurring costs12,13. Clinical normothermic perfusion machines are upwards of $250,000 USD, with single-use disposables ranging from $9,500-$60,000 USD per run13,14,15,16,17,18,19,20,21,22,23. Furthermore, proprietary rights and the inability to tailor the existing technology make scientific applications challenging.
The outstanding need for improved pre-clinical models24,25,26 in biomedical research, coupled with the aforementioned limitations, inspired the creation of an open-source, modifiable perfusion system (Figure 1). Circuit design and development were guided by the principles of cost-utilization, laboratory space requirements, and mobility for translational applications. The system can be constructed for $48,000-$66,000 USD, and each perfusion cost ranges from $1,000-$2,300 USD, which was achieved through the integration of readily sourced individual components run by freely downloadable code. The system was optimized through an iterative process making use of donor porcine blood and expired human blood, porcine livers, and partial human liver segments from the operating room (Supplementary Table 1, Supplementary Table 2, and Supplementary Table 3). Organs are housed in an enclosed basin that optimally positions the specimen to minimize pressure necrosis, allow for ideal cannulation trajectory, drain runoff, and ensure normothermia. The reservoir houses approximately 2-3 L of perfusate prior to being directed toward inflow circuits. Hemodialysis, which is critical for electrolyte homeostasis and hemoconcentration in hepatic perfusions6,27,28,29, was integrated through a side circuit with an independent roller pump. Pharmacologic infusions support physiologic functions (e.g., total parenteral nutrition (TPN), bile salts, etc.30), augment vascular tone (epoprostenol, phenylephrine), prevent coagulation (enoxaparin), and infection (piperacillin-tazobactam, amphotericin). Physiologic perfusion parameters are ensured using real-time in-line sensors to obtain blood gas, pressure, and flow values. The system allows for maximal user adaptability such that the integration of hardware components can occur at any point in the circuit. Furthermore, each of the individual components within the circuit can be interchanged or modified to enable tailoring to specific research questions and experimental needs. For example, the dual inflow circuit can be altered for perfusion of organs with a single inflow (i.e., kidneys or pancreas) by simply removing the Y-connector prior to the pump heads, and claves for infusion/sampling can be installed at any point within the circuit. Additionally, the system is run with Python code that allows semi-automated perfusion based on a specified set of perfusion parameters dictated by the end user (Supplementary Figure 1). For example, sensors acquire continuous arterial blood gasses (ABG), pressure, and flow readings that act as input to implement output commands to automatically adjust oxygenator gas flow, pump speed, etc. The graphic user interface (GUI) allows for manual override of this automation if desired. The customizability of the circuit is its hallmark, and it broadens the overall applicability of this system for a wide range of experimental investigations.
Access to the system in its entirety is freely available (https://github.com/CCR-SOP/OpenSourcePerfusionSystem.git) to encourage collaboration and innovation in an effort to forge new depths of knowledge across multiple fields of translational science.

Figure 1: Open-source perfusion system. (A) Open-source perfusion system schematic for dual inflow set-up for hepatic perfusion. (B) Three-dimensional (3D) rendering of the system during organ perfusion with software integration as demonstrated on screens. (C) Photo of perfusion machine during porcine perfusion experiment. The exposed configuration in the figure is for demonstrative purposes only. During perfusion, the sterile warming drape covers the organ to maintain a sterile enclosure.P/F Sensor: Pressure and flow sensors. HA: Hepatic artery. PV: Portal vein. HV: Hepatic vein. BD: Bile duct. Please click here to view a larger version of this figure.
Protocol
This protocol was conducted in accordance with the ethical standards of our institution's Human Research Ethics Committee and adheres to all applicable guidelines and regulations for research involving human subjects and tissues.
1. Machine set-up
- Table preparation
- Sterilize the tabletop and mobile cart with 70% alcohol spray and wipe thoroughly. Place the mobile cart perpendicular to the left side of the table. Prior to the connection of all tubing and hardware throughout the protocol, spray with 70% alcohol or autoclave, if applicable, to sterilize.
NOTE: Prior to any organ handling or intervention, use sterile gloves and alcohol spray to facilitate sterility prior to and throughout perfusion. - Cover the workstation with sterile blue drapes and then absorbent underpads.
- Attach the reservoir holder to the cart leg closest to the bench with the ring projecting outward, approximately 12" below the bottom of the workstation top.
- Place the drum funnel on the right aspect of the workstation with a spout overhanging the front edge of the table. Cut out circular memory foam to fill the base of the drum, allowing a 4" gap for outflow near the spout. Place the diaphragm underneath foam connected to a respirator.
- Obtain 2 water heating blankets and place them on top of the foam insert with connector tubing oriented to the top left of the blanket. Cut off white clamps from the tubing and insert a 3/16" male Luer barb into each tube. Secure 1 inflow and 1 outflow line from the Y'ed water heating tank lines to each blanket.
- Obtain a sterile warmer drape and identify the center blue square. Fold in half twice and cut 2 mm off the corner of the fold to create an outflow hole. Place sterile drape on top of drum so that cut hole is in line with outflow spout.
- Obtain the 3D-printed outlet connector and place the magnet in the groove. Place under drape through outflow spout and align cut hole to hole in connector and magnet. Place a second magnet aligned with the outflow to secure the drape.
- Raise excess drape to cover the entire drum funnel and secure with rubber band/elastic ties. Fold the excess drape over the top to create a sterile barrier. Replace the second water jacket on top of the folded drape.
- Cut a ~30" piece of 1/4" tubing and attach the proximal aspect to the outlet piece from the bottom of the drum funnel spout and the distal aspect to a reservoir inflow barb.
- Sterilize the tabletop and mobile cart with 70% alcohol spray and wipe thoroughly. Place the mobile cart perpendicular to the left side of the table. Prior to the connection of all tubing and hardware throughout the protocol, spray with 70% alcohol or autoclave, if applicable, to sterilize.
- Pump and oxygenator preparation
- Place pumps on mobile cart closest to workstation edge with stand and two clamps immediately behind pumps so that clamps are 6" above pumps.
- Obtain 2 pump heads and secure in pumps.
- Obtain 2 oxygenators and place within clamps attached to stands in a horizontal configuration. Orient oxygenators with barb facing outward and lateral barb pointing to the right.
NOTE: Oxygenators with Luer connectors require an alternative configuration with the label facing outward and inner prongs facing upward.
- Gas mixer preparation
- Cut two (2) 4' pieces of 1/8" tubing and insert a male 1/8" Luer into the ends of each tube. Connect one tube to each arterial and venous gas inflows.
- Cut two (2) 2" pieces of 1/4" tubing and attach a 1/4" female Luer onto one end. Fit each of these tubing pieces on the top right barbs of each oxygenator.
- Connect the arterial and venous 1/8" gas inflow tubing to the top right Luer connector of their respective oxygenators.
- Hemodialysis circuit preparation
- Remove all tubing from the hemodialysis kit except that leading into the filter directly (blue, red, green, and yellow lines). Secure the filter onto the pegboard at the back of the workstation, ~12" to the right of the pumps, or in line with the reservoir.
- Place 1 large roller pump to the immediate right of the filter for blood inflow. Place 2 smaller peristaltic pumps to the right of the blood roller pump.
- Obtain two (2) 1/8th peristaltic tubings and place within the white pump clamp. Attach two (2) female 1/8th Luer barbs at each end of each tubing.
- Hang a 5 L bag of dialysate on the right lateral aspect of the workstation.
- Connect the dialysate bag to the hemodialysis filter inflow by attaching 1/8th tubing to the bag's Luer connector. Attach the male 1/8th Luer to the end of this tubing and attach it to the inflow peristaltic pump tubing.
- Dialysate Inflow/Outflow: Obtain 3 1/8th tubing with each end equipped with a male 1/8th Luer.
- Inflow: Connect proximal end to distal aspect of pump tubing and distal end to yellow inflow tubing (with 1/8th female Luer) to hemodialysis filter.
- Outflow: Connect proximal end to green outflow tubing (with 1/8th female Luer) and distal end to outflow peristaltic pump tubing. Connect the 1/8th tubing to the distal aspect of the peristaltic pump and drain it into the waste bag via Luer connectors.
- Proximal circuit creation
- Place reservoir within reservoir holder with exterior numbers and yellow-capped connector oriented outward.
- Cut ~36" of 5/16" tubing and connect the proximal end to the outflow spicket at the bottom of the reservoir. Connect the 5/16" Y connector to the distal end of this tubing.
- Cut two (2) 4" lengths of the 5/16" tubing and connect these to the end of the Y connector. Attach each of the ends of these 4" tubes onto the horizontal prong of each of the pump heads.
- Cut two (2) 4" lengths of 1/4" tubing and connect 1 to each of the vertical barbs of the pump heads. Connect the distal aspect to the left lower prong of each oxygenator.
- Cut two (2) 2" lengths of 1/4" tubing and connect a female Luer to one end. Add a male Luer cap and attach it to the right lower prong of each oxygenator.
- Venous circuit creation
- Cut one (1) 30" length of 5/16" tubing and attach the proximal end to the outflow (right) barb of the venous oxygenator. Cut in half and place a 5/16" Y connector overthe distal cut end. Reattach the other half to the top barb of the Y connector.
- Side sampling circuit: Cut one (1) 2" piece of 1/4" tubing and stretch the proximal end using a needle driver. Connect this to the other barb of the 5/16" Y connector.
- Obtain a cuvette sensor. Connect the barbed side to the 2" tubing connected to the Y connector. Cut off 1-2" of distal cuvette tubing and connect to the male 1/4" Luer. Attach to the proximal end of the shunt sensor once calibrated, and on the distal aspect, connect the male 1/8" Luer to the 1/8" tubing.
- Connect the horizontal aspect of the female T connector to 1/8" tubing and male Luer. To the perpendicular aspect, connect a sampling clave. Connect a 1/8" male Luer to the remaining horizontal aspect of the T connector.
- Cut 12" of 1/8" tubing, attach the proximal end to the sampling clave, and attach a 1/8" male Luer to the distal end. Connect this to another female T connector. To one side of the female T connector, attach a 1/4" male Luer and connect to an inflow channel using 2" of 1/4" tubing.
- Return to the distal end of the 5/16" tubing and attach another 5/16" Y connector. Obtain ~55" of ¼" tubing and attach to the top end of the 5/16" Y connector.
- Hemodialysis blood circuit creation: Attach a 1/4" male Luer to the distal end of the 1/4" tubing. Place the tubing through the large roller pump. Connect to the blood inflow at the top of the hemodialysis filter (blue-lined tubing).
- Cut one (1) 24" piece of 1/4" tubing and connect a male 1/4" Luer to the proximal aspect. Connect this tubing to the blood outflow hemodialysis filter (red-lined tubing). Connect the distal aspect to an inflow barb of the reservoir.
- Return to complete the venous inflow circuit leading to the specimen. Cut one (1) 36" piece of 1/4" tubing and stretch it to fit onto the barb of 5/16" Y connector.
- Drug infusion site: Obtain 3 four-way stopcocks and connect linearly. Connect this piece to the perpendicular arm of a female T connector. To the in-line arms of the female T connector, attach two male 1/4" Luers. Insert piece 12" from the left aspect of the tubing.
- Attach the external flow sensors onto the 1/4" tubing after the drug infusion site. Obtain 1 9" mount and secure at the level of the drum funnel. Make a cut 2" distal to the end of flow sensors and insert pressure sensors with barbs into 1/4" tubing. Place the distal aspect of the tubing into the center of the drum funnel. Reserve one (1) 1/4"male Luer for venous cannulation into the specimen.
- Arterial circuit creation
- Cut another ~30" piece of 5/16" tubing and attach the proximal end of the right outflow barb of the arterial oxygenator. Cut this tubing approximately halfway through and attach one 1 5/16" Y connector.
- Side sampling circuit: Create a duplicate side sampling circuit as described in step 1.6.2 and attach it to the inferior aspect of the Y connector, omitting the cuvette. When completed, attach the outflow 1/8" Luer to the T connector.
- Cut one (1) 36" piece of 1/4" tubing and fit it onto the barb of 5/16" Y connector.
- Repeat step 1.6.7. Reserve one (1) ¼" male Luer for arterial cannulation into the specimen.
- Venous outflow creation
- Cut ~30" of 1/4" tubing and attach 1 male ¼" Luer to the proximal end to attach to the inferior vena cava (IVC) outflow of the specimen. Attach the distal end to one of the inflow barbs of the reservoir.
- Cut this tubing ~6" from the reservoir and attach 2 1/4" male Luers to each end. Insert a female T with a clave attached to the perpendicular aspect for sampling.
- Introduce perfusate to the circuit as described in step 4. Rewarm and connect the specimen as described in step 6.1.4. or step 6.2.4. and commence perfusion.
2. CDI sensor calibration
- Ensure the calibrator gas bottles are full and installed per the user operating manual and that the monitor is set to calibrate mode. Calibrate per manufacturer's instructions.
- Disconnect the sensor-cable-head apparatus from the monitor once calibration is complete and immediately integrate it into the respective venous and arterial side circuits. Luer connections are created in steps 1.6.2 and 1.7.2.
3. Code Initiation
- Download, install, and open the Python code found in the GitHub repository. Ensure proper Python and PyCharm software installation.
- Create a unique branch for each perfusion run for accurate data recording. Once initiated, a GUI will display with two windows. Orient one window per display for easy control of hardware and display of perfusion parameters.
- Adjust perfusion parameters manually or automate perfusion through respective buttons displayed on the GUI (Supplementary Figure 1).
4. Perfusate creation and system priming
- Prime the circuit approximately 2 h prior to organ perfusion to allow for correction of metabolic/electrolyte derangements, warming to normothermia, and administering anticoagulation, antibiotics, and other pharmaceuticals.
- Porcine perfusate
- Obtain 2 L of type OO whole porcine blood and introduce it to the reservoir by draining through an open 50-100 mL syringe. Take approximately 1 mL of whole blood and measure baseline pH, electrolytes, and hematocrit on a point-of-care machine.
- Administer aliquots of 8.4% sodium bicarbonate as necessary to counteract acidity due to cold blood preservatives. Initiate hemodialysis to normalize hyperkalemia and lactic acidemia as needed and titrate to desired hematocrit concentration. Adjust gas flow to titrate to physiologic pO2 and pCO2 levels.
- Administer pharmaceuticals as described below (section 5).
- Preserve 1-2 L type OO whole blood for intermittent boluses as needed to maintain hematocrit at ~30-40% throughout the perfusion experiment.
- Human perfusate
- Obtain type-matched blood products from a blood bank (near-expired or donated for research purposes).
NOTE: Approximately 4 units each of packed red blood cells (RBCs) and plasma are required for each perfusion experiment. - Wash pRBCs to remove preservatives and normalize electrolyte derangements from the RBC pellet prior to priming. Wash RBCs twice.
- RBC washing: Place pRBC and 0.9% NaCl in a 1:1 ratio into a centrifuge tube. Centrifuge at 1300 × g for 15 min. Remove the supernatant with a pipette and readminister fresh 0.9% NaCl in a 1:1 ratio to the RBC pellet. Centrifuge again as above and remove 2nd supernatant for final washed RBC pellet.
- Introduce washed RBC pellets into the reservoir using an open 50-100 mL syringe. Place 4 units of plasma into the reservoir and begin circulation.
- Initiate dialysis, warming blankets, and gas inflow once perfusate is circulating.
- Sample perfusate and apply pharmacological interventions as needed to ensure near-physiologic perfusate levels as possible prior to organ perfusion.
- Wash and introduce additional washed pRBC pellets and titrate volume status through hemodialysis as necessary to maintain hematocrit levels of 30-40%.
- Obtain type-matched blood products from a blood bank (near-expired or donated for research purposes).
5. Pharmacologic intervention and infusion preparation
- Antibiotic and antifungal administration
- Combine two 2.5 g vials of piperacillin/tazobactam in a sterile specimen cup with 40 mL of sterile saline. Add 10 mL to the reservoir as an "antibiotic prime".
- Dilute the remaining mixture with 60 mL of sterile saline and divide between two 50 mL syringes. Connect one syringe to a syringe pump and program to continuously deliver 41 µL/min to the portal vein drug infusion site (step 1.6.6).
- Preserve the remaining antibiotic in a 4 °C refrigerator.
- Reconstitute one 50 mg vial of amphotericin with 10 mL of sterile water.
- Draw up 1 mL of concentrated amphotericin and combine it with 9 mL of sterile saline. Administer the 10 mL mixture to the reservoir to serve as an "antifungal prime" at the beginning of perfusion.
- Administer 1 mL of concentrated amphotericin every 12 h to the reservoir.
- Combine two 2.5 g vials of piperacillin/tazobactam in a sterile specimen cup with 40 mL of sterile saline. Add 10 mL to the reservoir as an "antibiotic prime".
- Anticoagulation
- Combine 1 mL (100 mg) of enoxaparin with 49 mL of sterile saline. Administer a 5 mL mixture per liter of perfusate at the beginning of perfusion for an "anticoagulation prime."
- Preserve the remaining enoxaparin solution in a 4 °C refrigerator.
- Administer the enoxaparin solution (5 mL/1 L perfusate) every 12 h to the reservoir.
- Combine 1 mL (100 mg) of enoxaparin with 49 mL of sterile saline. Administer a 5 mL mixture per liter of perfusate at the beginning of perfusion for an "anticoagulation prime."
- Steroids
- Reconstitute 1 g of methylprednisolone with 20 mL of sterile water.
- Prime the system according to dosing specifications prior to perfusion initiation: Porcine livers receive 10 mL (500 mg) of methylprednisolone. Partial human livers receive 2 mL (100 mg) of solumedrol.
- Dilute the remaining mixture with 40 mL of saline in a 50 mL syringe and place it in a syringe pump to continuously deliver 33 µL/min to the portal vein drug infusion site (step 1.6.6).
- Parenteral nutrition and bile salts
- Reconstitute 1.7 g of taurocholic acid with 50 mL of 10% amino acid + electrolyte concentrated parenteral nutrition component of TPN (unmixed with dextrose) in a sterile specimen cup. Draw up into a 50 mL syringe and place in a syringe pump to continuously deliver 83 µL/min to the portal vein drug infusion site (step 1.6.6.)
- Vascular tone control
- Vasodilation: Reconstitute 0.5 mg of epoprostenol with 50 mL of sterile saline in a sterile cup and place in a 50 mL syringe. Place it in a syringe pump and connect it to the clave proximal to the hepatic artery flow sensor.
- Bolus or continuously infuse (10 µL/min) as needed to achieve desired mean arterial pressure and/or to counteract vasospasm.
- Vasoconstriction: Dilute 5 mL (50 mg) of phenylephrine with 45 mL of sterile saline in a sterile cup and place in a 50 mL syringe. Store mixture in 4 °C refrigerator and bolus as needed to maintain desired mean arterial pressure.
NOTE: This is rarely required, and reconstitution may be omitted and implemented only as needed.
- Vasodilation: Reconstitute 0.5 mg of epoprostenol with 50 mL of sterile saline in a sterile cup and place in a 50 mL syringe. Place it in a syringe pump and connect it to the clave proximal to the hepatic artery flow sensor.
- Pressure and flow sensor calibration
- Pressure calibration: Calibrate pressure sensors without perfusate flowing. Re-zero sensors if non-zero pressure reading displayed per manufacturer's instructions while the end of the tubing is open to air for 0 mmHg pressure. Ensure proper pressure measurements by gently obstructing both the proximal and distal ends of the tubing to produce elevated pressures.
- Flow calibration: Calibrate once the circuit is circulating perfusate prior to organ perfusion to ensure accurate measurement. Clamp tubing distal to flow sensors to cut off the flow. Re-zero flow sensors if non-zero flow rate displayed per manufacturer's instructions. Unclamp tubing to allow flow and accurate flow measurement.
6. Hepatic procurement
- Porcine procurement
NOTE: Porcine livers are procured from a local butcher shop in compliance with the USDA humane handling of livestock protocols. Dissection is guided by the research team to include infra- and suprahepatic vena cava and bile duct.- Sterilize the liver with diluted iodine in sterile saline and place it in a sterile basin on ice. Identify the portal vein, hepatic artery, superior vena cava, and common bile duct, cannulate and secure with 4-0 silk ties.
NOTE: The bile duct is often cannulated with a fenestrated angio-catheter due to its small diameter and to prevent biliary obstruction of variant porcine bile systems. - Flush the cannulated portal vein and hepatic artery with 3 L of cold sterile saline (2 L PV:1 L HA) followed by 1 L of cold organ preservation solution (750 mL PV:250 mL HA). Submerge the liver in the cold organ preservation solution with ice for transport.
- Prime the system as described above (step 4.1) until physiologic parameters are met.
- Submerge the cannulated liver in warmed sterile saline for rapid rewarming and removal of any air emboli. Connect the appropriate inflow tubing to the portal vein and hepatic artery cannulas. Titrate pump speed for physiologic flow and pressure values.
- Connect the vena cava cannula to the outflow tubing to facilitate outflow to the reservoir to complete the circuit.
- Drain the gallbladder of residual bile prior to connecting syringe tubing to the bile duct cannula and a conical vial for collection.
- Sterilize the liver with diluted iodine in sterile saline and place it in a sterile basin on ice. Identify the portal vein, hepatic artery, superior vena cava, and common bile duct, cannulate and secure with 4-0 silk ties.
- Human procurement
- Prime the system as described above (step 4.1).
- Obtain human specimens after indicated standard of care oncologic resections. Measure in vivo flow rates by intraoperative ultrasound for calibration on the ex vivo system. Identify the segmental portal vein, hepatic artery, and bile duct during surgical dissection. Transect the triad per standard surgical technique and hand the specimen of the surgical field to the sterile back table.
- Identify and cannulate the segmental portal vein, hepatic artery, hepatic vein, and bile duct, secure with 4-0 silk ties or prolene suture.
NOTE: Omit outflow cannulation if the segment does not have a dominant outflow vein to avoid congestive hepatopathy. The basin outflow then functions as the hepatic vein/IVC outflow tubing. - Return to the ex vivo lab and weigh the specimen. Submerge the specimen in warmed sterile saline and connect respective inflow/outflow tubing. Connect the bile duct cannula to the syringe tubing for drainage to the conical vial.
- Commence perfusion and titrate pump flow for desired flow and pressure perfusion parameters.
7. Perfusion parameter titration
- Sample perfusate from pre-hepatic (HA and PV side circuits) and post-hepatic (IVC or basin outflow) claves at numerous time points for titration of perfusion parameters based on point of care blood gas, electrolyte, and hematocrit and hemoglobin values.
- Calibrate the CDI sensors throughout perfusion using the manual specimen analyses.
- Adjust hemodialysis inflow and outflow accordingly to maintain volume status and hematocrit concentration of 30-40% and correct any metabolic and electrolyte derangements.
- Manually dose aliquots of 5% dextrose, free water, 8.4% sodium bicarbonate, and 0.9% NaCl as needed to correct electrolyte abnormalities.
8. Perfusion circuit variants
- Transportation adaptation
- Plug the pumps into a mobile power source for the duration of the run to facilitate continuous perfusion en route to the imaging machine. Plug the mobile power source into the AC outlet to charge the external battery during perfusion.
- Unplug the mobile power source from the wall AC outlet once the perfusion experiment is concluded.
- Disconnect gas inflow to oxygenators. Clamp off the hemodialysis side circuit and disconnect blood inflow to filter. Stop dialysate pumps.
- Remove flow sensors from inflow tubing. Disconnect drug infusions and turn off stopcocks. Unplug pressure sensors from the input/output plug.
- Carefully move the drum funnel and tubing to the mobile cart, which now is an independent unit and can be transported to the imaging suite.
Results
Representative porcine runs
Whole porcine livers were obtained from a local butcher for cost efficiency and perfused for various optimization and testing phases of machine development (Supplementary Table 1). The first 24 h of three representative liver runs are evaluated here (Figure 2). Mean hepatic arterial pressure was 80 mmHg ± 11 mmHg, and mean portal venous pressure was 7.1 mmHg ± 3.3 mmHg with flows of 107 mL/min ± 102 mL/min and 501 mL/min ± 329 mL/min, respectively. The large standard deviations for pressure and flows correlate with the large difference in liver size, with pigs ranging from 50 lbs. to 350 lbs. The dual inflow circuits allow for physiologic oxygen differentials with a mean arterial saturation (SO2) of 95 ± 7.4% compared to mean portal venous SO2 of 85 ± 13% (p < 0.001). The SO2 outflow from the hepatic veins was 74 ± 18%, indicative of oxygen consumption (p < 0.01), and peripheral pH measurements were within physiologic ranges at 7.2 ± 0.09. Additional physiologic parameters such as total hemoglobin (9 ± 2.5 g/dL), hematocrit levels (28.3 ± 6.4%), glucose level (477 ± 15 mg/dL), and changes in lactate (3.0 ± 2.5 mmol) and potassium (-0.77 ± 2.3 mmol) were monitored throughout perfusion by sampling at regular intervals. For porcine perfusions, bile production was indicative of organ viability. The gallbladder was manually drained once the organ became normothermic, and the common bile duct was attached to a small tube for collection. Total bile production throughout perfusion was 41 ± 6.9 mL total, with a rate of 6.9 ± 4.0 mL/h.
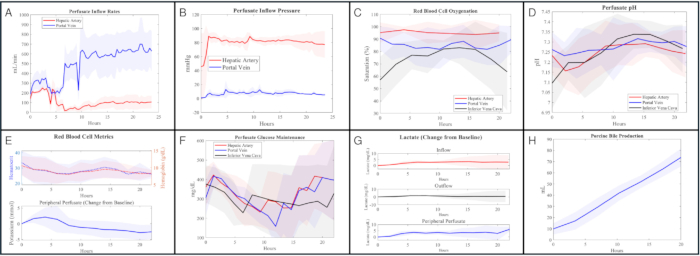
Figure 2: Perfusate metrics during porcine liver perfusion (n = 3). (A) Average blood inflow rates (mL/min) of the hepatic artery and portal vein over time. (B) Average blood inflow pressures (mmHg) of the hepatic artery and portal vein over time. (C) Comparison of percent RBC O2 saturation between hepatic artery, portal vein, and inferior vena cava demonstrating oxygen differential between dual inflows and oxygen consumption in the outflow. Statistically significant differences were determined between the portal vein and arterial saturations (p < 0.0001), the portal vein and IVC saturations (p < 0.01), and the arterial and IVC saturations (p < 0.0001). (D) Evaluation of blood pH between hepatic artery, portal vein, and inferior vena cava. (E) Hematocrit (%) and hemoglobin (g/dL) levels (top) throughout perfusion, in addition to change in PV potassium (mmol) (bottom) as a marker of hemolysis. (F) Reservoir glucose levels reflecting mean circuit glucose (mg/dL) throughout perfusion. (G) Change in lactate level (mg/dL) throughout perfusion as compared to time 0 lactate values in hepatic artery inflow, IVC outflow, and system perfusate. (H) Bile production (mL) over time throughout perfusion. Please click here to view a larger version of this figure.
Representative human runs
Three tumor-bearing human hepatic segments were perfused, with perfusion duration time ranging from 48-72 h, depending on the requirements of the experiment (Figure 3). To compare data between representative application runs, we evaluated the first 48 h of biochemical values. Perfusion approximated in vivo parameters with continuous low-pressure, high-volume portal venous inflow and pulsatile high-pressure, low-volume arterial inflow, which are displayed in real-time to allow easy titration. If the liver did not reach physiologic biochemical values within two hours of perfusion, the experiment was terminated. For successful liver perfusions, mean hepatic arterial pressure was 84 mmHg ± 11 mmHg, and mean portal venous pressure was 9 mmHg ± 4 mmHg with flows of 113 mL/min ± 66 mL/min and 317 mL/min ± 302 mL/min, respectively. The dual inflow circuits allow for physiologic oxygen differentials with a mean arterial saturation (SO2) of 98% ± 3% compared to mean portal venous SO2 of 92% ± 7% (p < 0.0001). The SO2 of the outflow from the hepatic veins was 86% ± 9%, indicative of oxygen consumption (p < 0.0001), and pH measurements across the system were within physiologic ranges at 7.3 ± 0.09. Additional physiologic parameters such as total hemoglobin (10.2 g/dL ± 1.6 g/dL), hematocrit levels (30.2% ± 5.5%), glucose level (170 mg/dL ± 68 mg/dL), and changes in lactate (3.6 mmol/L ± 2.2 mmol/L) were monitored throughout perfusion by sampling at regular intervals. In a representative run, an average of 1.4 mL/h of bile was produced. Prior to and at the termination of perfusion experiments, biopsies were obtained for tissue analysis. Representative tissue sections demonstrate hepatic parenchyma, metastatic neuroendocrine tumor, and metastatic colorectal adenocarcinoma after perfusion.
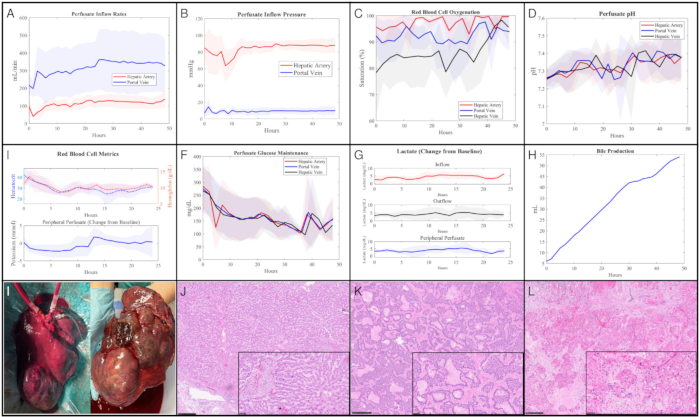
Figure 3: Perfusate and tissue metrics during human liver segment(s) perfusion (n = 3). (A) Mean perfusate inflow rate (mL/min) for the hepatic artery and portal vein. (B) Mean perfusate inflow pressure (mmHg) for the hepatic artery and portal vein over time. (C) Red blood cell oxygen saturation (%) for the inflow hepatic artery, inflow portal vein, and outflow hepatic vein. Statistically significant differences were determined between the portal vein and arterial saturations (p < 0.0001), the portal vein and IVC saturations (p < 0.0001), and the arterial and IVC saturations (p < 0.0001). (D) Perfusate pH for the inflow hepatic artery, inflow portal vein, and outflow hepatic vein. (E) Red blood cell metrics throughout perfusion, including mean hematocrit (%) and hemoglobin (g/dL) perfusate levels (top) with change in perfusate potassium (mmol) from baseline over time (bottom). (F) Mean glucose concentration (mg/dL) for the inflow hepatic artery, inflow portal vein, and outflow hepatic vein over time. (G) Change in perfusate lactate concentration (mg/dL) from baseline over time for the inflow hepatic artery, outflow hepatic vein, and systemic perfusate. (H) Bile production (mL) over time. (I) Human liver segments (Couinaud II-IV) during (left) and post perfusion (right) demonstrating lack of pressure necrosis after system optimization. Superficial area of cauterization present at the top of the left image due to intraoperative hemostasis. (J) Post-perfusion tissue section demonstrating hepatic parenchyma (hematoxylin and eosin stain, 10x, inset 40x; scale bar 50 µM). (K) Post-perfusion tissue section demonstrating metastatic neuroendocrine tumor (hematoxylin and eosin stain, 10x, inset 40x; scale bar 250 µM). (L) Post-perfusion tissue section demonstrating metastatic colorectal adenocarcinoma (hematoxylin and eosin stain, 10x, inset 40x; scale bar 50 µM). Please click here to view a larger version of this figure.
Representative application: CT imaging of perfused specimen
The ability to integrate clinical data sources such as computed tomography (CT) or magnetic resonance (MR) imaging with pathology stands to advance personalized diagnostics and medicine. However, pathology reports are summary findings, and the heterogeneity inherent to solid tumors far exceeds human capabilities for delineation. A potential solution is to perform imaging ex vivo followed by immediate preparation of macroscale tissue sections to allow for radiomic integration of spatially preserving cellular data (e.g., spatial transcriptomics, highly multiplex immunofluorescence). To accommodate conventional imaging on the system, a mobile set-up was constructed, including transitioning pumps to an external battery source to provide undisrupted power during transport and imaging (Figure 4A). With the liver on the CT table, iodinated contrast was administered, and images were obtained, which demonstrate consistent radiographic features with those acquired in vivo (Figure 4B).
Representative application: Kidney and pancreas perfusion
Innate to its design, the system is adaptable to the perfusion of additional organs (Figure 4C-F), which obviates the need for dual inflow and thereby decreases the per-use costs. To demonstrate, we removed the portal venous circuit for a single arterial inflow (Supplementary Figure 2) and perfused a human kidney (Figure 4C) and a human partial pancreas (Figure 4E). Representative tissue sections following perfusion demonstrate glomeruli (Figure 4D) and Islets of Langerhans (Figure 4F).
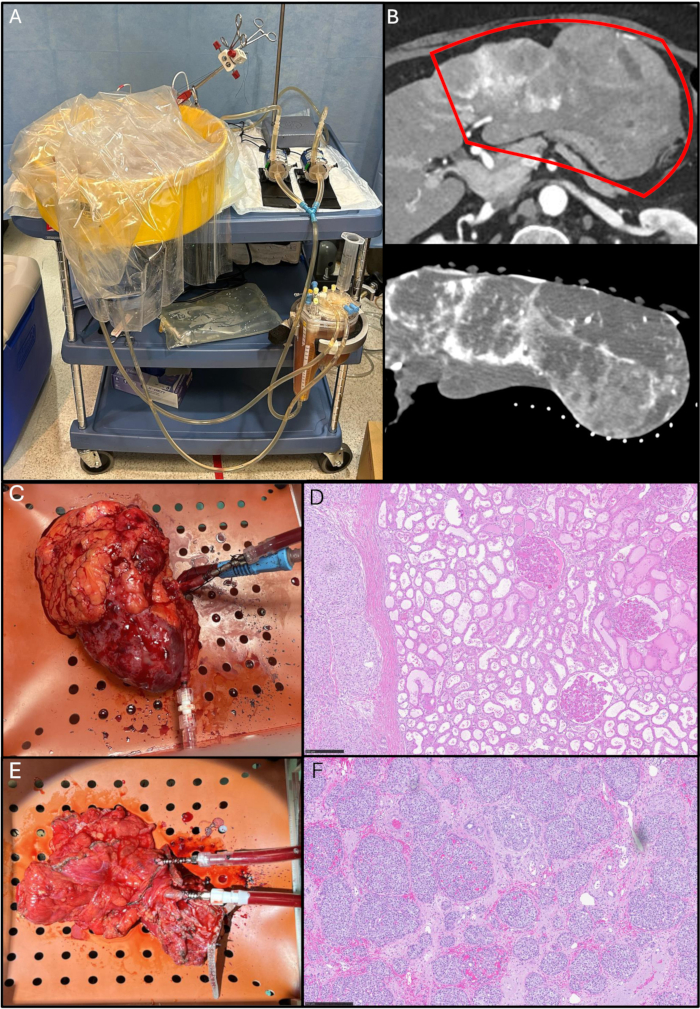
Figure 4: Representative application of perfusion machines: CT imaging and organ modularity. (A) Mobile adaptation of the system for transport. (B) Representative CT images of the liver with tumor after administration of iodinated contrast in vivo (top) and ex vivo after perfusion (bottom). (C) Human kidney perfusion on the reconfigured machine for single inflow. (D) Post-perfusion tissue section demonstrates renal glomeruli and collecting ducts (hematoxylin and eosin stain, 8x; scale bar 250 µm). (E) Human distal pancreas perfusion on the reconfigured machine for single inflow. (F) Post-perfusion tissue section demonstrates pancreatic islets (hematoxylin and eosin stain, 8x; scale bar 250 µm). Please click here to view a larger version of this figure.
Supplementary Figure 1: Python code settings to facilitate semi-automated perfusion. Schematic depicting input and output parameters utilized by the code enabling semi-automation with the addition of commonly employed manual adjustments (Table). Please click here to download this File.
Supplementary Figure 2: Single inflow schematic used for kidney and pancreas perfusion. P/F Sensor: Pressure and flow sensors. Please click here to download this File.
Supplementary Figure 3: Red blood cell optimization. (A) Blood-only perfusion experiment demonstrated significantly less hemolysis in low RPM conditions compared to high RPM conditions (p < 0.01) using plasma-free hemoglobin as a surrogate for cell lysis. (B) Qualitative comparison of plasma hemolysis over time visually demonstrates less hemolysis in low RPM states when compared to high RPM states. (C-F) Evaluating hemolysis in systems with differing levels of resistance and basin integration with plasma surrogates: (C) A significant difference in lactate levels was determined between the parallel circuit set-up and both the closed and basin set-up (p < 0.0001 and p < 0.0001, respectively). (D) A significant difference in potassium levels was determined between the parallel circuit set-up and both the series closed and series with basin set-up (p < 0.0001 and p < 0.0001, respectively). (E) A significant difference in hematocrit levels was determined between the parallel circuit set-up and both the series closed and series with basin set-up (p < 0.0001 and p < 0.0001, respectively). (F) A significant difference in hemoglobin levels was determined between the parallel circuit set-up and series closed and series with basin set-up (p < 0.0001 and p < 0.0001, respectively). Please click here to download this File.
Supplementary Table 1: Porcine organ optimization perfusions. Thirty-five porcine perfusion experiments performed during optimization phases, including 25 partial livers, 2 kidneys, and 8 whole livers. Included are the duration of perfusion and the reason for termination. Please click here to download this File.
Supplementary Table 2: Human liver validation and application perfusions. Fourteen human partial liver perfusions, including formal left and right hepatectomies spanning to single-segment perfusion experiments. Included are pathology, experimental aim, perfusion duration, and rationale for termination. Please click here to download this File.
Supplementary Table 3: Perfusate-only optimization. Twenty-two perfusate-only optimization runs, including species type, experimental aim, duration of experiment, and reason for termination. Please click here to download this File.
Discussion
Normothermic perfusion machines commonly employed prior to solid organ transplantation have enabled significant strides in ex vivo perfusion. While their use with partial organs is technically feasible in some cases7,8,9, they remain inaccessible for the research scientist due to high costs and limited availability. In this work, we sought to provide a comparable, open-source alternative to the greater research community through the use of readily sourced components and freely accessible code to run the system for a broad range of research endpoints.
Several steps within the protocol are essential for achieving stable organ perfusion. One of the most critical steps is effective pressure offloading to prevent parenchymal collapse and sinusoidal dilation. This was achieved by implementing memory foam supported by an oscillating diaphragm to evenly distribute the organ weight and maintain near-atmospheric portal pressure for adequate drainage. The initial use of a metal grate to support the liver resulted in parenchymal collapse and sinusoidal congestion, as observed in histological analysis and ultrasound imaging during perfusion. This was partially resolved by transitioning to a perforated silicone hammock. While gross pressure necrosis was resolved, there was still notable evidence of parenchymal collapse, as evidenced by high portal vein pressures and significantly congested specimens after 48 h of perfusion. Submerging the liver in saline or blood was also attempted and was successful in relieving congestion and portal hypertension; however, it was not feasible due to the large quantity of perfusate required, difficulty in maintaining sterility, and lack of efficient draining into the reservoir. When compared to the floating technique, we observed the same near-atmospheric portal pressure when the liver was placed on a memory foam cushion with an oscillating diaphragm to disperse weight more equally (Figure 1B and Figure 3I). This design results in softer, better-perfused segments while still allowing easy, efficient drainage of blood outflow from the specimen.
A second critical step is minimizing circuit resistance that imparts shear stress on red blood cells to prevent hemolysis. This was accomplished by introducing side circuits with restrictive components to facilitate physiologic flow without subjecting the perfusate to unnecessary pressure. Hemolysis is an inevitable and continuous process during machine perfusion. In early iterations of the system, extensive hemolysis was a significant contributor to early termination. The shear stress that the system imparts on red blood cells predominantly stems from the pumps due to perfusate stasis and recirculation in addition to narrow diameters of tubes and membranes. The pumps currently employed cause some degree of hemolysis, which increases over time. Pump efficiency is an important factor in hemolysis, as higher flows could be beneficial due to lower rates of blood recycling and secondary flow, mitigated by higher volume of perfusate and/or lower pump speeds. Since large volumes of pRBCs are often difficult to acquire, we focused efforts on redesigning the system to provide physiologic flow rates at lower pump speeds, imparting lower resistance in the circuit overall31. To further lessen the intrinsic resistance of the circuit, we integrated side circuits in parallel, which resulted in lower lactate and potassium levels and higher hematocrit and hemoglobin levels over time (Supplementary Figure 3). Lastly, the current hemofilter is integrated into the portal vein side circuit with blood propelled by a peristaltic pump that confers a significant amount of hemolysis due to notable resistance and shear stress imparted by both the filter and its pump. One of our current optimization efforts is focused on removing this side circuit by investigating the potential implementation of hemodialysis tubing into the reservoir. Removal of the clinical-grade hemofilters would allow for subsequent removal of the peristaltic pump, further minimize hemolysis, and reduce the overall cost of the system.
Despite the utility and adaptability of the system described here, limitations should be acknowledged. Notably, the duration of viable perfusion reproducible 3-4 days. Hemolysis remains a central factor limiting perfusion longevity, as discussed above. However, we found that significantly increasing total perfusate volume can substantially extend the duration of perfusion if longer perfusion times are required, but this increases resource utilization beyond what we describe here. Optimal perfusion duration will ultimately depend on the specific experimental question being asked of the system. For example, studies investigating drug delivery kinetics or pathway inhibition may be effectively conducted over 2-12 h, whereas questions involving cell recruitment into the tumor microenvironment may require 48 h32. Extending viability beyond the current window may be important for applications such as extracellular matrix remodeling (i.e., fibrosis), but we believe most cancer-related applications will not require the extra resource expenditure. The primary focus was on oncology-oriented translational applications, aiming to maintain human tumors in a controlled ex vivo environment in which therapy can be delivered through intact parenchyma and tumor vasculature, conditions that more closely replicate the complexities of in vivo scenarios25. In this scenario, the system addresses longstanding issues in current pre-clinical oncology models related to drug delivery, tumor heterogeneity, and drug metabolism, which may explain the frequent failure to translate pre-clinical success into clinical efficacy33,34.
Compared to existing commercial machines, the system offers significant cost advantages, modular scalability, and experimental flexibility. Commercial devices are often proprietary, costly, and optimized for full-organ perfusion in transplant settings. The system is scalable in a way that commercial machines are not, such that we can envision its applicability broadly. The system presented herein is not a final product but rather a blueprint, which can be modified, adapted, and repurposed to fit a wide variety of research interests and experimental questions, filling a void for scientists across many disciplines.
Future directions for this platform include scaling down to subsegmental liver segments and perfusate volume to enable the use of autologous blood products to support immuno-oncology applications. We are also working to integrate multi-omics platforms and real-time imaging to provide dynamic monitoring of treatment response, paving the way for detailed pharmacological studies. We hope that the system will encourage collaboration and innovation in an effort to forge new depths of knowledge across multiple fields of translational science.
Disclosures
The authors report no conflicts of interest in this study and its findings. The research reported in this publication was supported by the National Institutes of Health intramural research program. Funding source for the specimen imaging and preliminary radiomics supported by the Research Award for Staff Clinicians Proposal ID 231145 to Elliot Levy.
Acknowledgements
The authors would like to acknowledge and express their appreciation in support of this project to the following groups: NIH Department of Transfusion Medicine, NIH Department of Perioperative Medicine, NIH Department of Pathology, Wagner's Meats.
Materials
| Name | Company | Catalog Number | Comments |
|---|---|---|---|
| 1/4" ID x 3/8" OD x 1/16" Wall Versilon C-219-A Flexible PVC Tubing | US Plastic Corp | 57682 | |
| 10 cc Syringes with BD Luer-Lock Tip | BD | 302995 | |
| 1cc Syringes with BD Luer-Lock Tip | BD | 309628 | |
| 25 Fr Portal Cannula | XVIVO | 11.01.520 | |
| 3D Printed Flow Sensor Holder | n/a | n/a | see GitHub for SDL files |
| 3D Printed Magnet Holder | n/a | n/a | see GitHub for SDL files |
| 48 in. H x 24 in. W White Pegboard | Home Depot | 109099 | |
| 4-Way Stopcock, Yellow, 2 Female Luer Locks, Male Luer with Spin Lock | World Precision Instruments | 14057-10 | |
| 50 cc Syringes with BD Luer-Lock Tip | BD | 309653 | |
| ACF00023 Tygon S3 by Saint Gobain | 5/16" I.D. x 1/2" O.D. x 3/32" Wall | E-3603 Non-DEHP | Phthalate-Free Lab Tubing | 50' Package Length | Hose Warehouse | ACF00023 | |
| Amphotericin | Veterinary Pharmacy | n/a | https://mms.mckesson.com/product/505635/Xgen-Pharmaceuticals-39822105505 |
| Barbed fitting, Y-connector, 3/8" Tube ID, PP, 5/PK | VWR | MFLX06368-24 | material type not critical |
| CDI 540 Calibrator | Terumo | 540CL | |
| CDI Cable Head Bracket | Terumo | CDI519CL | |
| CDI Monitor | Terumo | 500AVHCTCL | |
| CDI Pole Clamp | Terumo | CDI517CL | |
| Clave IV Tubing Connector Needleless 100/Ca | Henry Schein Dental | 1097422 | |
| Clinimix with Electrolytes | Baxter | 2B7721 | only use the amino acid side, do not mix with dextrose side |
| CO2 USP Grade 50 LB | Robert's Oxygen | R25 | |
| Computer Monitors for GUI | n/a | n/a | any type of screen for viewing GUI |
| Data Acquisition Device | Measurement Computing | USB-202 | need 2 or 3, depending on how machinery is connected |
| Desktop Power Supply for Pump | Levitronix | 100-40015 | need 2, one for HA one for PV |
| Eagle 1662 Drum Funnel with Brass Screen, 18" Diameter x 7" Height, Yellow | Global Industrial | WB440139 | |
| Epoprostenol | Veterinary Pharmacy | n/a | https://mms.mckesson.com/product/1239813/Sun-Pharmaceuticals-62756005940 |
| Female Luer ¼" barb in natural nylon cleanroom manufactured; 10 pack | VWR | MFLX40314-26 | material type not critical |
| Fitting, Polypropylene, Straight, Female Luer to Hosebarb Adapters, 1/8" ID; 25/PK | VWR | MFLX30800-08 | material type not critical |
| Fitting, Polypropylene, Straight, Male Luer Lock to Hosebarb Adapter, 1/8" ID; 25/PK | VWR | MFLX30800-18 | material type not critical |
| Fitting, PVDF, Straight, Hose Barb Reducer, 5/16" ID x ¼" ID; 10/PK | VWR | MFLX40614-62 | material type not critical |
| Flow Mounts | n/a | n/a | see GitHub for SDL files |
| Flow Sensor Clamp | Keyence | FD-XC20R1 | |
| Flow Sensor Controller | Keyence | FD-XA1 | |
| Flow Sensor Head | Keyence | FD-XS20 | |
| Flow Sensor Power Supply | Keyence | MS2-H50 | |
| Gas Blender | MCQ | GB100+2 | need 2, one for HA one for PV |
| Gas Bottle A, CDI 500 | Terumo | CDI506 | |
| Gas Bottle B, CDI 500 | Terumo | CDI507 | |
| Glucagon Kit, Glucagon 1 mg, Sterile Water 1 mL, Vial | Fresenius | 0593-03 | |
| H/S CUVETTE 1/4x1/4 W/6" EXT 1CA=10EA 70-2006-4298-4 | Terumo | 6934 | |
| Hardshell Reservoir with 150 µm filter | Haemonetics Corporation | 00205-00 | |
| Heat Cold Pad, Mul-T-Pad, TP12E Pad Size 13" x 18" for Gaymar TP700 Pump | Mul-T-Pad | 8002-062-012 | https://www.amazon.com/Heat-Cold-Mul-T-Pad-Gaymar-TP700/dp/B00HFF7876. Of note, stryker also provides similar heated water jackets to the "Mul-T-Pad C2Dx 8002-062-012" |
| Insulin | Veterinary Pharmacy | https://mms.mckesson.com/product/294668/Novo-Nordisk-Pharmaceutical-00169183311 | |
| Ismatec Model Ecoline Pump VC-280 II | Ismatec | ISM1078B-115 | |
| LTV 1200 Pediatric Ventilator | Carefusion | https://coastbiomed.com/product/carefusion-ltv-1200-ventilator/?srsltid=AfmBOopSCKwTLmKhZXcI CgGQHfiKwj__78jNWxVaznJCS aq3RjXw2E-H. This model pediatric ventilator was repurposed from hospital surplus and was not purchased. Any commercial intermittent pump or aeration machine is a suitable replacement. | |
| Main Pump Cable | Levitronix | 190-10331 | need 2, one for HA one for PV |
| MaPerSol Organ Preservation Solution, 1L Bag | Preservation Solutions | PS005 | |
| Masterflex Adapter Fittings, Luer to Luer, Tee, Avantor | VWR | MFLX45508-56 | material type not critical |
| Masterflex Female Luer 3/16" ID Barb in Natural PVDF Cleanroom Manufactured | VWR | MFLX40314-22 | material type not critical |
| Masterflex Ismatec Reglo Digital Pump with MasterflexLive, 4-Channel, 8-Roller; 115/230 VAC | Masterflex | MFLX78018-22 | https://www.avantorsciences.com/us/en/product/NA5139147/masterflex-ismatec-reglo-digital-multichannel-pumps-avantor |
| Masterflex Male Luer 1/4" ID Barb in Natural PVDF Cleanroom Manufactured, 10/PK | VWR | MFLX40318-27 | material type not critical |
| Masterflex Male Luer 3/16" ID Barb in Natural PVDF Cleanroom Manufactured | VWR | MFLX40318-22 | material type not critical |
| Medline Placenta Basin Standard Trays | MedLine | DYNJSPLACENTA | |
| MEDTRONIC DLP 2" VESSEL CANNULA, 3MM BEVELED TIP | esutures | MDT30007 | |
| Memory Foam | Best Price Mattress | https://www.amazon.com/Best-Price-Mattress-Twin-Topper/dp/B07999TQWB/ref=sr_1_2_sspa?crid=17LQXX80WX5FK&dib=eyJ2Ijo iMSJ9.oRyEE5KwmKy1pb-VvY9MOJg _MF3wr0PmXqKcOrSEbeJWS2X 5BkFs_WSfuE1OU8GS0u_T1qM IJbsoy3omRv1wfBCy2sw2fOUIX JMqAO6BSb7t_D3j745MoXjedLbo BYypyi6_Qgoc32N8bpVcmoT_k9b LECWdi_KpEmxQx2PEok1fjlK3ywO yBXwqPnXefMt5JeW5H1R7RO3fD g4tidmRoEJ-YxfU3d_iprpFpm7A3zi 7CG_BMUAaGpBcRitwqb9Q4TB5bM 1i-GcMhSFKbzaGNd76CoVVVkZRjib c9Ix-CvY.t7xCkzB81vNhO9gYLxoNen WHEwC6JJpw9T4G6iIa5N4&dib_tag =se&keywords=memory%2Bfoam&qid =1748632609&sprefix=memory%2Bfoam %2Caps%2C133&sr=8-2-spons&sp_csd =d2lkZ2V0TmFtZT1zcF9hdGY&th=1 | |
| Neodymium Magnet with Straight Unthreaded Hole | McMaster Carr | 336K834 | |
| Nitrogen, 125 CU FTGrade 4.5 High Purity | Robert's Oxygen | R32 | |
| Oxygen, 255 CU FTGrade 4.5 High Purity | Robert's Oxygen | R5 | |
| PDMSXA-2500: PermSelect 2500 centimeter sq. membrane module -- barbed fitting without MCC | Permselect | PDMSXA-2500 | can get luer or barbed fitting, but hookup will change |
| Phenylephrine HCI Injection, USP 10mg/mL 1mL Vial | Health First | 1000520 | |
| Polyurethane Warming Drape for ORS Fluid Warming Systems, Sterile, 44" x 66" | MedLine | ORS-300H | |
| Porcine Pig Blood | Lampire | 7204911 | |
| Pressure Sensor Monitor | PendoTECH | PMAT2HR | |
| PRISMAFLEX M60 SET | Baxter Healthcare Corp | 106696 | |
| PrismaSol BGK0/2.5 Replacement Solution for Continuous Renal Replacement Therapy, NON PVC | Baxter | 110240S | |
| Pump Mounting Base Plate | Levitronix | 190-10313 | need 2, one for HA one for PV |
| Pump USB Adaptor | Levitronix | 100-30391 | need 2, one for HA one for PV |
| PuraLev Driver System | Levitronix | 100-91025 | need 2, one for HA one for PV |
| PuraLev IP Adapter Cable | Levitronix | 190-10475 | need 2, one for HA one for PV |
| SHUNT SENSOR SYS500 - CA = 20EA 98-0702-1541-7 | Terumo | CDI510H | Can buy expired from esutures - work the same, sometimes have a bit of pH drift |
| Single use pressure sensor, non-sterile, polysulfone 1/4 inch hose barb | PendoTECH | PREPS-N-025 | |
| Single Use Pressure Sensors | PendoTECH | PREPS-N-025 | can be reused with sterilization, but test sensor before each use |
| Sodium Bicarbonate 8.4% Solution Lab Grade | Lab Alley | 144-55-8 | |
| Sodium taurocholate hydrate | Millipore Sigma | 86339-25G | |
| Solumedrol | Veterinary Pharmacy | n/a | https://mms.mckesson.com/product/1212228/Dr-Reddys-Laboratories-43598013074 |
| Stryker Heating Pad | Amazon | B01M74Y8DI | |
| SU Pumphead, PP, Barb 3/8“, Gamma >25kGy, DCP-30.2-G25, PuraLev | Levitronix | 100-91071 | can reuse after sterilization |
| Syringe Pump (Pump 11 Elite) | Harvard Apparatus | 70-4504 | need one per each infused drug |
| Syringe Tubing | GSS | ME2020 | |
| Water Heater and Circulator | Grant Scientific | TC120 | |
| Zosyn | Veterinary Pharmacy | n/a | https://mms.mckesson.com/product/1009456/Auromedics-Pharmaceuticals-55150011930 |
References
- Akateh, C., Beal, E. W., Whitson, B. A., Black, S. M. Normothermic ex-vivo liver perfusion and the clinical implications for liver transplantation. J Clin Transl Hepatol. 6 (3), 276-282 (2018).
- Eymard, C., Markmann, J. Normothermic ex vivo liver perfusion: Platform for liver graft assessment and therapeutic modification. Organogenesis. 14 (4), 169-171 (2018).
- Weissenbacher, A., Vrakas, G., Nasralla, D., Ceresa, C. D. L. The future of organ perfusion and re-conditioning. Transpl Int. 32 (6), 586-597 (2019).
- Rijkse, E., Jn, I. J., Minnee, R. C. Machine perfusion in abdominal organ transplantation: Current use in the netherlands. World J Transplant. 10 (1), 15-28 (2020).
- Hameed, A. M., Pleass, H. C., Wong, G., Hawthorne, W. J. Maximizing kidneys for transplantation using machine perfusion: From the past to the future: A comprehensive systematic review and meta-analysis. Medicine (Baltimore). 95 (40), e5083(2016).
- Eshmuminov, D., et al. An integrated perfusion machine preserves injured human livers for 1 week. Nat Biotechnol. 38 (2), 189-198 (2020).
- Mueller, M., et al. Long-term normothermic machine preservation of partial livers: First experience with 21 human hemi-livers. Ann Surg. 274 (5), 836-842 (2021).
- Lau, N. S., et al. Prolonged ex vivo normothermic perfusion of a split liver: An innovative approach to increase the number of available grafts. Transplant Direct. 7 (10), e763(2021).
- Hoffman, J., et al. innovative models to study ischemia/reperfusion-related redox damage in organ transplantation. Antioxidants. 12 (1), 31(2023).
- Kanani, T., et al. Development of a novel ex vivo porcine hepatic segmental perfusion proof-of-concept model towards more ethical translational research. Cureus. 15 (2), e35143(2023).
- Kanani, T., et al. A narrative review of the applications of ex-vivo human liver perfusion. Cureus. 15 (2), e34804(2023).
- Magbagbeola, M., et al. An adaptable research platform for ex vivo normothermic machine perfusion of the liver. Int J Comput Assist Radiol Surg. 18, 1101-1108 (2023).
- Riveros, S., et al. Implementation and design of customized ex vivo machine perfusion. Analysis of its first results. Artif Organs. 46 (2), 210-218 (2021).
- Raigani, S., et al. Viability testing of discarded livers with normothermic machine perfusion: Alleviating the organ shortage outweighs the cost. Clin Transplant. 34 (11), e1469(2020).
- Martins, P. N., et al. analysis, and pitfalls of clinical trials using ex situ liver machine perfusion: The international liver transplantation society consensus guidelines. Transplantation. 105 (4), 796-815 (2021).
- Yeh, H., Uygun, K. Increasing donor liver utilization through machine perfusion. Hepatology. 70 (1), 431-433 (2019).
- Wehrle, C., et al. Impact of back-to-base normothermic machine perfusion on complications and costs: A multi-center, real-world risk-matched analysis. Ann Surg. 280 (2), 300-310 (2024).
- Handley, T. J., Arnow, K. D., Melcher, M. L. Despite increasing costs, perfusion machines expand the donor pool of livers and could save lives. J Surg Res. 283, 42-51 (2023).
- Pettit, S. J., Petrie, M. C. Transplantation of hearts donated after circulatory-determined death a song of fire and ice. Circ Heart Fail. 12 (4), e005991(2019).
- Zimmerman, J., Carter, A. W. Cost-utility analysis of normothermic and hypothermic ex-situ machine perfusion in liver transplantation. Br J Surg. 109, e31-e32 (2022).
- Javanbakht, M., Mashayekhi, A., Trevor, M., Branagan-Harris, M., Atkinson, J. Cost-utility analysis of normothermic liver perfusion with the organox metra compared to static cold storage in the United Kingdom. J Med Econ. 23 (11), 1284-1292 (2020).
- Webb, A. N., Izquierdo, D. L., Eurich, D. T., Shapiro, A. M. J., Bigam, D. L. The actual operative costs of liver transplantation and normothermic machine perfusion in a Canadian setting. Pharmacoecon Open. 5, 311-318 (2021).
- Webb, A. N., Lester, E. L. W., Shapiro, A. M. J., Eurich, D. T., Bigam, D. L. Cost-utility analysis of normothermic machine perfusion compared to static cold storage in liver transplantation in the canadian setting. Am J Transplant. 22 (2), 541-551 (2022).
- Marshall, L. J., Bailey, J., Cassotta, M., Herrmann, K., Pistollato, F. Poor translatability of biomedical research using animals - a narrative review. Altern Lab Anim. 51 (2), 102-135 (2023).
- Loewa, A., Feng, J. J., Hedtrich, S. Human disease models in drug development. Nat Rev Bioeng. , (2023).
- S.5002 - FDA Modernization Act 2.0. , Food and Drug Administration. At https://www.congress.gov/bill/117th-congress/senate-bill/5002 (2022).
- Eshmuminov, D., Clavien, P. A. Long-term dynamic ex vivo organ preservation. Nat Rev Gastroenterol Hepatol. 20 (5), 267-268 (2023).
- Lascaris, B., Hoffmann, R. F., Nijsten, M. W. N., Porte, R. J., De Meijer, V. E. Continuous renal replacement therapy during long-term normothermic machine perfusion of human donor livers for up to 7 D. Transplant Direct. 10 (2), e1568(2024).
- Huang, J., et al. Incorporating a hemodialysis filter into a commercial normothermic perfusion system to facilitate long-term preservation of human split-livers. Artif Organs. 48 (9), 1008-1017 (2024).
- Clarke, G., et al. A reproducible extended ex-vivo normothermic machine liver perfusion protocol utilising improved nutrition and targeted vascular flows. Commun Med (Lond). 4 (1), 214(2024).
- Gross-Hardt, S., et al. Low-flow assessment of current ECMO/ECCO2R rotary blood pumps and the potential effect on hemocompatibility. Crit Care. 23 (1), 348(2019).
- Nakasone, E. S., Askautrud, H. A., Egeblad, M. Live imaging of drug responses in the tumor microenvironment in mouse models of breast cancer. J Vis Exp. (73), e50088(2013).
- Gutmann, D. H., et al. Precision pre-clinical modeling to advance cancer treatment. J Natl Cancer Inst. 117 (4), 586-594 (2025).
- Wong, C. H., Siah, K. W., Lo, A. W. Estimation of clinical trial success rates and related parameters. Biostatistics. 20 (2), 273-286 (2019).
Reprints and Permissions
