This protocol describes dual optical mapping of voltage and calcium transients in rat sterile pericarditis hearts to assess inflammation-induced atrial remodeling underlying postoperative atrial fibrillation.
Method Article
Optical Mapping of Atrial Electrophysiological and Calcium Handling Abnormalities in a Rat Model of Sterile Pericarditis
* These authors contributed equally
In This Article
Summary
Abstract
Postoperative atrial fibrillation (POAF) frequently arises after cardiac surgery and is associated with atrial inflammation and remodeling. The sterile pericarditis (SP) model reproduces this condition in rats, providing a valuable platform to investigate inflammation-induced atrial electrophysiology. This protocol describes the preparation of Langendorff-perfused rat hearts after SP induction and the use of simultaneous dual optical mapping to record transmembrane voltage and calcium transients. Hearts are stained with the voltage-sensitive dye RH237 and the calcium indicator Rhod-2 AM, while contractility is suppressed using blebbistatin to minimize motion artifacts. High-speed imaging enables spatiotemporal mapping of atrial action potentials and calcium dynamics during controlled pacing protocols. Quantitative parameters include action potential duration, conduction velocity, calcium transient duration, time to peak, and alternans magnitude. The method allows precise assessment of atrial conduction heterogeneity, electro-calcium coupling, and arrhythmia vulnerability under inflammatory stress. This visualized approach provides a reproducible and versatile platform for studying POAF mechanisms and testing pharmacological or genetic interventions that target atrial remodeling.
Introduction
Postoperative atrial fibrillation (POAF) is a common complication following cardiothoracic surgery, characterized by transient episodes of atrial fibrillation (AF) that typically peak within 2-4 days post-surgery. While POAF is often self-limited, it is associated with increased risk of stroke, longer hospital stays, and elevated healthcare costs1. Inflammatory stress in the atrial myocardium is considered a key contributor to its pathogenesis2.
The sterile pericarditis (SP) model is a well-established small animal model for studying POAF3,4. In this model, epicardial talc application induces localized pericardial inflammation that mimics postoperative changes. Previous studies using this model have demonstrated structural remodeling, altered gap junction expression, and calcium-handling abnormalities that predispose to arrhythmogenesis5,6,7. However, conventional electrophysiological techniques provide limited spatiotemporal information, making it difficult to capture conduction heterogeneity and electro-calcium coupling dynamics across the intact atrial surface.
Optical mapping enables simultaneous high-resolution imaging of transmembrane voltage and calcium transients (CaT) across the atrial surface, enabling precise visualization of atrial conduction, repolarization, and calcium signaling8. In this protocol, we describe dual optical mapping in Langendorff-perfused SP rat hearts. This approach allows quantification of conduction velocity, action potential duration (APD), CaT properties, and alternans under controlled pacing protocols. By integrating electrical and calcium-handling assessment in an inflamed atrial preparation, the method provides a powerful tool for studying the mechanistic basis of POAF and for testing targeted therapeutic interventions.
Protocol
All animal procedures were approved by the Institutional Animal Care and Use Committee (IACUC) under approval ID [2024]IACUC Number 4241 and conducted in accordance with institutional and national guidelines. Throughout the study, strict adherence to animal welfare guidelines was maintained, with clearly defined humane endpoints: Rats exhibiting persistent lethargy, sudden weight loss exceeding 20%, respiratory distress, inability to eat or drink normally, or severe postoperative complications were immediately euthanized using an overdose of isoflurane (5% with oxygen flow at 1 L/min) to minimize suffering.
1. Preparation of solutions and reagents
- Prepare Modified Tyrode's solution (in mM): 128.2 NaCl, 4.7 KCl, 1.3 CaCl2, 1.05 MgCl2, 1.19 NaH2PO4, 20 NaHCO3, 11.1 Glucose. Bubble with 95% O2/5% CO2, adjust pH to 7.38-7.42, and warm to 37 ± 1 °C.
- Blebbistatin: Dissolve in DMSO (5 mg/mL), store at -20°C, light-protected. Use at 10 µM final concentration.
- RH237 (voltage-sensitive dye): Dissolve in DMSO (2 mg/mL), store at −20 °C, light-protected. Use at 2 µM final concentration.
- Rhod-2 AM (calcium indicator): Dissolve in DMSO (1 mg/mL); store at −20 °C, light-protected. Use at 0.89 µM final concentration.
- Pluronic F-127 (Surfactant): 20% solution in DMSO (Commercially available reagents).
- Sodium pentobarbital (1%): Dissolve 0.1 g in 10 mL of saline for anesthesia (40 mg/kg, i.p.).
NOTE: Handle dyes and DMSO stocks with appropriate PPE; protect blebbistatin and dyes from light. Follow biosafety and chemical safety rules.
2. Equipment
- Langendorff system with temperature control (37 ± 1 °C), reservoir, bubble column, and peristaltic pump (flow 10-12 mL/min).
- Imaging: High-speed CMOS camera (≥ 1 kHz frame rate; ≥ 80 × 80 pixels field of view for atrium), LED excitation source (530 ± 25 nm), dichroic beamsplitter (~630 nm), emission filters (Rhod-2 ~590 nm; RH237 >700 nm), lens with adjustable aperture, optical table with vibration isolation. Excitation Light Source: LED laser with a maximum current of 5 A, green light with a maximum power of 2.2 W.
- Stimulation: Constant-voltage stimulator, bipolar pacing electrodes.
- Physiology: Submersible ECG electrodes; thermistor probe; black background substrate (rubber) to reduce ventricular light contamination; fine surgical instruments; ventilator for rats. Detailed inventory is available in the Table of Materials.
3. Induction of sterile pericarditis (SP) in rats
- Anesthetize male Sprague-Dawley rats (200-220 g) with 1% sodium pentobarbital (40 mg/kg, i.p.). Confirm anesthesia depth (loss of pedal reflex).
- Intubate the rat using a polyethylene or metal cannula under direct visualization. Advance the tube carefully into the trachea, positioning just above the carina, and secure it to prevent displacement. Connect to a ventilator set at a tidal volume of 2 mL/100 g, 55 breaths/min, I:E = 1:1. Confirm effective ventilation by observing symmetrical chest expansion and stable respiration.
NOTE: Avoid deep or shallow placement to prevent bronchial intubation or accidental extubation. - Prepare the surgical field. Perform a small parasternal thoracotomy (2nd intercostal space near the sternum). Gently expose the heart.
- Lift the thymus to visualize both atria. Carefully open the pericardium over the atrial surfaces with fine forceps.
- Evenly apply sterile talc over the left and right atrial surfaces using a fine spatula (talcum powder dosage: 50 mg/100 g rat body weight). Avoid spilling onto great vessels/ventricles. Replace the thymus over the atria to limit talc migration.
- Reposition the chest muscles to cover the intercostal surgical incision. After disinfection with 0.5% povidone-iodine, suture the muscles and skin to close the thoracic cavity, and administer penicillin (160,000 U/100 g, i.p.) postoperatively.
- Sham: Thoracotomy without pericardiotomy or talc application.
NOTE: Apply a thin, uniform talc layer only to atrial epicardium; excessive talc or ventricular contamination increases mortality and can confound atrial-specific readouts. Previous studies have confirmed that aseptic pericarditis surgery in rats causes severe atrial myocarditis with marked fibrosis and elevated inflammatory factors, including IL-6, IL-1β, and TGF-β13,9.
4. Heart isolation and Langendorff perfusion
- On day 3 post-surgery, anesthetize the rats with isoflurane (2-3%) via a nose cone and administer systemic heparin (250 U/Kg, i.p.) to prevent intravascular clot formation that could obstruct coronary circulation and compromise Langendorff perfusion. This time point was selected based on our previous in vivo findings that AF inducibility peaks 3-4 days after SP3, enabling the capture of the acute, inflammation-driven arrhythmogenic phase while avoiding later adhesions that interfere with dye loading and optical recordings.
NOTE: Before you begin, prepare fresh; equilibrate gas and temperature. Align optics and confirm filters/dichroic. Configure acquisition software (1-2 kHz, exposure 1 ms), and perform calibration with a fluorescent card. - Perform a rapid median thoracotomy to expose the thoracic cavity. Excise the heart en bloc with a portion of the aortic arch, and immediately immerse it in ice-cold, oxygenated Tyrode's solution to arrest metabolism and preserve tissue viability. Carefully dissect the surrounding connective tissue while maintaining a 0.5 mm aortic length for cannulation. Secure the aorta onto the Langendorff cannula using 4-0 silk sutures, ensuring an airtight seal and that the lower edge of the catheter aligns with the upper border of the atrium. Begin retrograde perfusion with oxygenated Tyrode's at a constant flow rate of 10-12 mL/min, maintaining the perfusate temperature at 37 ± 1 °C. For reproducibility, the rat aortic cannula specifications are as follows: outer diameter: 1.4 mm; inner diameter: 1.0 mm; total length: 3-4 cm; insertion depth: approximately 0.5-1.0 cm into the aortic root; tip shape: slightly tapered; material: stainless steel or blunted metal tubing. The cannula must be rigid enough to withstand perfusion pressures (typically 60-80 mmHg) without bending, and the tip should avoid obstructing the coronary ostia.
- Observe the heart for immediate reperfusion effects. Successful perfusion is indicated by prompt and brisk washout of residual blood from the coronary vasculature, restoration of a uniform pink myocardial color, and resumption of spontaneous rhythmic contractions. Minimal myocardial edema and a stable heart rate (typically 300-400 bpm) are required before further experimentation. Simultaneously record the electrocardiogram of the heart. Allow the heart to equilibrate for at least 20 min under constant perfusion before initiating optical mapping protocols.
5. Motion suppression and venting
- Add blebbistatin to the perfusate (final 10 µM). Perfuse for ~10 min until contractions cease.
- Insert a hypotensive catheter into the left ventricle via the pulmonary vein through the mitral valve to decompress the ventricle, thereby reducing intracavitary pressure while preserving atrial morphology and signal integrity. For reproducibility, the catheter specifications are: outer diameter: 1.4 mm; inner diameter: 1.0 mm; total length: 1.5 cm; insertion depth into the heart: 1.0 cm. Do not open atria to preserve atrial geometry and signals.
6. Dye loading
- Heart perfusion: After cardiac arrest, perfuse the heart at room temperature at a constant flow rate of 10-12 mL/min.
- Calcium indicator staining: Add Rhod-2 AM (final concentration 0.89 µM) and 20 µL of 20% Pluronic F-127 to 100 mL of perfusion solution. Perfuse the heart with this solution for approximately 30 minutes, until the atria and ventricles exhibit uniform red fluorescence.
- Voltage-sensitive dye staining: Add RH237 (final concentration 2 µM) to 100 mL of perfusion solution. Perfuse the heart for ~5 min until the atria and ventricles appear pink.
- Rewarming and washout: Transfer the heart back to the original perfusion system. Rewarm to physiological temperature and perfuse for 5-10 min to wash out unabsorbed dye.
NOTE: Weak CaT signals often reflect insufficient Rhod-2 loading; extend loading by 10-15 min and confirm Pluronic is fresh. If motion persists, confirm blebbistatin potency and light protection.
7. Imaging geometry and signal isolation
- Place the heart in a 37 °C imaging bath. Orient the left atrium (LA) toward the camera. Align the primary and secondary LED light sources toward LA.
- Support the heart to prevent drift; gently spread the atrium and secure it with acupuncture needles for optimal visualization. Cover the ventricles with black rubber sheets to minimize ventricular light pollution.
- Position bipolar pacing electrodes on the right atrium (RA). Place ECG electrodes near the atria for large P-wave capture.
8. Acquisition and pacing protocols
- Launch the mapping software(OMapRecord4.0 software). Set frame rate to 1-2 kHz; adjust LED load to3-4 A; field of view to encompass the entire LA. Adjust gain/exposure to avoid saturation in either channel. Optimize camera gain and exposure to avoid saturation while maximizing signal-to-noise ratio. Imaging parameters: exposure 1 ms; max camera frequency 30 kHz; sampling rate 12.5 kHz; resolution 2048 × 2048 pixels; ROI frame rate up to 3.5 kHz; spatial resolution 70 µm. These settings ensure high-fidelity AP and CaT recordings.
- S1S1 pacing (baseline): RA pacing at 7 Hz (pulse width 2-4 ms; twice diastolic threshold). Acquire ≥ 5 s movies for APD/CaT duration (CaD), time-to-peak, and conduction velocity.
- S1S2 protocol (refractoriness/AF): Deliver 30 S1 beats at 7 Hz, then a single S2; decrease S1-S2 interval from 140 ms in steps (10/5/1 ms) to refractoriness. Record CaT recovery (A2/A1), effective refractory period (ERP), AF inducibility/duration.
- Incremental pacing (alternans): Increase RA pacing from 8 to 18 Hz in 1-2 Hz steps. Record ≥ 5 s at each rate to quantify Ca-ALT, APD-ALT, and DIS-ALT. Save simultaneous dual-channel movies and synchronized ECG/stim traces for analysis.
NOTE: Maintain constant temperature and perfusion throughout pacing; hypothermia reduces conduction and exaggerates alternans artifacts.
9. Data processing and quantification
- Analyze optical signals using OMapScope 4.0 software. A 3×3 Gaussian spatial filter was applied to reduce noise while preserving signal morphology by averaging each pixel with its neighbors. Activation times are defined as the point of maximal dF/dt during the upstroke, from which conduction velocity is calculated by dividing the linear distance between the earliest and latest activation sites by the corresponding activation time difference. APD70/90 was defined as the time from the maximal dF/dT of the action potential to 70% or 90% repolarization of the AP amplitude. CaD70/90 was defined as the time from the peak of the calcium transient (Ca²⁺) to 70% or 90% decay. Alternans were quantified as follows: Ca-ALT was calculated as 1 minus the ratio of smaller to larger mean CaT amplitude, APD-ALT as the difference between the longer and shorter APD80 values, and DIS-ALT as spatially out-of-phase alternans separated by nodal lines. The RyR recovery ratio was calculated as the ratio of two consecutive CaT peaks (smaller/larger).
10. Critical parameters and acceptance criteria
- Perfusion: 10-12 mL/min, 37 ± 1 °C; stable sinus or paced rhythm; LA well-perfused.
- SNR: Upstroke dF/F ≥ 3 for both channels; minimal photobleaching over acquisition window.
- Motion: Negligible residual motion after blebbistatin; stable image registration across frames.
- Temperature: Continuous monitoring; exclude datasets with bath < 36 °C or > 38 °C during acquisition.
11. Statistical Analyses
- All statistical analyses were performed using GraphPad Prism 9. Data are presented as mean ± SEM. The normality of data distribution was assessed using the Shapiro-Wilk test. For data with a normal distribution, differences between the two groups were analyzed using an unpaired two-tailed Student's t test; for non-normally distributed data, the Mann-Whitney U test was applied. Categorical variables were analyzed using the χ2 test. A P < 0.05 was considered statistically significant.
Results
AF Inducibility
Ectopic activity and reentry are essential mechanisms contributing to POAF initiation and perpetuation2, The reentry wavelength (λ) is determined by the product of ERP and conduction velocity (CV), i.e., λ = ERP × CV. In sham-operated hearts, S1S2 pacing evoked stable atrial responses without arrhythmia (Figure 2A). In contrast, SP-treated hearts frequently exhibited abnormal responses, including atrial ectopy (Figure 2B) and reentry that degenerated into AF (Figure 2C). Quantitative analysis demonstrated that progressively shortened S2 intervals induced a significantly higher incidence of atrial ectopy or fibrillation in SP hearts compared with Sham controls (Figure 2D). The atrial effective refractory period (ERP) remained unchanged between the two groups (Figure 2E).
AP remodeling
Optical mapping of left atria at 7 Hz revealed significant electrophysiological remodeling in SP hearts. The APD70 spatial distribution map across the left atrial surface (Figure 3A) showed prolonged APD in SP hearts, which was confirmed by representative AP traces averaged across the mapped region (Figure 3B). APD quantification at 20-80% repolarization is illustrated in the measurement schematic (Figure 3C). Time to peak was similar between groups (Figure 3D), whereas APD was significantly prolonged at all repolarization levels in SP hearts (Figure 3E). Furthermore, the coefficient of variation of APD across four local regions was increased in SP hearts (Figure 3F), indicating enhanced spatial heterogeneity of repolarization. Despite these changes, atrial conduction velocity was not significantly altered (Figure 4).
Atrial calcium dysregulation
SP hearts exhibited altered calcium handling. The CaD70 spatial map across the left atrial surface (Figure 5A) showed prolonged CaD in SP hearts, which was confirmed by representative CaT traces averaged across the mapped region (Figure 5B). APD quantification at 20-80% repolarization is illustrated in the CaD measurement schematic (Figure 5C). SP atria exhibited prolonged time to peak across the mapped region (Figure 5D) and significantly prolonged CaD at all repolarization levels (Figure 5E). Furthermore, the coefficient of variation of CaD across four local regions was increased in SP hearts (Figure 5F), indicating enhanced spatial heterogeneity of calcium handling.
Enhanced atrial alternans
Cardiac alternans are closely associated with arrhythmogenesis10. To assess atrial calcium transient alternans (Ca-ALT, beat-to-beat large-small oscillations in CaT amplitude) and action potential duration alternans (APD-ALT, long-short cycles in APD), atria were subjected to programmed pacing at progressively increasing rates (PR = 8-18 Hz). Optical mapping revealed frequency-dependent atrial alternans in SP-treated rats. Representative tracings of pseudo-ECG, atrial APs, and CaTs (Figure 6A) showed prominent APD and CaT alternans in SP hearts, particularly at higher pacing rates. Quantitative analysis demonstrated that APD80 alternans (APD-ALT) was significantly increased in SP hearts across pacing rates from 7 to 18 Hz (Figure 6B), and CaT alternans (CaT-ALT) was similarly enhanced (Figure 6C), indicating that SP treatment increases both electrical and calcium transient instability in a rate-dependent manner. Notably, at PR = 9 Hz, the pseudo-ECG of SP hearts often exhibited beat-to-beat alternation in atrial T-wave morphology and amplitude (atrial T-wave alternans, Ta-ALT), reflecting the surface ECG manifestation of atrial alternans, which was rarely observed in Sham hearts. At 16-18 Hz, SP hearts further developed discordant alternans (DIS-ALT), characterized by out-of-phase regions separated by nodal lines whose positions shifted with pacing frequency (Figure 7A). The probability of DIS-ALT was significantly higher in SP rats than sham (Figure 7B).
Increased RyR Refractoriness in SP Rat Atria
Previous studies have reported that enhanced ryanodine receptor (RyR) refractoriness contributes to the genesis of calcium alternans11. Optical mapping of left atrial RyR-mediated Ca2+ release revealed impaired RyR recovery in SP-treated rats. Superimposed Ca2+ release traces across the entire mapped region at progressively decreasing S2 intervals (140-60 ms) showed slower recovery in SP hearts compared with sham (Figure 8A,B). RyR recovery curves from four local regions confirmed this impairment and revealed increased spatial variability (Figure 8C,D), as illustrated in the schematic for RyR recovery ratio calculation (Figure 8E). Quantitative analysis demonstrated that the RyR recovery ratio was significantly reduced in SP hearts across all S2 intervals (Figure 8F), accompanied by an increased coefficient of variation among local regions (Figure 8G), indicating enhanced spatial heterogeneity of RyR recovery.
Spatial co-localization of alternans and arrhythmogenic triggers in SP rats
Recent evidence indicates that alternans can facilitate reentry formation and promote arrhythmia initiation12,13. In line with this, optical mapping of SP atria revealed that regions displaying the most pronounced alternans (Figure 9A, region a) also developed discordant alternans (DIS-ALT) at a pacing rate of 17 Hz due to out-of-phase alternations with adjacent regions (region b). Importantly, the same region (region a) coincided with the site of triggered activity and reentry initiation during AF episodes (Figure 9B), highlighting a mechanistic link between alternans and the arrhythmogenic substrate in SP rats.The global ERP and CV across the atrial surface showed no significant overall change; however, regional heterogeneity in their distribution cannot be excluded, especially when combined with spatially nonuniform repolarization. Such local disparities may create zones of conduction delay and unidirectional block, favoring the initiation of functional reentry. According to phase mapping, the reentrant activity was confined to a localized region of one atrium without an anatomical boundary, forming a stable rotational core.
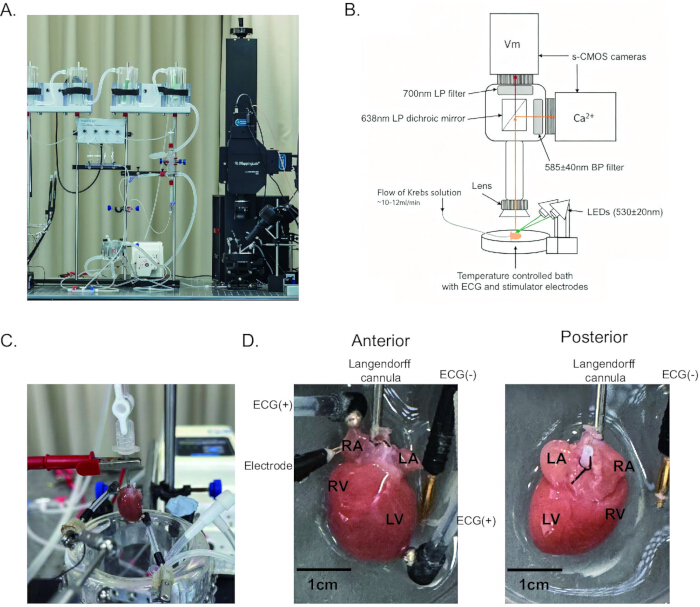
Figure 1: Optical mapping system. The overall structure of the optical mapping system is shown in (A), with a schematic diagram in (B) illustrating excitation light (green arrows) generated by the light source. Light emitted from the stained heart is split by a 630 nm long-pass dichroic mirror and detected separately by the action potential (Vm) camera and calcium signal (Ca2+) camera. The Vm camera records long-wavelength signals corresponding to membrane potential, while the Ca2+ camera detects calcium transients through a 585 ± 40 nm bandpass filter. During operation, a constant perfusion rate is maintained, and ECG is continuously recorded and simultaneously imported into the optical mapping recording software. (C) Cardiac perfusion via the aorta is performed using a Langendorff cannula, with the ECG recorder positioned adjacent to the left atrium and right ventricle for synchronization. (D) The recording setup shows the stimulator inserted into the right atrium and the ECG recorder adjacent to both the right atrium and left ventricle. The imaging bath is maintained at 37 °C using a temperature control system, ensuring stable recording conditions. Please click here to view a larger version of this figure.
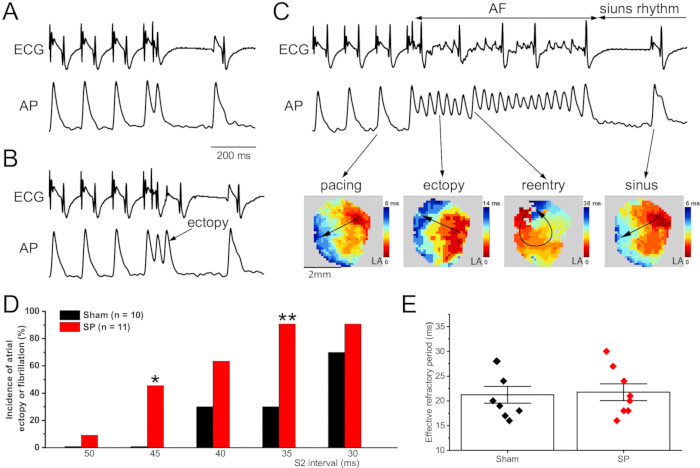
Figure 2: Atrial arrhythmia induction in sham and SP rat hearts. Representative pseudo-ECG and atrial action potential (AP) traces during S1S2 stimulation in Sham hearts (A) are shown, alongside examples of atrial ectopy induced by premature stimulation in SP hearts (B) and reentry-induced atrial fibrillation (AF) triggered by S1S2 pacing (C). (D) Incidence of atrial ectopy or fibrillation at progressively shortened S2 intervals is quantified, showing higher arrhythmia inducibility in SP hearts, while (E) atrial effective refractory period (ERP) comparison revealed no significant difference. Data are expressed as mean ± SEM; Sham, n = 10; SP, n = 11. Statistical analyses: χ² test for panel D (*P < 0.05, **P < 0.01 versus Sham) and one-way ANOVA with Bonferroni's post hoc test for panel E. All traces are aligned to stimulus onset. This figure is adapted from4. Please click here to view a larger version of this figure.
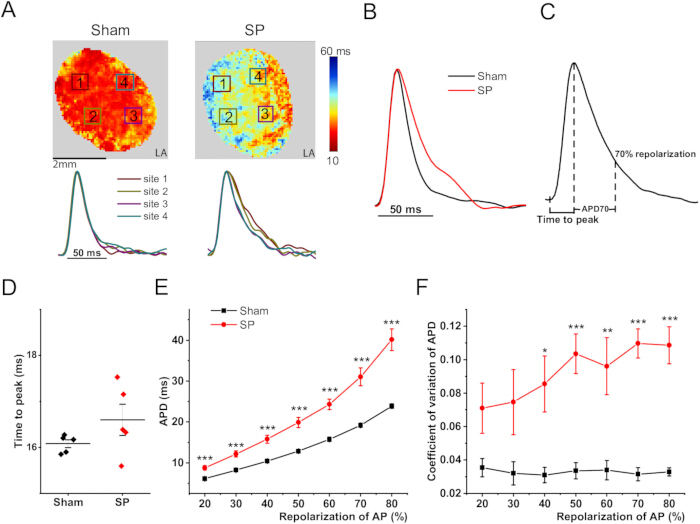
Figure 3: Left atrial APs properties recorded by optical mapping in sham and SP rat hearts. (PR = 7 Hz). APD70 spatial maps and representative AP traces from four local regions are shown in (A), with averaged AP traces across the mapped region in (B) and a schematic of AP measurement in (C).Time to peak across the mapped region is shown in (D). APD at 20-80% repolarization is quantified in (E), showing prolonged APD in SP hearts, and the coefficient of variation of APD across the four local regions is presented in (F), indicating increased spatial heterogeneity in SP hearts. Data are expressed as mean ± SEM; Sham, n = 6; SP, n = 6. Statistical analyses: t test for panels D, E, and F; *p < 0.05, **p < 0.01, ***p < 0.001 versus Sham. This figure is adapted from JCI insight4. Please click here to view a larger version of this figure.
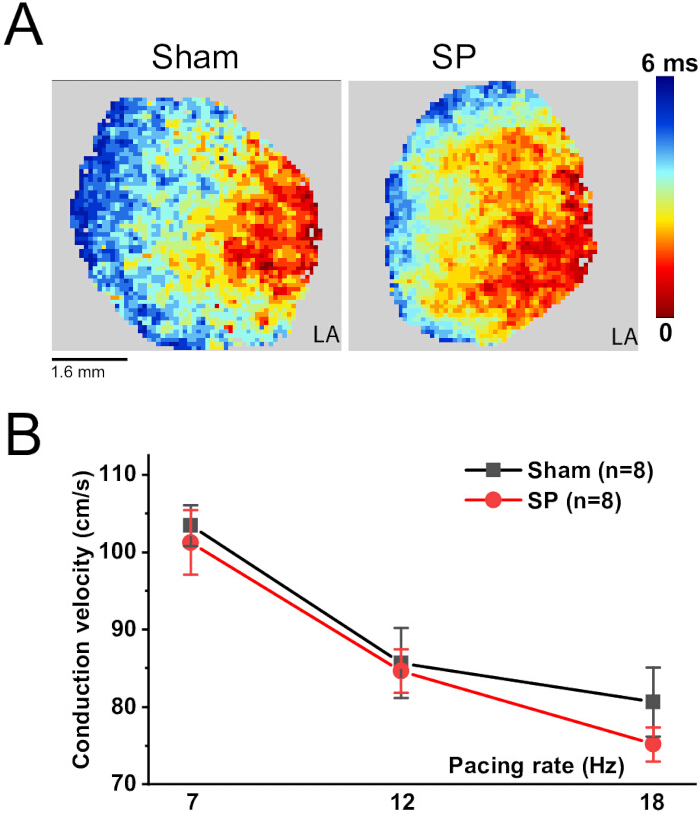
Figure 4: Atrial conduction function in sham and SP rat hearts. (A) Representative atrial surface conduction maps at PR = 7 Hz, with spatial scale = 1.6 mm and temporal scale = 6 ms. (B) Quantitative analysis of conduction velocity at PR = 7, 12, and 18 Hz, showing no significant differences between Sham and SP hearts. Data are expressed as mean ± SEM; Sham, n = 8; SP, n = 8. Statistical analyses: t test for panel B. This figure is adapted from4. Please click here to view a larger version of this figure.
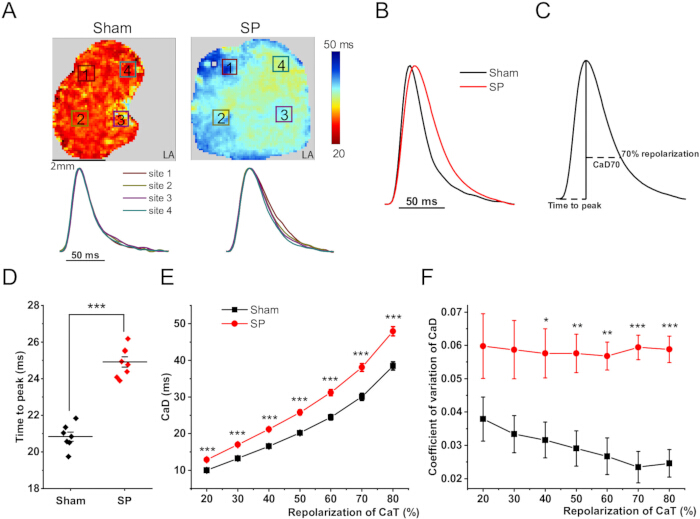
Figure 5: Left atrial CaT properties recorded by optical mapping in sham and SP rat hearts (PR = 7 Hz). CaD70 spatial maps and representative CaT traces from four local regions are shown in (A), with averaged CaT traces across the mapped region in (B) and a schematic of CaT measurement in (C). Time to peak across the mapped region is shown in (D), revealing prolonged CaT in SP hearts. CaD at 20-80% repolarization is quantified in (E), showing significant prolongation in SP hearts, and the coefficient of variation of CaD across regions is presented in (F), indicating increased spatial heterogeneity in SP hearts. Data are expressed as mean ± SEM; Sham, n = 7; SP, n = 8. Statistical analyses: t test for panels D, E, and F; *p < 0.05, **p < 0.01, ***p < 0.001 versus Sham. This figure is adapted from6. Please click here to view a larger version of this figure.
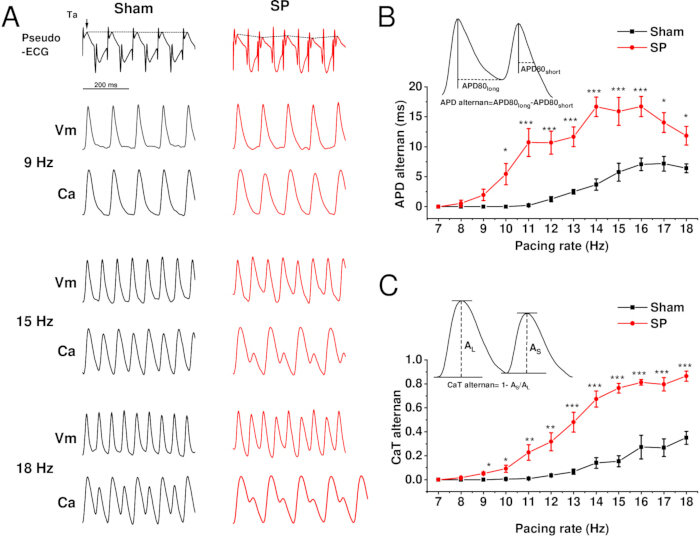
Figure 6: Frequency-dependent AP and CaT alternansin sham and SP rat hearts. (A) Representative pseudo-ECG, AP, and CaT traces at PR = 9, 15, and 18 Hz. (B) APD80 alternans across PR = 7-18 Hz are quantified, and (C) CaT alternans across the same pacing rates are shown, revealing enhanced alternans in SP hearts. Data are expressed as mean ± SEM; Sham, n = 9; SP, n = 10. Statistical analyses: t test for panels B and C; *p < 0.05, **p < 0.01, ***p < 0.001 versus Sham. This figure is adapted from4,6. Please click here to view a larger version of this figure.
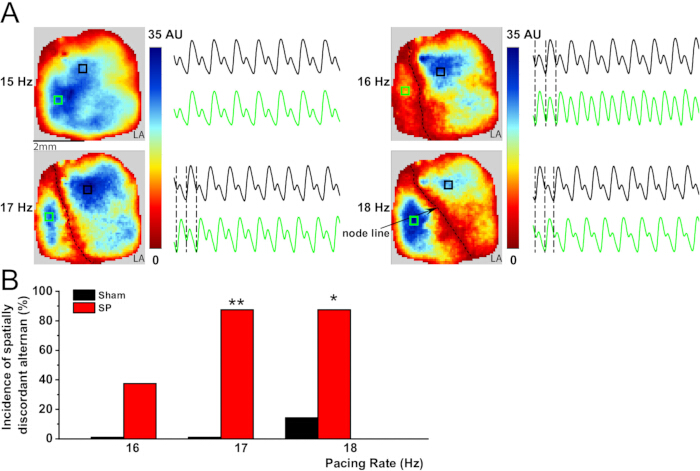
Figure 7: Discordant CaT alternans (DIS-ALT) in left atria of in sham and SP rat hearts. Ca-ALT mapping at PR = 15-18 Hz in SP hearts is shown in (A), with nodal lines indicating regions that are out-of-phase. Quantification of DIS-ALT incidence across PR is presented in (B), showing higher occurrence in SP hearts compared to Sham. Data are expressed as mean ± SEM; Sham, n = 7; SP, n = 8. Statistical analyses: χ² test for panel B; *p < 0.05, **p < 0.01 versus Sham. This figure is adapted from6. Please click here to view a larger version of this figure.
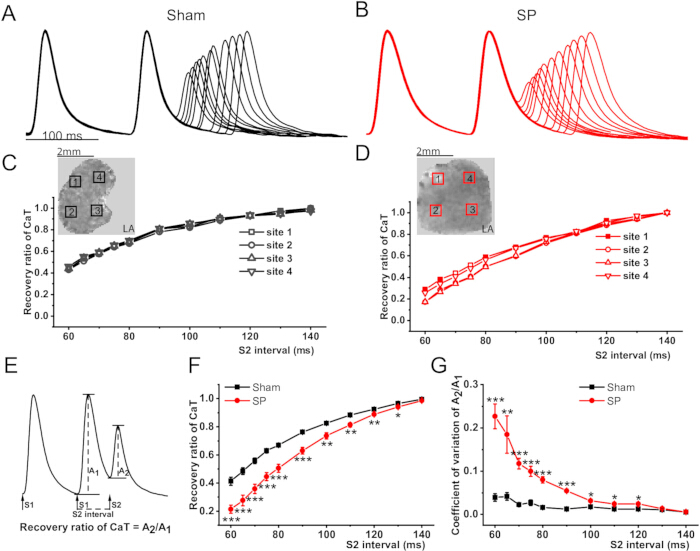
Figure 8: RyR recovery in left atria in left atria of in sham and SP rat hearts. Superimposed RyR-mediated Ca2+ release traces at decreasing S2 intervals in Sham and SP hearts are shown in panels (A) and (B), respectively. RyR recovery curves from four local regions are presented in (C) and (D), with a schematic of RyR recovery ratio calculation shown in (E). RyR recovery ratios across S2 intervals are quantified in (F), revealing reduced recovery in SP hearts, and the coefficient of variation across regions is shown in (G), indicating increased heterogeneity in SP hearts. Data are expressed as mean ± SEM; Sham, n = 7; SP, n = 8. Statistical analyses: t test for panels F and G; *p < 0.05, **p < 0.01, ***p < 0.001 versus Sham. This figure is adapted from6. Please click here to view a larger version of this figure.
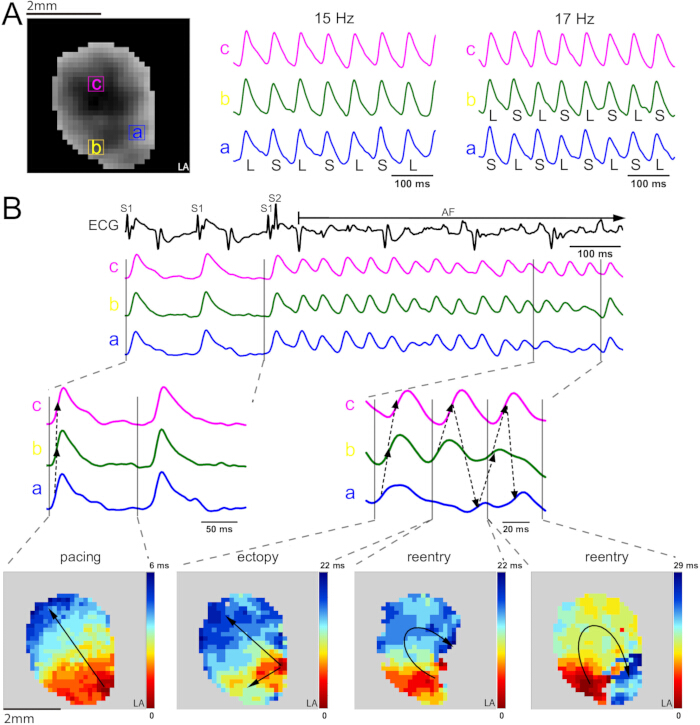
Figure 9: Spatial co-localization of alternans and arrhythmogenic triggers. (A) Left atrial surface maps show regions with prominent alternans (region a) and adjacent regions (region b), with representative AP traces from regions a, b, and c at PR = 15 and 17 Hz. Induction of AF via S1S2 pacing is shown in (B), with upper panels displaying AP traces and pseudo-ECG, and lower panels presenting spatiotemporal excitation maps at PR = 7 Hz, illustrating triggered activity and reentry. Regions exhibiting pronounced alternans co-localize with sites of AF initiation and reentry. CaT properties of the left atria were recorded by optical mapping in Sham and SP-treated rats at PR = 7 Hz. This figure is adapted from13. Please click here to view a larger version of this figure.
Discussion
This protocol describes dual optical mapping of APs and CaTs in isolated rat hearts following SP, an inflammation-driven model of POAF. Simultaneous high-resolution recording of Vm and Ca2+ signals across the intact atrial surface under programmable pacing allows assessment of APD, time to peak, conduction velocity, spatial heterogeneity of repolarization, CaD, CaT amplitude, CaT time to peak, and regional Ca handling variability. It also enables detection and quantification of frequency-dependent alternans, including APD-ALT, Ca-ALT, and DIS-ALT, as well as analysis of RyR recovery and refractoriness. Moreover, this approach identifies arrhythmogenic triggers (ectopic activity and reentry), including functional rotor-based reentry induced by SP models, and their co-localization with regions exhibiting prominent alternans, providing mechanistic insight into inflammation-induced atrial electrical remodeling and arrhythmogenesis. Notably, talc exposure in the pericardium was associated with early electrophysiological alterations indicative of inflammation-driven electrical remodeling. Nevertheless, AF is a multifactorial disorder involving electrical, structural, and functional components. Thus, we do not exclude the possibility that additional fibrotic or functional abnormalities may develop over time.
Several critical steps ensure reproducibility. Stable Langendorff perfusion and careful dye loading are required to maintain signal quality, while blebbistatin effectively suppresses motion artifacts without altering electrophysiology. Proper electrode placement and synchronization between pacing and imaging are essential for accurate assessment of conduction and alternans. Deviations in perfusion pressure, temperature, or dye concentration can compromise results and should be carefully controlled14,15.
Modifications and troubleshooting may involve adjusting dye incubation to optimize signal-to-noise ratio or using blebbistatin to reduce motion artifacts without affecting electrophysiology. Signal drift can be corrected via software baseline adjustments, and pacing protocols can be modified to explore different rates for alternans induction. Calibration is necessary when switching species or using chronic disease models, as tissue thickness and dye uptake may differ.
This study has several limitations. First, the ex vivo preparation lacks autonomic and systemic influences, and the recording window is limited by dye toxicity and photobleaching16. Second, only male rats were used to reduce hormonal variability, but sex may influence atrial electrophysiology, inflammation, and AF susceptibility; future studies including both sexes are warranted. Third, experiments were performed on day 3 post-surgery, when AF inducibility peaks, but longer-term studies are needed to assess the progression of atrial remodeling. Finally, while SP was successfully induced in all animals, additional histology or echocardiography was not performed; these could provide complementary structural or functional information, but were omitted to focus on standardizing electrophysiological methods.
This dual optical mapping approach offers advantages over traditional electrophysiological methods, such as monophasic action potential recordings or isolated cell studies, by simultaneously capturing spatially resolved Vm and Ca2+ dynamics across intact atrial tissue. It allows detailed evaluation of conduction heterogeneity, calcium-handling instability, and arrhythmia vulnerability, which cannot be fully assessed using conventional techniques. This approach is well-suited for investigating inflammation-induced atrial remodeling, including conduction heterogeneity, calcium-handling instability, and arrhythmia vulnerability. It can also be adapted to evaluate pharmacological or genetic interventions that target atrial remodeling. Moreover, the protocol may be expanded to incorporate chronic studies, structural-functional integration with imaging modalities, or sex-specific comparisons, providing a versatile tool for mechanistic investigations in cardiovascular research.
In summary, dual optical mapping in SP atria provides a robust, reproducible platform to investigate atrial electrophysiology under inflammatory stress, offering insights not achievable with traditional methods and enabling mechanism-based evaluation of antiarrhythmic strategies.
Disclosures
The authors have no conflicts of interest to disclose.
Acknowledgements
This work was supported by the National Naturel Science Foundation of China (No. 82470328, 82170326to Y.D.; No. 82300350 to J.L.). We would like to express our gratitude to Drs Guoliang Hao and Gongxin Wang (Institute of Electrophysiology, Henan Academy of Medical Sciences, Zhengzhou, China) for their outstanding assistance in optical mapping.
Materials
| Name | Company | Catalog Number | Comments |
|---|---|---|---|
| Blebbistatin | Abcam | ab120425 | |
| CaCl2 | Sigma-Aldrich | 10043-52-4 | |
| CMOS camera | MappingLab | OMS-PCIE-2002 | |
| ECG system | Chengdu Techman | BL-420F | |
| FE32 -Meter | Mettler Toledo | 30254108 | |
| Filters/dichroic mirrors | MappingLab | RH237 >700 nm; CaT 590 nm | |
| Glucose | Sigma-Aldrich | 921-60-8 | |
| Imgae bath | MappingLab | N/A | |
| KCl | Sigma-Aldrich | 7447-40-7 | |
| Langendorff perfusion system | Radnoti / Custom | N/A | |
| LED source (530 ± 25 nm) | MappingLab | N/A | |
| MgCl2 | Sigma-Aldrich | 7786-30-3 | |
| NaCl | Sigma-Aldrich | 7647-14-5 | |
| NaH2PO4 | Sigma-Aldrich | 10049-21-5 | |
| NaHCO3 | Sigma-Aldrich | 144-55-8 | |
| OMapRecord4.0 software | MappingLab | N/A | |
| OMapScope4.0 software | MappingLab | N/A | |
| Peristaltic pump | Cole-Parmer | Masterflex® L/S® | |
| Pluronic F-127 | Invitrogen | P3000MP | |
| RH237 (voltage dye) | Thermo Fisher / Invitrogen | S1109 | |
| Rhod-2 AM (Ca indicator) | Thermo Fisher / Invitrogen | R1245MP | |
| Small Animal Ventilators | YUYANBIO | V-100 | |
| Sodium pentobarbital | Sigma-Aldrich | P3761 | |
| Sprague-Dawley rats (200–220 g, male) | Local certified vendor | N/A | |
| Sterile talc powder | Sigma-Aldrich | T1586 | |
| Stimulator | MappingLab | LEDC-2002 | |
| Water bath (temp-controlled) | Ningbo Xinzhi | SC-15 |
References
- Gaudino, M., et al. Postoperative atrial fibrillation: From mechanisms to treatment. Eur Heart J. 44 (12), 1020-1039 (2023).
- Dobrev, D., Aguilar, M., Heijman, J., Guichard, J. B., Nattel, S. Postoperative atrial fibrillation: Mechanisms, manifestations and management. Nat Rev Cardiol. 16 (7), 417-436 (2019).
- Fu, X. X., et al. Interleukin-17A contributes to the development of postoperative atrial fibrillation by regulating inflammation and fibrosis in rats with sterile pericarditis. Int J Mol Med. 36 (1), 83-92 (2015).
- Liao, J., et al. TRPV4 blockade suppresses atrial fibrillation in sterile pericarditis rats. JCI Insight. 5 (23), e137528(2020).
- Huang, Z., et al. Signal transducer and activator of transcription 3/microRNA-21 feedback loop contributes to atrial fibrillation by promoting atrial fibrosis in a rat sterile pericarditis model. Circ Arrhythm Electrophysiol. 9 (7), e003396(2016).
- Liao, J., et al. Oral administration of TRPV4 inhibitor improves atrial calcium handling abnormalities in sterile pericarditis rats. Sheng Li Xue Bao. 74 (2), 188-200 (2022).
- Rossman, E. I., et al. The gap junction modifier GAP-134 improves conduction and reduces atrial fibrillation/flutter in the canine sterile pericarditis model. J Pharmacol Exp Ther. 329 (3), 1127-1133 (2009).
- Baines, O., et al. Optical mapping and optogenetics in cardiac electrophysiology research and therapy: A state-of-the-art review. Europace. 26 (2), euae017(2024).
- Wu, Q., et al. Colchicine prevents atrial fibrillation promotion by inhibiting IL1βinduced IL6 release and atrial fibrosis in the rat sterile pericarditis model. Biomed Pharmacother. 129, 110384(2020).
- Qu, Z., Weiss, J. N. Cardiac alternans: From bedside to bench and back. Circ Res. 132 (1), 127-149 (2023).
- Wang, L., et al. Optical mapping of sarcoplasmic reticulum Ca2+ in the intact heart: Ryanodine receptor refractoriness during alternans and fibrillation. Circ Res. 114 (9), 1410-1421 (2014).
- Liu, T., et al. Altered calcium handling produces reentrypromoting action potential alternans in atrial fibrillationremodeled hearts. JCI Insight. 5 (8), e133754(2020).
- Liao, J., et al. Interleukin6mediated Ca2+ handling abnormalities contribute to atrial fibrillation in sterile pericarditis rats. Front Immunol. 12, 758157(2021).
- Baines, O., et al. Optical mapping and optogenetics in cardiac electrophysiology research and therapy: A stateoftheart review. Europace. 26 (2), euae017(2024).
- Kanaporis, G., Blatter, L. A. Alternans in atria: Mechanisms and clinical relevance. Medicina (Kaunas). 53 (3), 139-149 (2017).
- Boukens, B. J., Efimov, I. R. A century of optocardiography. IEEE Rev Biomed Eng. 7, 115-125 (2014).
Reprints and Permissions
This article has been published
Video Coming Soon