We describe a procedure for profiling salivary proteins using multiplexed microsphere-based antibody arrays. Monoclonal antibodies were covalently linked to fluorescent dye-encoded 4.5 μm polymer microspheres using carbodiimide chemistry. The modified microspheres were deposited in fiber-optic microwells to measure protein levels in saliva using fluorescence sandwich immunoassays.
A subscription to JoVE is required to view this content. Sign in or start your free trial.
Method Article
Multiplexed Fluorescent Microarray for Human Salivary Protein Analysis Using Polymer Microspheres and Fiber-optic Bundles
In This Article
Summary
Abstract
Herein, we describe a protocol for simultaneously measuring six proteins in saliva using a fiber-optic microsphere-based antibody array. The immuno-array technology employed combines the advantages of microsphere-based suspension array fabrication with the use of fluorescence microscopy. As described in the video protocol, commercially available 4.5 μm polymer microspheres were encoded into seven different types, differentiated by the concentration of two fluorescent dyes physically trapped inside the microspheres. The encoded microspheres containing surface carboxyl groups were modified with monoclonal capture antibodies through EDC/NHS coupling chemistry. To assemble the protein microarray, the different types of encoded and functionalized microspheres were mixed and randomly deposited in 4.5 μm microwells, which were chemically etched at the proximal end of a fiber-optic bundle. The fiber-optic bundle was used as both a carrier and for imaging the microspheres. Once assembled, the microarray was used to capture proteins in the saliva supernatant collected from the clinic. The detection was based on a sandwich immunoassay using a mixture of biotinylated detection antibodies for different analytes with a streptavidin-conjugated fluorescent probe, R-phycoerythrin. The microarray was imaged by fluorescence microscopy in three different channels, two for microsphere registration and one for the assay signal. The fluorescence micrographs were then decoded and analyzed using a homemade algorithm in MATLAB.
Introduction
Since the first microarray reported by Mark Schena and coworkers in the mid-1990s, this powerful tool has been utilized in many fields of biological research1. Antibody microarrays capable of simultaneously detecting multiple proteins in diagnostic fluids, such as blood, have important applications in clinical diagnostics and biomarker screening2-10. Saliva, containing many of the same analytes as blood, has been considered as a preferable alternative to blood because saliva collection is safe, noninvasive, and can be carried out by minimally-trained medical personnel11-13. Currently, multiplexed protein analysis using saliva samples i....
Access restricted. Please log in or start a trial to view this content.
Protocol
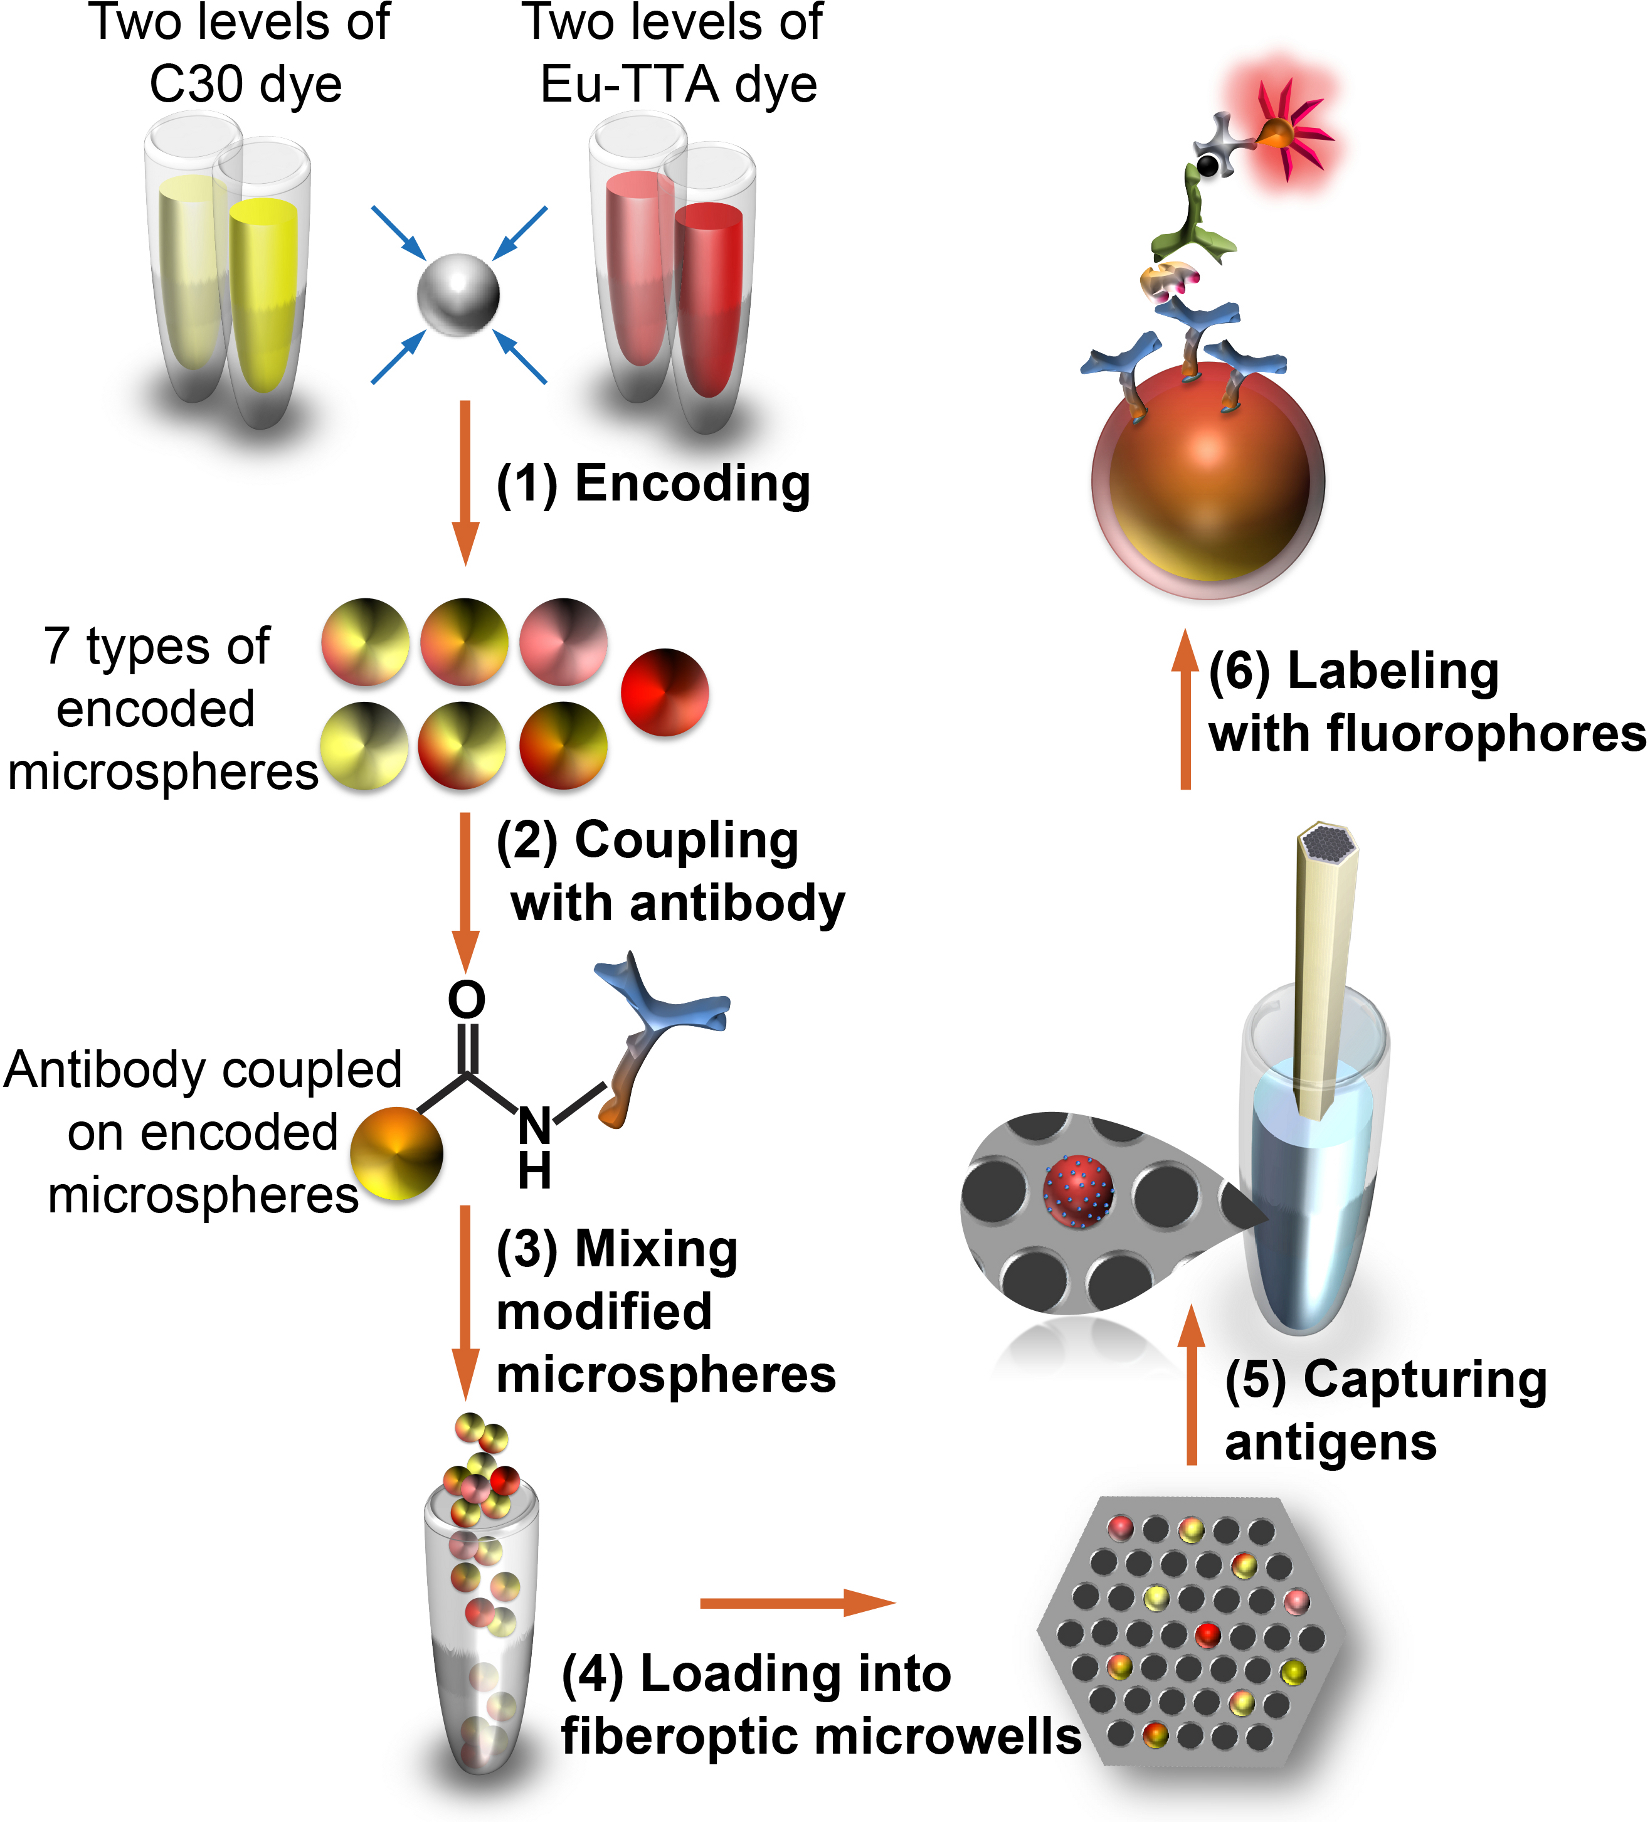
Figure 1. Workflow for applying fiber-optic microsphere antibody array to saliva profiling.
(1) Microspheres are internally encoded with two fluorescent dyes; (2) the encoded microspheres are externally modified with protein-specific monoclonal antibodies; (3) the multiplexed microspheres are mixed, and (4) randomly deposited in microwells etc....
Access restricted. Please log in or start a trial to view this content.
Results
Fluorescence images from three channels showing a small section of the fiber-optic bundle are shown in Figures 2A-C. These images were analyzed using an algorithm written in MATLAB (as described in more detail in the Discussion section). The analysis employs both information from the Eu-TTA encoding image (Figure 2A) and the C30 encoding image (Figure 2B) to decode the microspheres, and the fluorescence intensities of different microspheres in the signal image (F.......
Access restricted. Please log in or start a trial to view this content.
Discussion
Researchers should pay extra attention to the following steps: for better decoding accuracy, it is necessary to verify the microspheres were homogeneously suspended in all incubation and wash steps during the microspheres encoding procedure. In addition, the encoded microspheres need to be protected from light throughout the entire experiment. Following proper encoding and storage procedures, we found that overall decoding accuracy was above 99%. The encoded microspheres should be stored at 4 °C. Avoid freez.......
Access restricted. Please log in or start a trial to view this content.
Disclosures
The authors declare that they have no competing financial interests.
Acknowledgements
This work was supported by the National Institutes of Health (grant 08UDE017788-05). E.B.P. also acknowledges support from the Spanish Foundation for Science and Technology (FECYT). The authors thank Shonda T. Gaylord and Pratyusha Mogalisetti for critical reading of the manuscript.
....Access restricted. Please log in or start a trial to view this content.
Materials
| Name | Company | Catalog Number | Comments |
|---|---|---|---|
| Eu-TTA dye | Fisher Scientific | AC42319-0010 | |
| THF | Sigma-Aldrich | 34865-100ML | |
| Amber glass vial | Fisher Scientific | 03-339-23B | |
| Coumarin 30 dye | Sigma-Aldrich | 546127-100MG | |
| Microspheres | Bangslabs | PC05N/6698 | |
| 1.5 ml microcentrifuge tubes | Fisher Scientific | 05-408-129 | |
| PBS 10x concentrate | Sigma-Aldrich | P5493-1L | |
| Water | Sigma-Aldrich | W4502-1L | |
| Methanol | Sigma-Aldrich | 34860-100ML | |
| Tw-20 | Sigma-Aldrich | P7949-100 ml | |
| BupH MES buffered saline | Thermo Scientific | 28390 | |
| SDS | Sigma-Aldrich | 05030-500ML-F | |
| NaOH solution | Fisher Scientific | SS256-500 | |
| Safe-lock microcentrifuge tube | VWR labshop | 53511-997 | |
| EDC | Thermo Scientific | 22980 | |
| Sulfo-NHS | Thermo Scientific | 24510 | |
| Human VEGF capture antibody | R&D Systems | MAB293 | |
| Human IP-10 capture antibody | R&D Systems | MAB266 | |
| Human IL-8 capture antibody | R&D Systems | MAB208 | |
| Human EGF capture antibody | R&D Systems | MAB636 | |
| Human MMP-9 capture antibody | R&D Systems | MAB936 | |
| Human IL-1β capture antibody | R&D Systems | MAB601 | |
| Mouse IgG1 isotype control antibody | R&D Systems | MAB002 | |
| StartingBlock (TBS) buffer | Thermo Scientific | 37542 | |
| HCl standard solution 1.0 N | Sigma-Aldrich | 318949-500 ml | |
| 0.5 ml microcentrifuge tubes | Fisher Scientific | 05-408-120 | |
| Protein-free (PBS) buffer | Thermo Scientific | 37572 | |
| Recombinant human VEGF 165 | R&D Systems | 293-VE | |
| Recombinant human IP-10 | R&D Systems | 266-IP | |
| Recombinant human IL-8 | R&D Systems | 208-IL | |
| Recombinant human EGF | R&D Systems | 236-EG | |
| Recombinant human MMP-9 | R&D Systems | 911-MP | |
| Recombinant human IL-1β | R&D Systems | 201-LB | |
| StartingBlock T20 (PBS) buffer | Thermo Scientific | 37539 | |
| Blocker BSA in PBS | Thermo Scientific | 37525 | |
| Biotinylated VEGF detection antibody | R&D Systems | BAF293 | |
| Biotinylated IP-10 detection antibody | R&D Systems | BAF266 | |
| Biotinylated IL-8 detection antibody | R&D Systems | BAF208 | |
| Biotinylated EGF detection antibody | R&D Systems | BAF236 | |
| Biotinylated MMP-9 detection antibody | R&D Systems | BAF911 | |
| Biotinylated IL-1β detection antibody | R&D Systems | BAF201 | |
| Streptavidin, R-phycoerythrin | Invitrogen | S-21388 | |
| Ethanol (200 proof) | Sigma-Aldrich | E7023-500ML |
References
- Schena, M., Shalon, D., Davis, R. W., Brown, P. O. Quantitative monitoring of gene-expression patterns with a complementary-DNA microarray. Science. 270, 467-470 (1995).
- Schena, M. Protein Microarray. , Jones and Bartlett Publishers. (2004).
- Tam, S. W., Wiese, R., Lee, S., Gilmore, J., Kumble, K. D.
Access restricted. Please log in or start a trial to view this content.
Reprints and Permissions
