

Summary
We present a protocol for using a piezoelectrically-assisted tribometer and optical profilometer to investigate the dependence of ultrasonic wear and friction reduction on linear velocity, contact pressure, and surface properties.
Abstract
Friction and wear are detrimental to engineered systems. Ultrasonic lubrication is achieved when the interface between two sliding surfaces is vibrated at a frequency above the acoustic range (20 kHz). As a solid-state technology, ultrasonic lubrication can be used where conventional lubricants are unfeasible or undesirable. Further, ultrasonic lubrication allows for electrical modulation of the effective friction coefficient between two sliding surfaces. This property enables adaptive systems that modify their frictional state and associated dynamic response as the operating conditions change. Surface wear can also be reduced through ultrasonic lubrication. We developed a protocol to investigate the dependence of friction force reduction and wear reduction on the linear sliding velocity between ultrasonically lubricated surfaces. A pin-on-disc tribometer was built which differs from commercial units in that a piezoelectric stack is used to vibrate the pin at 22 kHz normal to the rotating disc surface. Friction and wear metrics including effective friction force, volume loss, and surface roughness are measured without and with ultrasonic vibrations at a constant pressure of 1 to 4 MPa and three different sliding velocities: 20.3, 40.6, and 87 mm/sec. An optical profilometer is utilized to characterize the wear surfaces. The effective friction force is reduced by 62% at 20.3 mm/sec. Consistently with existing theories for ultrasonic lubrication, the percent reduction in friction force diminishes with increasing speed, down to 29% friction force reduction at 87 mm/sec. Wear reduction remains essentially constant (49%) at the three speeds considered.
Introduction
Friction exists at the interface of two contacting surfaces when they slide or roll relative to each other. Friction usually occurs along with abrasive or adhesive wear.1 Ultrasonics is the science behind high frequency phenomena, that is, waves traveling at frequencies above the acoustic range (20 kHz). The field of ultrasonics encompasses two fundamentally different regimes. One regime involves low intensity waves like those utilized in imaging processes such as medical ultrasound or non-destructive inspection of structures. The other is a high power regime in which high-energy waves are utilized to execute or assist engineering processes such as welding of plastics and metals. It has been shown that application of the latter kind of ultrasonic vibrations at the interface of two surfaces in sliding contact reduces the effective friction force at the interface. This phenomenon is known as ultrasonic lubrication.
To achieve ultrasonic lubrication between two sliding objects, relative vibration at ultrasonic frequencies must be established between them. Vibrations are typically applied to one of the two objects, either in the longitudinal, transverse, or perpendicular direction relative to the sliding velocity. In this study, a tribometer’s pin is fitted with a piezoelectric actuator so that its tip vibrates in the direction perpendicular to the tribometer’s rotating disc. Piezoelectric materials are a class of “smart” materials that deform when exposed to electric fields, vibrating at the same frequency as the excitation field. Piezoelectric materials can vibrate at frequencies well into the MHz range. Being superimposed to the macroscopic velocity, ultrasonic vibrations have the effect of alternating the direction of the instantaneous friction force and the contact between the surfaces, which in combination leads to a reduction of the effective friction force and surface wear.
Ultrasonic friction reduction has been demonstrated in practical manufacturing systems. For example, this technology has been utilized to reduce the force between tool and work piece in metal machining and forming processes such as drilling, pressing, sheet rolling, and wire drawing. Benefits include improved surface finish2 and a reduced need for expensive and environmentally harmful detergents to remove lubricants from the final product. There are potential applications of ultrasonic lubrication in other areas as well. For example, ultrasonic lubrication can substantially enhance the user experience in personal health care products by eliminating the need for lubricants or coatings. In automobile applications, friction modulation can improve the performance of ball joints whereas friction reduction between vehicle seats and rails facilitates seat movement, saving space and mass that would otherwise be occupied by traditional components and mechanisms. Ultrasonic lubrication can also help to improve fuel efficiency by reducing friction in powertrain and suspension systems.3 In space applications, where traditional lubricants cannot be used, ultrasonic lubrication can be employed to reduce wear and dramatically extend the life of critical components.
Laboratory demonstrations of friction reduction through ultrasonic lubrication are numerous. Friction reduction is quantified as the difference between the friction force measured without ultrasonic lubrication and the friction force with ultrasonic vibrations applied. In either case, the friction force is directly measured with force sensors. Littmann et al. 4-5 connected a piezoelectrically-driven actuator to a slider, on which a force sensor and a frame were installed for measuring friction forces and applying normal loads. A pneumatic actuator was employed to push the slider together with the actuator along a guide rail. Ultrasonic vibrations were applied in the direction longitudinal to the sliding velocity. Bharadwaj and Dapino6-7 conducted similar experiments using a piezoelectric stack actuator connected to a conical waveguide at either end of the stack. Contacts took place between the spherical edges of the cones and the surface of the guide rail. The effects of system parameters such as contact stiffness, normal load, and global stiffness were studied. Kumar and Hutchings8 installed a pin on a sonotrode which was energized by an ultrasonic transducer. Ultrasonic vibrations were generated and transmitted to the pin, which was placed in contact with a tool steel surface. Normal force was applied by a pneumatic cylinder and measured by a load cell. The relative motion between the pin and the disc was created by a reciprocating table.
Pohlman and Lehfeldt9 also implemented a pin-on-disc experiment. Unlike other studies, they employed a magnetostrictive transducer to generate ultrasonic vibrations. To study the optimum direction for ultrasonic friction reduction, the transducer was carefully aligned so that the vibrational direction was longitudinal, transverse, and vertical to the macroscopic velocity. They studied ultrasonic friction reduction on both dry and lubricated surfaces. Popov et al.10 utilized an actuator with conical waveguides. The actuator was placed in contact with a rotating base plate. Cones made of nine materials with various hardnesses were adopted to study the influence of material hardness on ultrasonic friction reduction. Dong and Dapino11-13 used a piezoelectric transducer to generate and transmit ultrasonic vibrations to a prismatic waveguide with rounded edges. The longitudinal vibration causes vertical vibration due to Poisson’s effect. A slider with a curved top was placed under and in contact the waveguide. A frame was built to apply normal forces at the contact interface. The slider was pulled manually around the center area of the waveguide; the friction force was measured by a load cell that was connected to the slider.
Ultrasonically-induced wear reduction was also investigated and demonstrated. Volume loss, weight loss, and surface roughness changes are employed to quantify the severity of wear.Chowdhury and Helali14 vibrated a rotating disc in a pin-on-disc setup. The vibrations were generated by a support structure of two parallel plates located under the rotating disc. The top plate has a spherical ball installed off-center on the bottom surface, which slides in a slot that was engraved at the top surface of the bottom plate. The slot was machined with a periodically variable depth so that the top plate moves vertically during rotation. The frequencies ranged around 100 Hz according to the rotational speed.
Bryant and York15-16 studied the effect of micro-vibrations on wear reduction. They inserted a carbon cylinder through a holder with one end rested on a spinning steel disc and the other end connected to a coil spring. In one case, the cylinder was snug fitted in the holder so that there was no space for vibration. In other cases, clearances were left to allow micro-vibrations of the cylinder while the cylinder was in contact with the spinning disc. The weight loss of the cylinder was measured to calculate the wear rate. It was shown that the self-generated micro-vibrations helped reduce wear by up to 50%.
Goto and Ashida17-18 also adopted a pin-on-disc experiment. They connected pin samples with a transducer via a tapered cone and a horn. The pin vibrated in the direction perpendicular to the disc surface. A mass was connected to the transducer on its top for applying normal loads. Friction forces were translated from the torque that was applied to rotate the disc. Wear was identified as adhesive because both pin and disc were made of carbon steel. Wear rates were calculated from volume loss measurements.
It has been shown that linear speed plays an important role in ultrasonic lubrication. The experimental component of this research focuses on the dependence of friction and wear reduction on linear speed.
Subscription Required. Please recommend JoVE to your librarian.
Protocol
1. Development of the Modified Tribometer
- Install chuck-motor subsystem.
- Level vibration isolation table. Place DC motor on the table; level the motor with shims and fix it with struts and bolts. Place support frame around the motor.
- Connect splined shaft to the motor shaft using a key. Put support plate on the frame with the splined shaft going through the hole in the plate. Set thrust needle-roller bearing on the support plate and around the splined shaft. Lubricate the bearing with cutting fluids.
- Connect the splined shaft to the chuck through an adapter plate, which has a splined shaft coupling on one side and the chuck’s bolt pattern on the other side. At this point, the chuck is supported by the frame through the thrust bearing and connected to the motor through the adapter plate.
- Install the gymbal assembly.
- Build the support frame using U-channel struts, brackets, and bolts. Use four long struts as pillars, and use three shorter ones as cross beams.
- Secure the four pillars to the vibration isolation table using brackets and bolts. Connect the gymbal assembly to the middle cross beam using bolts and nuts.
- Install a horizontally-oriented load cell in the gymbal assembly; rigidly connect one side of the load cell to the gymbal assembly’s frame, while connecting the other side to the gymbal arm with a wire.
- Assemble the piezoelectric actuator.
- Insert 3 in long, fully-threaded rod through the hole of the piezoelectric stack; put one washer and one nut at each end of the stack; leave about 1/8 in of thread protruding from the end of one nut.
- Tighten the nuts at both ends to create a preload in the stack. Connect the long, exposed threads to the gymbal arm using nuts and washers. Thread acorn nut onto the other end of the piezo-actuator and insert disc in the chuck (this acorn nut and disc are used for set-up purposes, not for testing).
- Adjust the height of the gymbal assembly so that the acorn nut is in contact with the top of the disc and the gymbal arm is level.
- Adjust the position of the gymbal assembly so that the contact point between the acorn nut and disc is about 25 mm away from the rotational center of the disc. Tighten all bolts in the set-up to ensure stability.
- Set up signal generation, signal amplification, and data acquisition subsystems.
- Connect data acquisition system to a lab computer. Connect the output of signal generator to the input of an electrical amplifier. Connect the amplifier output with the input wires of the piezoelectric stack. Connect the amplifier monitors to the data acquisition system.
- Connect the load cell to a signal conditioner, and then connect the output of the signal conditioner to the data acquisition system.
- Additional set-up.
- Connect air hose to shop air. Fix the end of the hose to the frame such that its outlet points at the piezo-actuator. Tape the tip of thermocouple to the piezo-actuator. Connect the thermocouple leads to reader; hang the reader on the frame.
2. Pre-test Preparation
- Calibrate the rotational speed of the motor.
- Attach magnet to the rim of the chuck. Place Hall-effect probe close to the chuck. Connect the output of the Hall-effect probe to gaussmeter that is connected to the data acquisition system.
- Open the data acquisition software and start data acquisition. Turn on the motor; turn the speed knob of the motor controller to 10 (the lowest rotational speed the motor provides). After the motor rotates for 10 revolutions, turn off the motor. End data acquisition.
- Analyze the saved data; the time between two peaks of the output signal from the gaussmeter is the time for the motor to rotate one full revolution.
- Turn the knob from 10 to 100 (the highest rotational speed the motor provides) in increments of 10; repeat steps 2.1.2 to 2.1.3.
- Place load sensor pad between the acorn nut and the disc to measure the normal force at the interface. Finely machine the surface of testing discs using a lathe.
- Clean the acorn nut and disc to be tested immediately before test.
- Put on plastic gloves and face mask.Prepare pieces of lab wipes; fold them into 1 inch squares. Spray ethanol on the tissue squares; gently wipe the surface of the acorn nut and disc with them.
- Install the clean acorn nut and disc.
- Thread the acorn nut onto the piezo-actuator, tighten it with an open-end wrench. Insert the disc in the chuck; adjust the position to make sure the tip of the acorn nut is in contact with the disc surface.
- Align the top surface of the disc and the gymbal arm. Tighten the chuck so that the disc is held firmly.
- Measure the runout of the disc rotation.
- Install laser displacement sensor in a fixture, and place the fixture next to the tribometer. Adjust the height and angle of the sensor so that the disc is within the sensor’s range and the laser beam is normal to the disc.
- Connect the sensor’s output to the data acquisition system. Start the data acquisition. Turn on the motor and rotate the disc for 10 revolutions; turn off the motor. End data acquisition.
3. Perform Testing
- Tests with ultrasonic vibrations.
- Hang 2 N weight on one hook that connects to the gymbal arm through wire and two pulleys. The weight is used to apply a normal load between the acorn nut and the disc.
- Hang another 2 N weight on the other hook that connects to the gymbal arm to provide a horizontal pretension to the load cell.
- Set the signal generator to provide a continuous sinusoidal signal with DC offset of 3 V, amplitude of 3 V, and frequency of 22 kHz (the resonance frequency of the piezo-actuator). Note that the 3 V offset is used to prevent tension in the piezo-actuator.
- Start data acquisition (reduced friction force). Turn on the amplifier and turn the gain knob to 15, which corresponds to an actual gain of 4.67 (the numbers on the gain knob are arbitrary).
- Turn on the motor; set the rotational speed to 6.67 rpm to provide a linear velocity of 20.3 mm/sec. Run the test for 4 hr.
- Turn off the motor and amplifier, and then stop the data acquisition. Remove the tested acorn nut and disc from the set-up; Repeat steps 2.3 to 2.5 to install new acorn nut and disc.
- Repeat steps 3.1.1 to 3.1.6. In step 3.1.5, set the rotational speed to 13.3 rpm and 28.7 rpm to provide linear velocities of 40.6 mm/sec and 87 mm/sec, respectively; run the tests for 2 and 0.94 hr correspondingly.
- Tests without ultrasonic vibrations.
- Repeat step 3.1.6 to change acorn nuts and discs. Repeat steps 3.1.1 to 3.1.6 with the signal generator and signal amplifier off (the friction measured is intrinsic friction ).
4. Optical Profilometer Measurements
- Measurement preparation
- Clean the discs immediately before measurements using step 2.3. Make eight evenly distributed marks around the rim of the disc. Open the profilometer software.
- Raise the lens so that there is sufficient clearance between the lens and sample platform. Level the sample platform. Place a piece of lab wipe on the platform.
- Gently place the sample on top of the tissue with one of the eight marks facing the front of the profilometer.
- Measurement settings.
- Choose VSI (Vertical-Scanning Interferometry) as the processing type. Select 5X lens for large field of view and overall shape. Pick 0.55X magnification for a scan area of 1.8 mm by 2.4 mm.
- Choose 1X scan speed. Set scan range to -100 m to 100 m. Bring the lens downward toward the sample until there is a blurry image on the screen. Adjust the height of the lens until the image is clear.
- Choose 2 as the number of scans to average for each measurement. Click the measurement button.
- Post-measurement procedures.
- Use the vision recipe that defined in the software to correct the raw image for tilt of the whole sample. Open the analysis toolbox in the software.
- Obtain the measured roughness values from the “Basic Stats” item. Obtain the measured volume loss of the wear scar within the scan area from the “Volume” item.
- Save the images of 1D profiles in x and y directions, the 2D profile, the 3D profile, as well as the table of roughness values. Turn the sample clockwise until the next mark faces the front of the profilometer.
- Repeat steps 4.2 to 4.3 for the remaining 7 marks.
- Repeat steps 4.1. to 4.4 on all six discs.
Subscription Required. Please recommend JoVE to your librarian.
Representative Results
The representative measurements presented here were obtained from the modified tribometer shown in Figure 1. The piezoelectric actuator generates vibrations with amplitude of 2.5 μm at a frequency of 22 kHz. To study the dependence of friction and wear reduction on linear velocity, three different speeds (20.3, 40.6, and 87 mm/sec) were applied to the disc by changing the rotational speed of the motor. For all three groups, the number of disc revolutions and the travel distance of the pin were chosen as 1,600 and 292.5 m, respectively. The nominal rotation diameter was 50 mm. Other parameters such as normal force, vibration frequency, and vibration amplitude remained the same for all tests (Table 1).
The friction force was sampled at a frequency of 400 Hz utilizing 2 sec sampling windows. Figure 2 shows typical data from a single sampling window. The observed fluctuation in friction force is attributed to stick-slip. The mean values of friction force were calculated and plotted against pin travel distance in Figure 3. Intrinsic friction forces are represented by dots in the figure, while friction forces with ultrasonic vibrations are shown with “x” markers. Green, blue and red are used respectively for the test data at 20.3 mm/sec, 40.6 mm/sec, and 87 mm/sec. Friction force from each test remains virtually constant once steady-state operation is achieved.
Disc runout causes inertial acceleration from vertical motion of the pin and gymbal assembly, which results in variation of the normal force. As a result, the measured friction force fluctuates as shown in Figure 3. It is emphasized that the fluctuation observed in Figure 2 is due to stick-slip. Considering the mean value of the friction force after the system has reached steady state operation, Figure 3 shows that the friction force is higher at higher linear speeds, whether or not ultrasonic vibrations are applied to the system. This result is consistent with previous studies showing that the force-speed curve has a positive slope for low linear speeds19-21.
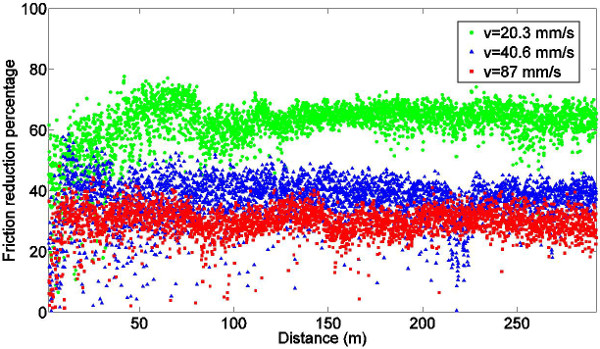
The friction reduction percentage is defined as
1. 
where is the intrinsic friction force (force without ultrasonic vibrations, measured in step 3.2) and is the friction force with ultrasonic vibrations (measured in step 3.1.4). The reduction percentage at each linear speed is plotted against the distance travelled by the pin in Figure 4. Ultrasonic vibrations reduce the steady-state friction force for all three linear speeds tested, however, the percentage decreases as the linear velocity increases.
Measured steady-state friction forces, stabilization distance, and friction reduction percentage are listed in Table 2. Ultrasonic vibrations facilitate the process of breaking down the oxide layer and forming steady contacts between the pin and the disc, which leads to a shorter distance for the friction force to reach steady state when ultrasonic vibrations are present.
Abrasive wear takes place between on the surface of materials with different hardnesses.22 Due to the difference in hardness of stainless steel (700 to 950 kg/mm2) and aluminum (45 to 50 kg/mm2), wear is identified as abrasive in this study. Wear grooves on the discs are shown in Figure 5. Images A, C, E correspond to tests with ultrasonic vibrations, while images B, D, F are data without the vibrations. It can be seen that grooves appear more uneven and non-reflective when ultrasonic vibrations are applied.
Three-dimensional profiles, surface roughness values, and volume losses of grooves are obtained from profilometer scans. 3-D profiles of the grooves with ultrasonic vibrations (Figure 6 B, D, F) appear narrower, less smooth, and shallower than the ones without vibrations (Figure 6 A, C, E), which suggests that ultrasonic vibrations cause wear reduction.
To quantify the degree of wear reduction, wear rate is defined as
2.
where is disc volume loss in mm3 (measured in step 4.3.2) and is the distance traveled by the pin in meters (Table 1). Similar to the friction reduction percentage, the wear reduction percentage is defined as
3.
where is the intrinsic wear rate (without ultrasonic vibrations) and is the wear rate with ultrasonic vibrations applied. Data in Table 3 shows that wear rates and surface roughness parameters are smaller when ultrasonic vibrations are present, which is an indicator of wear reduction. The wear reduction percentage remains virtually constant as the velocity increases.


Figure 1. Experimental set-up: (A) overall tribometer; (B) motor; (C) support frame; (D) detailed gymbal assembly; (E) piezoelectric actuator; and (F) system schematic. (This figure has been modified from 13.)

Figure 2. Typical data from one sampling window. (This figure has been modified from13.) Please click here to view a larger version of this figure.
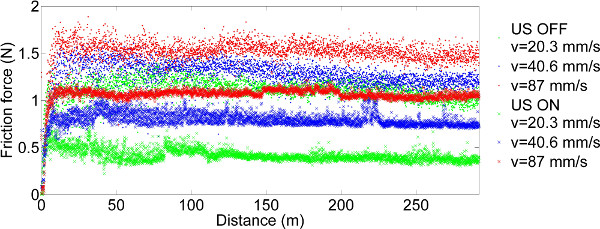
Figure 3. Friction forces with and without ultrasonic vibrations at various speeds. (This figure has been modified from 13) Please click here to view a larger version of this figure.

Figure 4. Measured friction reduction calculated from Eq. (1). (This figure has been modified from13) Please click here to see a larger version of this figure.

Figure 5. Wear grooves obtained with ultrasonic vibrations (A, C, and E) and without ultrasonic vibrations (B, D, and F). Each column corresponds to a linear speed: 20.3 mm/sec (A, B); 40.6 mm/sec (C, D); and 87 mm/sec (E, F). (This figure has been modified from13)

Figure 6. 3D profiles of wear grooves obtained without ultrasonic vibrations (A, C, and E) and with ultrasonic vibrations (B, D, and F). Each row represents a linear speed: 20.3 mm/sec (A, B); 40.6 mm/sec (C, D); and 87 mm/sec (E, F). (This figure has been modified from13) Please click here to see a larger version of this figure.
| Parameter | Value | ||
| Group | 1 | 2 | 3 |
| Linear speed (mm/sec) | 20.3 | 40.6 | 87 |
| Running time (hr) | 4 | 2 | 0.93 |
| Distance traveled by pin (m) | 292.5 | ||
| Revolutions | 1,600 | ||
| Pin material | Stainless steel 316 | ||
| Disc material | Aluminum 2024 | ||
| Nominal normal force (N) | 3 | ||
| Disc run out (mm) | 0.0286 | ||
| US frequency (kHz) | 22 | ||
| US amplitude (μm) | 2.5 | ||
| Nominal Groove diameter (mm) | 50 | ||
| Nominal temperature (°C) | 21±1 | ||
| Nominal actuator temperature (°C) | 31±1 | ||
| Environment | Laboratory air | ||
| Sampling frequency (Hz) | 400 | ||
Table 1. Parameters utilized in tribometer tests. (This table has been modified from 13)
| Linear speed (mm/sec) | US | Steady state friction (N) | Distance to achieve steady state (m) | Friction reduction (%) |
| 20.3 | No | 1.024±0.063 | 4.17 | 62.22 |
| Yes | 0.379±0.041 | 2.78 | ||
| 40.6 | No | 1.201±0.055 | 11.61 | 36.11 |
| Yes | 0.748±0.035 | 7.21 | ||
| 87 | No | 1.472±0.064 | 8.94 | 29.32 |
| Yes | 1.041±0.056 | 4.64 |
Table 2. Steady state friction forces, distances to achieve steady state, and friction reduction. (This table has been modified from13)
| Linear speed (mm/sec) | US | Ra (μm) | Rq (μm) | Rt (μm) | Wear rate (mm3/m) | Number of contacts | Wear reduction (%) |
| 20.3 | No | 18.829 | 21.421 | 124.35 | 2.237×10⁻² | 45.76 | |
| Yes | 17.238 | 18.975 | 87.011 | 1.214×10⁻² | 3.17×10⁸ | ||
| 40.6 | No | 21.647 | 22.673 | 109.28 | 2.581×10⁻² | 48.18 | |
| Yes | 17.289 | 19.922 | 106.42 | 1.338×10⁻² | 1.58×10⁸ | ||
| 87 | No | 19.825 | 21.921 | 130.52 | 2.43×10⁻² | 48.63 | |
| Yes | 17.606 | 20.126 | 111.25 | 1.248×10⁻² | 7.39×10⁸ |
Table 3. Comparison of wear rate, number of contacts, and surface roughness parameters (arithmetic average; root mean squared;maximum height of the profile). (This table has been modified from13)
Subscription Required. Please recommend JoVE to your librarian.
Discussion
Experiments were conducted using this protocol to study the effect of linear speed on ultrasonic friction and wear reduction. The measurements show that ultrasonic vibrations effectively reduce friction and wear at three linear speeds. Consistent with prior observations, the amount of friction reduction decreases from 62.2% at 20.3 mm/sec to 29.3% at 87 mm/sec. Wear reduction is negligible with changing linear speed (45.8% to 48.6%).
Material properties such as Young’s modulus and yield strength may change when ultrasonic waves are transmitted through the material. This is often referred to as ultrasonic softening23. In this study, due to the stiffness difference between the piezo-actuator and other parts of the set-up, the 22 kHz vibrations created by the actuator did not transmit to the other part of experimental set-up, although a vibration mode of the structure at around 100 Hz was excited when ultrasonic vibrations were applied. At the interface between the pin and the disc, ultrasonic vibrations cause heat generation which will cause temperature rise at the interface. However, based on experiments conducted by Dong and Dapino, the temperature rise is in a range that causes negligible changes to material properties.
One limitation of this experiment is that there is no mechanism to eliminate disc wobble, which can cause vertical motion of the pin, gymbal arm, and weight. Acceleration of the moving mass results in variations of the actual normal force applied at the interface, hence the friction forces measured. Therefore, it is critical to ensure that the motor shaft, splined shaft, chuck, and disc are level. Experimental variability can be reduced when the amount of wobble is minimized.
It is also critical to firmly tighten the acorn nut to the piezoelectric actuator so that the acorn nut does not become loose during the test. Ultrasonic vibrations are ineffective to reduce the friction force if the vibrations are not transmitted to the interface. If the friction force suddenly jumps to a higher level during the test, it is highly likely because of a loose connection between the acorn nut and the actuator. This issue is accompanied by a buzzing noise so it can be easily detected.
An electrically-powered piezo-actuator generates heat that can increase its temperature rapidly if no cooling is employed. It is essential to adjust the air flow to a proper level to remove the heat and keep the temperature of the actuator constant. Even when the piezo-actuator is turned off for tests without ultrasonic vibrations, the same air flow should still be applied so that testing conditions remain the same for all tests.
Compared to prior work, this protocol studies friction and wear simultaneously, in the same test, which was not systematically done previously. The gymbal assembly enables a more direct approach to measure friction forces at the interface than other methods which either derive friction from a measured actuation force or from other physical parameters, such as deformation or torque. The disc holder designed and built for these tests allows convenient change of test samples with various dimensions, materials, and surface roughnesses. The optical profilometer provides information such as 3D profiles and surface roughness to study wear reduction, which provides more detailed understanding of wear scars than volume loss or weight loss measurements. With these advantages, this protocol can be utilized to investigate the dependence of ultrasonic friction and wear reduction on many other parameters such as normal stress, material hardness, surface roughness, and vibrational amplitude.
Subscription Required. Please recommend JoVE to your librarian.
Disclosures
The authors have nothing to disclose.
Acknowledgments
The authors would like to acknowledge Tim Krantz from NASA Glenn and Duane Detwiler from Honda R&D for their technical support and in-kind contributions. Financial support for this research was provided by the member organizations of the Smart Vehicle Concepts Center (www.SmartVehicleCenter.org), a National Science Foundation Industry/University Cooperative Research Center (I/UCRC). S.D. is supported by a Smart Vehicle Concepts Graduate Fellowship and a University Fellowship from The Ohio State University Graduate School.
Materials
| Name | Company | Catalog Number | Comments |
| DC Motor | Minarik | SL14 | |
| Electrical amplifier | AE Techron | LVC5050 | |
| Signal conditioner | Vishay Measurements Group | 2310 | |
| Signal generator | Agilent | 33120A | |
| Piezoelectric stack | EDO corporation | EP200-62 | |
| Load cell | Transducer Techniques | MLP-50 | |
| Load sensor pad | FlexiForce | A201 | |
| Laser meter | Keyence corporation | LK-G32 | |
| Hall-effect probe and gaussmeter | Walker Scientific, Inc. | MG-4D | |
| Data acquisition module | Data Physics | Quattro | |
| Data acquisition software | Data Physics | SignalCalc Ace | |
| Thermocouple reader | Omega | HH22 | |
| Optical profilometer | Bruker | Contour GT | |
| Profilometer operation software | Bruker | Vision 64 |
References
- Bhushan, B. Introduction to tribology. , John Wiley & Sons. New York. (2002).
- Severdenko, V., Klubovich, V., Stepanenko, A. Ultrasonic rolling and drawing of metals. , Consultants Bureau. New York and London. (1972).
- Taylor, R., Coy, R. Improved fuel efficiency by lubricant design: a review. Proc. Instit. Mech. Eng., Part J: J Eng. Tribol. 214 (1), 1-15 (2000).
- Littmann, W., Storck, H., Wallaschek, J. Sliding friction in the presence of ultrasonic oscillations: superposition of longitudinal oscillations. Arch. Appl. Mech. 71 (8), 549-554 (2001).
- Littmann, W., Storck, H., Wallaschek, J. Reduction in friction using piezoelectrically excited ultrasonic vibrations. Proc. SPIE. 4331, (2001).
- Bharadwaj, S., Dapino, M. J. Friction control in automotive seat belt systems by piezoelectrically generated ultrasonic vibrations. Proc. SPIE. 7645, 7645E (2010).
- Bharadwaj, S., Dapino, M. J. Effect of load on active friction control using ultrasonic vibrations. Proc. SPIE. 7290, 7290G (2010).
- Kumar, V., Hutchings, I. Reduction of the sliding friction of metals by the application of longitudinal or transverse ultrasonic vibration. Tribol. Int. 37 (10), 833-840 (2004).
- Pohlman, R., Lehfeldt, E. Influence of ultrasonic vibration on metallic friction. Ultrasonics. 4 (4), 178-185 (1966).
- Popov, V., Starcevic, J., Filippov, A. Influence of Ultrasonic In-Plane Oscillations on Static and Sliding Friction and Intrinsic Length Scale of Dry Friction Processes. Tribol. Lett. 39 (1), 25-30 (2010).
- Dong, S., Dapino, M. J. Piezoelectrically-induced ultrasonic lubrication by way of Poisson effect. Proc. SPIE. 8343, 83430L (2012).
- Dong, S., Dapino, M. J. Elastic-plastic cube model for ultrasonic friction reduction via Poisson effect. Ultrasonics. 54 (1), 343-350 (2014).
- Dong, S., Dapino, M. J. Wear Reduction Through Piezoelectrically-Assisted Ultrasonic Lubrication. Smart. Mater. Struct. 23 (10), 104005 (2014).
- Chowdhury, M., Helali, M. The effect of frequency of vibration and humidity on the wear rate. Wear. 262 (1-2), 198-203 (2014).
- Bryant, M., Tewari, A., York, D. Effect of Micro (rocking) vibrations and surface waviness on wear and wear debris. Wear. 216 (1), 60-69 (1998).
- Bryant, M., York, D. Measurements and correlations of slider vibrations and wear. J. Tribol. 122 (1), 374-380 (2000).
- Goto, H., Ashida, M., Terauchi, Y. Effect of ultrasonic vibration on the wear characteristics of a carbon steel: analysis of the wear mechanism. Wear. 94, 13-27 (1984).
- Goto, H., Ashida, M., Terauchi, Y. Wear behaviour of a carbon steel subjected to an ultrasonic vibration effect superimposed on a static contact load. Wear. 110 (2), 169-181 (1986).
- Robinowicz, E. The friction and wear of materials. , Wiley. New Jersey. (1965).
- Bowden, F., Freitag, E. The friction of solids at very high speeds. Proc. R. Soc. A. 248 (1254), 350-367 (1985).
- Burwell, J., Rabinowicz, E. The nature of the coefficient of friction. J. Appl. Phys. 24 (2), 136-139 (1953).
- Cocks, M. Interaction of sliding metal surfaces. J. Appl. Phys. 33 (7), 2152-2161 (1962).
- Rusinko, A. Ultrasound and Irrecoverable Deformation in Metals. , LAP Lambert Academic Publishing. Saarbrücken. (2012).
