

Summary
We describe a low cost, configurable morbidostat that enables the characterization of antibiotic drug resistance by dynamically adjusting the drug concentration. The device can be integrated with a multiplexed microfluidic platform. The approach can be scaled up for laboratory antibiotic drug resistance studies.
Abstract
We describe a low cost, configurable morbidostat for characterizing the evolutionary pathway of antibiotic resistance. The morbidostat is a bacterial culture device that continuously monitors bacterial growth and dynamically adjusts the drug concentration to constantly challenge the bacteria as they evolve to acquire drug resistance. The device features a working volume of ~10 ml and is fully automated and equipped with optical density measurement and micro-pumps for medium and drug delivery. To validate the platform, we measured the stepwise acquisition of trimethoprim resistance in Escherichia coli MG 1655, and integrated the device with a multiplexed microfluidic platform to investigate cell morphology and antibiotic susceptibility. The approach can be up-scaled to laboratory studies of antibiotic drug resistance, and is extendible to adaptive evolution for strain improvements in metabolic engineering and other bacterial culture experiments.
Introduction
Since the introduction of the first antibiotic drug penicillin, microbial antibiotic resistance has developed into a global health problem1. Although the acquisition of antibiotic resistance can be retrospectively studied in vivo, the conditions of these experiments are often not controlled throughout the entire evolution2. Alternatively, adaptive laboratory evolution can reveal the molecular evolution of a microbial species under environmental stresses or selection pressure from an antibiotic drug3. Recently, many well-controlled evolutionary experiments of antibiotic drug resistance have elucidated the emergence of antibiotic drug resistance. For example, Austin's group demonstrated rapid emergence in a properly engineered microfluidic compartmented environment4. The recently developed morbidostat induces systematic mutations under drug selection pressure5,6. The morbidostat, a microbial selection device that continuously adjusts the antibiotic concentration to maintain a nearly constant population, is a major advance from the fluctuation test used in microbiology7,8. In the fluctuation test, an antibiotic drug is injected at high concentration, and the surviving mutants are screened and counted. Instead, microbes in a morbidostat are constantly challenged and acquire multiple mutations.
The morbidostat operates similarly to the chemostat, a culture device invented by Novick and Szliard in 1950 that maintains a constant population by continuously supplying nutrients while diluting the microbial population9. Since its introduction, the chemostat has been advanced and improved. Current microfluidic chemostats have reached nanoliter and single-cell capacities. However, these devices are unsuitable for adaptive evolution experiments, which require a large cell population with many mutation events10,11. Recently, mini-chemostats with working volumes of ~10 ml have also been developed to fill in the gap between liter scale bioreactors and the microfluidic chemostat12,13.
Here we present the design and use of a low-cost, automated morbidostat for an antibiotic drug resistance study. The proposed module can be employed in a shaker incubator in a microbiology laboratory with minimal hardware requirement. The open-source firmware is also easily tailored to specific applications of adaptive evolution, such as metabolic engineering3. Finally, the morbidostat is integrated into a multiplexed microfluidic platform for antibiotic susceptibility testing14.
Subscription Required. Please recommend JoVE to your librarian.
Protocol
1. Assembly and Pretesting of the Morbidostat Device
- Assembly of the Morbidostat
- Punch 3 holes on the cap of the culture vial with an 18 G syringe needle. Cut three pieces of polyethylene tubing ~7 cm in length. Insert these three pieces of polyethylene tubing on the cap.
- Use tape to wrap the edge of the cap to serve as the cast for the polydimethylsiloxane (PDMS) mixture. Mix 5 g of A component and 0.5 g of B component of the PDMS in a 150 ml plastic container by stirring manually with a toothpick. Load the mixture into a 10 ml syringe.
- Pour the PDMS mixture on the cap with the syringe. Bake the entire cap to cure the PDMS for 8 hr in the oven at 70 °C.
- Solder the LED anode with the 24 gauge wire and LED cathode with the carbon resistor with a soldering iron. Solder a 680 Ω carbon resistor with a 24 G wire. Insulate the wire connection using electrical tape.
- Solder the collector of the photodetector with the 24 G wire and the emitter of the photodetector with a 100 kΩ carbon resistor. Insulate the wire connection using electrical tape.
- Place the light emitting diode in the culture vial holder. By following the circuit diagram in Supplementary Figure 2, connect the light emitting diode and power it with a power supply of 5 V. Ensure that the LED works by using a digital camera that can detect IR (e.g., a mobile phone camera).
- Place the photodetector in the culture vial holder. By following the circuit diagram in Supplementary Figure 2, connect the photodetector and power it with a power supply of 5 V. Connect the wire to both sides of the photodetector resistors to measure the voltage across the electronic control board.
- Glue a magnet on the shaft of the cooling fan, which serves as the magnetic stirrer unit. Note that the alignment of the shaft of the fan to the culture vial, and the spacing between the culture vial and the magnet is very critical for the proper function of the magnetic stirring unit.
- Connect each piece of polyethylene tubing of the culture vial into the corresponding piece of silicone tubing for the micro-pumps, medium bottles, and waste bottle. Turn on the pump for 1 hr and measure the total volume being pumped from the medium bottle to the culture vial to determine the pump rate. Note that the typical pumping rate should be ~4 ml/hr, which corresponds to the dilution rate D = 0.33 hr−1 for a 12 ml working volume of the culture vial.
- Place the whole assembly on a mid-sized (34 cm x 34 cm x 43.5 cm) shaker incubator.
- Pretesting the Morbidostat
- Set power supply voltage of cool fan to 5 V to start its motor to test the magnetic stirring bar. Note that the stirring action can be inspected visually. The voltage that drives the cooling fan motor is precisely controlled by pulse width modulation (PWM).
- Prepare a series of wild type E. coli samples with optical densities at 600 nm typically ranging from 0.07 to 0.3 for calibration. Place a test E. coli sample in the culture vial and record the photodetector voltage.
- Place ~100 µl of the same sample in the plate reader and record the optical density. Use the photodetector voltage versus optical density data to plot the calibration curve. Note that typically, one unit change in optical density corresponds to ~7.6 V change in the photodetector with the bias scheme used here.
2. Running the Morbidostat
- Preparation Before Starting the Daily Experiment
- Prepare the culture vial with three ultra-chemical resistant Tygon tubings with inner diameter 1/32 inch and outer diameter 3/32 inch for inlets to form the device as in section 1.1 and in Supplementary Figure 1.
- Prepare the M9 minimal medium (0.2% glucose) and trimethoprim (TMP) drug containing medium. Sterilize the medium, the medium bottle, the drug medium bottle, the waste bottle, and the culture vial in an autoclave at 121 °C.
NOTE: The TMP is a stock solution that is used to later achieve the concentrations in Table 1 and the TMP drug containing medium is not autoclaved.
- Running the Morbidostat
- On the first day of the experiment, thaw 1 ml of frozen wild type E. coli MG1655 cells for 5 min at room temperature and transfer 120 µl of the cells to the culture vial containing ~12 ml of M9 growth medium. After the first day, thaw 1 ml of frozen E. coli cells from the previous day for 5 min and transfer 120 µl of the cells to a new culture vial containing ~12 ml of M9 growth medium.
- Turn on the shaker incubator and set the temperature to 30 °C with no shaking.
- Start the morbidostat operation by turning on the micro-pump, the magnetic stirring unit, and the optical density measurement.
NOTE: During the operation, a feedback threshold algorithm is used to control the drug injection. When the measured optical density exceeds a preset threshold, the drug injection pump would be turned on and the medium pump would be turned off. Otherwise, the drug injection pump remains off and the medium pump is on. - Monitor the voltage from time to time to ensure there is microbial growth.
Note: Because of the freeze and thaw cycle, E. coli cells exhibit a delay of ~4 hr during each day's growth. - After ~23 hr, stop the micro-pump by turning off its supply voltage and take out the culture vial. Add 15% glycerol into the culture vial and freeze the sample at -80 °C for storage.
- Repeat steps 2.2.1 to 2.2.5.
3. Antibiotic Susceptibility Measurement in 96 Well Format
NOTE: Perform the growth rate measurement in a plate reader with a 96 well format to determine the antibiotic resistance level.
- Thaw the daily frozen sample at room temperature for 5 min and transfer 15 µl of the cell to the culture vial containing ~15 ml M9 medium. Allow them to grow until the optical density at 600 nm reaches ~0.1. Divide the 15 ml into 1 ml bottles and add the TMP drug at this step to obtain the desired drug concentrations as shown in Table 1.
- Take 200 µl of the sample from step 3.1 and place into each well in the plate reader and allow them to grow for 12 hr5. The optical density at wavelength 600 nm is recorded automatically during the measurement.
NOTE: For each data point, triplicate measurements are recorded and averaged to ensure the consistency of the data. The data on optical density versus time can be used to obtain the growth rate. - Plot the growth rate data versus the drug concentration to obtain IC50. Note that IC50 is defined as the drug concentration at which the growth rate is fifty percent of the maximal growth rate5.
4. Single Cell Morphology and Antibiotic Susceptibility Measurement in Microfluidic Devices
- Perform fabrication of the microfluidic devices via multilayer soft lithography from PDMS as described elsewhere15.
- Use photolithography to make the photoresist mold for the control and flow layers. Note that for the control layer, use negative photoresist (~15 µm height) and positive photoresist (~8 µm height) to produce a mold on a bare silicon wafer.
- Prepare PDMS mixtures with cross linking ratios of 5:1 and 20:1 for the control layer and the flow layer, respectively. Put the mixtures into a desiccator under vacuum to remove any bubbles, for 1 hr.
- Expose the control layer photoresist molds on silicon wafer to trimethylchlorosilane (TMCS) vapor. Make the control layer of ~6 mm thickness by casting the PDMS mixture (with cross linking ratio 5:1) on the silicon wafer on the control layer photoresist mold. Bake the control layer for 40 min at 80 °C for 1 hr in the oven.
- Make the flow layer by spin coating a PDMS mixture (with cross linking ratio 20:1, spin speed 3,000 rpm for 60 sec) on a flow layer photoresist mold. Bake the flow layer for 30 min at 80 °C for 1 hr in the oven.
- Use a razor blade to cut the control layer into the desired chip size (typically 3 cm x 2 cm) and manually peel off the control layer. Place the control layer on top of the flow layer and align them under a stereomicroscope. Cure the aligned assembly at 80 °C in the oven overnight. Afterwards, soak the assembly in 250 ml of deionized water in a plastic container for 5 hr to dissolve the residual TMCS.
- Subsequently, punch the inlet holes with 20 G needles and bond the entire elastomer to a glass slide coated with a blank PDMS layer (PDMS cross linking ratio 5:1, spin speed 2,000 rpm for 30 sec) by air plasma treatment for 40 sec at 1.2 Torr air pressure.
- Carry out extensive baking for 36 hr at 80 °C to reduce the cytotoxic effects from PDMS. Note that this baking step is critical to minimize the toxicity to the bacterial cells.
- On Chip Growth Experiment
- Before loading into the microfluidic device, flush it with deionized water for 1 hr and M9 medium for 1 hr.
- Thaw the daily frozen sample at room temperature for 5 min and inoculate a new test tube with fresh M9 medium. Place the sample in a shaker incubator at 37 °C overnight.
- Dilute the microbial sample 10 fold with M9 medium and load it into the microfluidic device by pressuring the microbial sample container at 5 psi. Then load the TMP drug medium into the chip by pressuring the drug medium container at 5 psi. Execute the mixing between the microbe and drug by actuating the micromechanical valve between the two chambers on the microfluidic chip for 15 min.
- Place the microfluidic chip in the microscope incubator mounted on the inverted microscope. Acquire the cell image in the growth chamber every hr for 8 hr with the CCD camera mounted on the inverted microscope.
- Use the custom program script to calculate the cell numbers through a threshold algorithm on the cell image data18. Note that the cell number data are averaged typically over three microfluidic chambers.
Subscription Required. Please recommend JoVE to your librarian.
Representative Results
The above-described morbidostat is schematized in Figure 1. The common morbidostat operations, including experimental evolution, antibiotic susceptibility test and cell morphology checking, were validated in an E. coli MG1655 culture exposed to trimethoprim (TMP), a commonly used antibiotic drug5,6. TMP induces very distinctive stepwise increases in drug resistance, and the mutations are clustered around the dihydrofolate reductase (DHFR) gene. Therefore, TMP is a highly effective standard drug for validating the morbidostat operation. Each day, the microbe is expected to grow above the preset optical density threshold and trigger the drug injection as shown in Figure 2a. The drug injection is expected to inhibit the growth and as a result, decrease the optical density. Several trial runs may be needed to determine the optimal drug concentration. As a rule of thumb, we increase the concentration of the drug medium by 5-fold after finding that the drug medium fails to suppress the growth. After the entire course of the experiment, daily frozen samples are thawed and used to determine IC50, a quantitative measure of the drug resistance level. The plot in Figure 2b shows the temporal increase in the antibiotic drug resistance. The drug resistance increased approximately 1,500-fold to ~1,000 µg/ml over ~12 days, consistent with previous findings in laboratory evolution5 and clinical isolates19. The DHFR point mutations in the last-day mutant were measured by Sanger sequencing and are listed in Table 2. One mutation is found located on the promoter region and indicates that single point mutation in the promoter region can significantly change the expression level of the DHFR enzyme20. Another mutation at location 49,910 is located in the gene region of DHFR and is close to the active site of the DHFR enzyme21. The acquisition of drug resistance with multiple mutations proves the usefulness of the morbidostat, as the selection on drug containing agar plate tends to confer only the single mutation.
As a more sensitive readout of the cell morphology, the single-cell morphology check with antibiotic susceptibility is carried out in a parallel, multiplexed microfluidic platform14. Figure 3 shows the design of the multiplexed microfluidic chip. Micrographs of the bacterial cells (Figure 5) reveal morphology changes in both wild type and mutant strains under sub-inhibitory concentrations of TMP. Wild type strains show significant filamentation while the mutant strain shows no significant filamentation. This morphology change at a single cell level can be used in the rapid diagnostic of antibiotic resistance. Figure 4 displays the on-chip growth curves at various concentrations of TMP. The mutant sample shows a significant increase in antibiotic drug resistance. The on-chip growth data in Figure 4 is also consistent with the IC50 value from the plate reader displayed in Figure 2b.

Figure 1: Schematic of the morbidostat. The morbidostat is a continuous culture device that measures the optical density of the microbial population, and accordingly adjusts the drug concentration. The device runs in drug-injection mode and drug-dilution mode. Please click here to view a larger version of this figure.

Figure 2: Growth curve and increase of antibiotic drug resistance level. (a) Representative growth curve under feedback. The microbial growth is inhibited by the antibiotic drug, whose injection is triggered by a threshold algorithm. When the positive growth rate raises the optical density above the preset threshold (ODTH = 0.086), the device switches to drug-injection mode. Otherwise, the device runs in drug-dilution mode. Red and purple arrows indicate switching into drug injection and drug dilution modes, respectively. (b) Resistance level of the cells during 12 days of exposure to trimethoprim. The IC50 shows a distinct stepwise increase of antibiotic drug resistance. Please click here to view a larger version of this figure.

Figure 3: Microfluidic devices for investigating cell morphology and on-chip antibiotic susceptibility. (a) Micrograph of the chip layout. Green and blue compartments are the growth and drug medium chambers, respectively, and the red layout denotes the control layer. The dimensions of the growth chamber are 450 µm (l) x 400 µm (w) x 8 µm (h). The growth chamber is loaded with the bacteria, and the drug chamber is loaded with TMP. Scale bar is 1 cm. (b) Magnified view of the same chip. Scale bar = 500 µm. (c) Magnified view of both chambers before and after mixing. Please click here to view a larger version of this figure.

Figure 4: On-chip growth curves of E. coli exposed to various concentrations of TMP: (a) wild-type ancestral strain and (b) mutant strain (at day 12). The mutant sample shows a significant increase in antibiotic drug resistance. Please click here to view a larger version of this figure.

Figure 5: Single-cell morphologies (a-d) Bright field images of the cell after treatment with sub-inhibitory levels of TMP. Note the significant filamentation of the wild type cells in (b), which is absent in the mutants (d). Panels (e-h) are digitalized images of (a-d). All bacterial images were taken by a CCD camera with a 40X magnification objective. Please click here to view a larger version of this figure.
Supplementary Figure 1: The dimensions and assembly of the culture vial holder. Please click here to download this file.
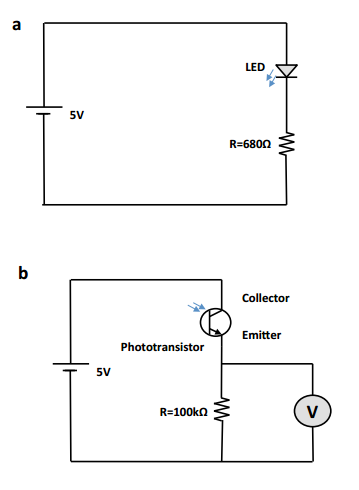
Supplementary Figure 2: The circuit diagram for the LED and photodetector. Please click here to download this file.
Supplementary Code: Custom script to count the cell number from the acquired cell images from the microfluidic chips. Please click here to download this file.
| Sample | TMP Drug (µg/ml) | |||||||||||
| Day 1-3 | 0 | 0.06 | 0.12 | 0.25 | 0.5 | 1 | 2 | 4 | 8 | 16 | 32 | |
| Day 4 | 0 | 1 | 2 | 3 | 5 | 10 | 20 | 40 | 80 | 160 | 320 | |
| Day 5-7 | 0 | 2 | 4 | 8 | 15 | 30 | 60 | 120 | 240 | 480 | 960 | |
| Day 8-12 | 0 | 3 | 7 | 15 | 30 | 60 | 125 | 250 | 500 | 1,000 | 2,000 | |
Table 1: Drug concentration used to determine IC50 in the plate reader measurement. Drug concentrations in unit of µg/ml are displayed for the daily frozen sample. As the cells develop higher drug resistance, the drug concentrations used are increased accordingly.
| No | Location | SNP | Note |
| 1 | 49,894 | C->T | DHFR gene |
| 2 | 49,910 | T->A | DHFR gene |
| 3 | 49,795 | C->T | DHFR promoter |
Table 2: Mutation in DHFR identified by Sanger sequencing. The representative sequence data show the three DHFR point mutations in the last-day mutant (day 12). The promoter and gene regions contain one and 2 SNPs, respectively. The forward and reverse primers used in the PCR were 3'TCTAGAGAGATCATTACCGA GGACCGCGAACATCTGTCAT5' and 3'ACTAGT TTACCGCCGCTC CAGAATCTCAA AGCAATAGCTG5'.
Subscription Required. Please recommend JoVE to your librarian.
Discussion
A low-footprint morbidostat device from low-cost components is demonstrated. The increases in drug resistance level registered by the device are consistent with those of previous reports5. Designed for evolutionary studies of drug resistance, the device is potentially applicable to many other experiments. First, a comprehensive database of drug-induced mutations can be established for a large set of clinically relevant antibiotics. For example, the evolutionary pathway of multiple drug resistance can be studied by simply increasing the number of drugs used in the experiment. The main advantage of the module reported here is its flexible configurability, enabling large-scale, parallel experiments under different experimental conditions.
Although the concept was demonstrated in the microfluidics measurements, the investigative power can be improved by combining microfluidics with fluidic technology23. The cost per measurement (economy of scale) is dramatically reduced by the lowered reagent consumption and reduced labor. Here, single cell morphology data can be extracted from the microfluidic platform. Recently, microfluidic morphology testing of single cells has been successfully implemented in clinical microbiology laboratories, and performs comparably to standard broth serial dilution tests24. With the increasing availability of microfluidic devices, combined technologies will enable large-scale, high-throughput laboratory evolution experiments.
Several steps are critical to run the morbidostat. Firstly, because the magnetic stirring unit is formed from magnets and a cooling fan, it is crucial to align the shaft of the fan to the culture vial. Also, the distance between the culture vial and the magnet is very critical to ensure a stable operation. Secondly, switching to a new culture vial in the beginning of each day's experiment is also important to avoid biofilm formation. Otherwise, biofilm formation can occur within 2 or 3 days. Thirdly, because E. coli samples are thawed daily from a frozen sample during each day's experiment to ensure consistency, it is important to set a delay period of at least 4 hr to avoid a total washing out of the microbes. Alternatively, one can choose not to freeze E. coli samples and directly use the sample to inoculate a new culture vial to start a new culture.
In a practical setting, the current system design must overcome several limitations to extend its potential usages. The volume of the whole system is currently limited by the medium consumed per day (during chemostatic operation, one culture vial consumes approximately 0.5 L of medium per day at the typical dilution rate of 0.33 hr−1). To reduce the working volume, further optimization can be achieved by careful simulation on the drug-inhibited population dynamics with plumbing parameters25.
Finally, the morbidostat is easily adaptable to a wide range of bacterial culture experiments. For example, by attaching a light emitting diode, the system could be reconfigured as a photo-bioreactor, enabling the evolutionary monitoring of cyanobacteria or micro algae26. The module can be extended to anaerobic and microaerobic cultivation in a gas-tight container with adsorbents by wirelessly operating the device in a battery pack. As another example, the concentration of a toxin could be gradually increased to engineer strains that are resistant to the target chemical27.
Subscription Required. Please recommend JoVE to your librarian.
Disclosures
The authors have nothing to disclose.
Acknowledgments
The authors would like to thank Prof. Sze-Bi Hsu and Ms. Zhenzhen for useful discussions and help in the theoretical analysis and numerical simulation. Y. T. Y. would like to acknowledge funding support from the Ministry of Science and Technology under grant numbers MOST 103-2220-E-007-026 and MOST 104-2220-E-007-011, and from the National Tsing Hua University under grant numbers 103N2042E1, 104N2042E1, and 105N518CE1.
Materials
| Name | Company | Catalog Number | Comments |
| Environmental Shaker Incubator | BioSan | ES-20 | |
| Arduino Leonardo board | Arduino | Leonardo | |
| 680 Ohm Carbon Resistor | Digikey | Bias resistor for LED | |
| 100k Ohm Carbon resistor | Digikey | Bias resistor for phototransistor | |
| 940 nm light emitting diode | Bright LED Electronic | BIR-BM13E4G-2 | Optical density measurement |
| 940 nm phototransistor | Kodenshi | ST-2L2B | Optical density measurement |
| Darlington pair IC Toshiba | Mouser | ULN2803APG | this IC drives micropumps and magnetic stirring unit |
| 5 V DC brushless fan | ADDA | AD0405LX-G70 | spec: 5 V supply voltage and 80 mA; available www.jameco.com |
| Piezoelectric micropump | CurieJet | PS15I-FT-5L | Pressure > 3 kPa; Flow rate >5 ml/min |
| Tygon 3350 Tuning | Saint Gobain | ABW00001 | ID: 1/32" OD: 3/32" L:50' |
| Magnetic Stir bar | COWIE | tapered shape dim: 10 mm x 4 mm | |
| Glass scintillation 20 ml vial | DGS | Pyrex glass 28 mm (diameter) x 61 mm (height) | |
| Culture vial holder | Custom made from Polyformaldehyde | ||
| Silicone | Dow Corning | Sylgald 184 | used to seal the glass vial |
| Medium bottle | VWR | 66022-065 | |
| Difco M9 minimal salt 5x | BD | Medium | |
| Cadamino Acid | BD | Medium | |
| glucose | Sigma | ||
| Agar Bateriological | Oxoid | for agar plate | |
| Luria Bertani medium | |||
| Inverted microscope | Leica Microsystems | Leica DMI-LED | used for microfluidic measurement Use 40X objective NA = 0.55 |
| Microscope Incubator | Live Cell Instrument | CU-109 | used for microfluidic measurement |
| Solenoidal valves | Pneumadyne | S10MM-31-12-3 | Normally open 1.3 Watt 12 Vdc |
| USB interface card | Hobby Engineering | USBIO24-R Digital I/O Module | for microfluidics measurement |
| Air compressor | Rocker Scientific | ROCKER 440 | Pressure source for microfluidcs; Max. Pressure 80 psi |
| Male luer-lock fittings to 1/8" barb | ValuePlastics.com | MTLL230-1 | used for microfluidic control |
| 1/8" barb to 10-32 threaded port | ValuePlastics.com | B-1 | used for microfluidic control |
| Female luer-lock fittings to 10-32 threaded port | ValuePlastics.com | KFTL-1 | used for microfluidic control |
| NPN darlington transistor 500 mA, 40 V (2N6427) | DigiKey.com | 2N6427GOS-ND | used for microfluidic control |
| 10 kOhm, carbon film resistor, 0.25 W | DigiKey.com | P10KBACT-ND | used for microfluidic control |
| Tantalum capacitor, 10 μF, 25 V, 10% | DigiKey.com | 478-1841-ND | used for microfluidic control |
| Andor CCD camera | Andor | Zyla 4.2 Plus SCMOS | used for microfluidic on chip imaging |
| ELISA plate reader | |||
| two component Silicone | Momentive | RTV 615 | used for microfluidic chip fabrication |
| SU-8 photoresist | Micrchem | SU8 2015 | used for microfluidic chip fabrication |
| AZ4620 photoresist | Clariant | AZ 4620 | used for microfluidic chip fabrication |
| Plasma cleaner | Harrick Plasma | PDC 32G | used for microfluidic chip fabrication |
| 20 Gauge Syringe Needle | BD | used for microfluidic chip fabrication | |
| Labcycler | Sensoquest | Labcycler | PCR |
| DNA polymerase | Toyobo | KDO Plus | PCR amplification |
| Trimethoprim | Sigma | ||
| Plate reader | Biotek | Synergy H1 hybrid | antibiotic resistane measurement |
References
- Levy, S. B., Marshall, B. Antibiotic resistance worldwide: causes, challenges, and responses. Nat. Med. 10, s122-s129 (2004).
- Wang, M. M., et al. Tracking the in vivo evolution of multidrug resistance in Staphylococus aureus by whole genome sequencing. Pro. Natl. Acad. Sci. 104, 9451 (2007).
- Dragosits, M., Mattanovich, D. Adaptive laboratory evolution - principles and applications for biotechnology. Microbial Cell Factory. 12, 64 (2013).
- Zhang, Q., et al. Acceleration of emergence of bacterial antibiotic resistance in connected microenvironment. Science. 333, 1764-1767 (2011).
- Toprak, E., Veres, A., Michel, J. B., Chait, R., Hartl, D. L., Kishony, R. Evolutionary paths to antibiotic resistance under dynamically sustained drug selection. Nature Genetics. 44, 101-106 (2012).
- Toprak, E., et al. Building a morbidostast: an automated continuous culture device for studying bacterial drug resistance under dynamically sustained drug inhibition. Nature Protocol. 8, 555-567 (2013).
- Rosenthal, A. Z., Elowitz, M. B. Following evolution of bacterial antibiotic resistance in real time. Nature Genetics. 44, 11-13 (2012).
- Young, K. In vitro antibacterial resistance selection and quantitation. Curr Protoc Pharmacol. , (2006).
- Novick, A., Szilard, L. Experiments with the Chemostat on spontaneous mutations of bacteria. Proc. Natl. Acad. Sci. U.S.A. 36, 708-719 (1950).
- Balagadde, F. K., You, L., Hansen, C. L., Arnold, F. H., Quake, S. R. Long-term monitoring of bacteria undergoing programmed population control in a microchemostat. Science. 309, 137-140 (2005).
- Groisman, A., et al. A microfluidic chemostat for experiments with bacterial and yeast cells. Nat. Methods. 2, 685-689 (2005).
- Miller, A. W., Befort, C., Kerr, E. O., Dunham, M. J. Design and Use of Multiplexed Chemostat Arrays. J. Vis. Exp. (72), e50262 (2013).
- Takahashi, C. N., Miller, A. W., Ekness, F., Dunham, M. J., Klavins, E. A low cost, customizable turbidostat for use in synthetic circuit characterization. ACS Synthetic Biology. , (2015).
- Mohan, R., et al. A multiplexed microfluidic platform for rapid antibiotic susceptibility testing. Biosens Bioelectrons. 49, 118-125 (2013).
- Unger, M. A., Chou, H. P., Thorsen, T., Scherer, A., Quake, S. R. Monolithic microfabricated valves and pumps by multilayer soft lithography. Science. 288, 113-116 (2000).
- Kellogg, R. A., Gomez-Sjoberg, R., Leyrat, A. A., Tay, S. Nat. Protocols. 9, 1713 (2014).
- Gu, G. Y., Lee, Y. W., Chiang, C. C., Yang, Y. T. A nanoliter microfluidic serial dilution bioreactor. Biomicrofluidics. 9, 044126 (2015).
- Gonzalez, R. C., Woods, R. E., Eddins, S. L. Digital image using Matlab processing. , Pearson Prentice Hall. Upper Saddle River, New Jersey. (2004).
- Heikkila, E., Sundstrom, L., Huovinen, P. Trimethoprim resistance in Escherichia coli isolates from a geriatric unit. Antimicrob. Agents Chemother. 34, 2013-2015 (1990).
- Flensburg, J., Skold, O. Massive overproduction of dihydrofolate reductase in bacteria as a response to the use of trimethoprim. Eur. J. Biochem. 162, 473-476 (1987).
- Ohmae, E., Sasaki, Y., Gekko, K. Effects of five-tryptophan mutations on structure, stability and function of Escherichia coli dihydrofolate reductase. J. Biochem. 130, 439-447 (2001).
- Smith, D. R., Calvo, J. M. Nucleotide sequence of dihydrofolate reductase genes from trimethoprim-resistant mutants of Escherichia coli. Evidence that dihydrofolate reductase interacts with another essential gene product. Mol. Gen. Genet. 187, 72-78 (1982).
- Okumus, B., Yildiz, S., Toprak, E. Fluidic and microfluidic tools for quantitative systems biology. Curr Opin Biotech. 25, 30-38 (2014).
- Cho, J., et al. A rapid antimicrobial susceptibility test based on single-cell morphological analysis. Sci. Transl. Med. 17, 267 (2014).
- Hsu, S. B., Waltman, P. E. Analysis of a model of two competitors in a chemostat with an external inhibitor. SIAM J. Applied Math. , 528-540 (1992).
- Fu, W., et al. Maximizing biomass productivity and cell density of Chlorella vulgaris by using light-emitting diode-based photobioreactor. J. Biotech. 161, 242-249 (2012).
- Peabody, V. G. L., Winkler, J., Kao, K. C. Tools for developing tolerance to toxic chemicals in microbial systems and perspectives on moving the field forward and into the industrial setting. Curr Opin in Chem Eng. 6, 9-17 (2014).
