< Back to Core

Chapter 8

Chapter 8

Distributions

check_url/science-education-library/80657/distributions/
The accurate values of population parameters such as population proportion, population mean, and population standard deviation (or variance) are usually …
check_url/science-education-library/80657/distributions/
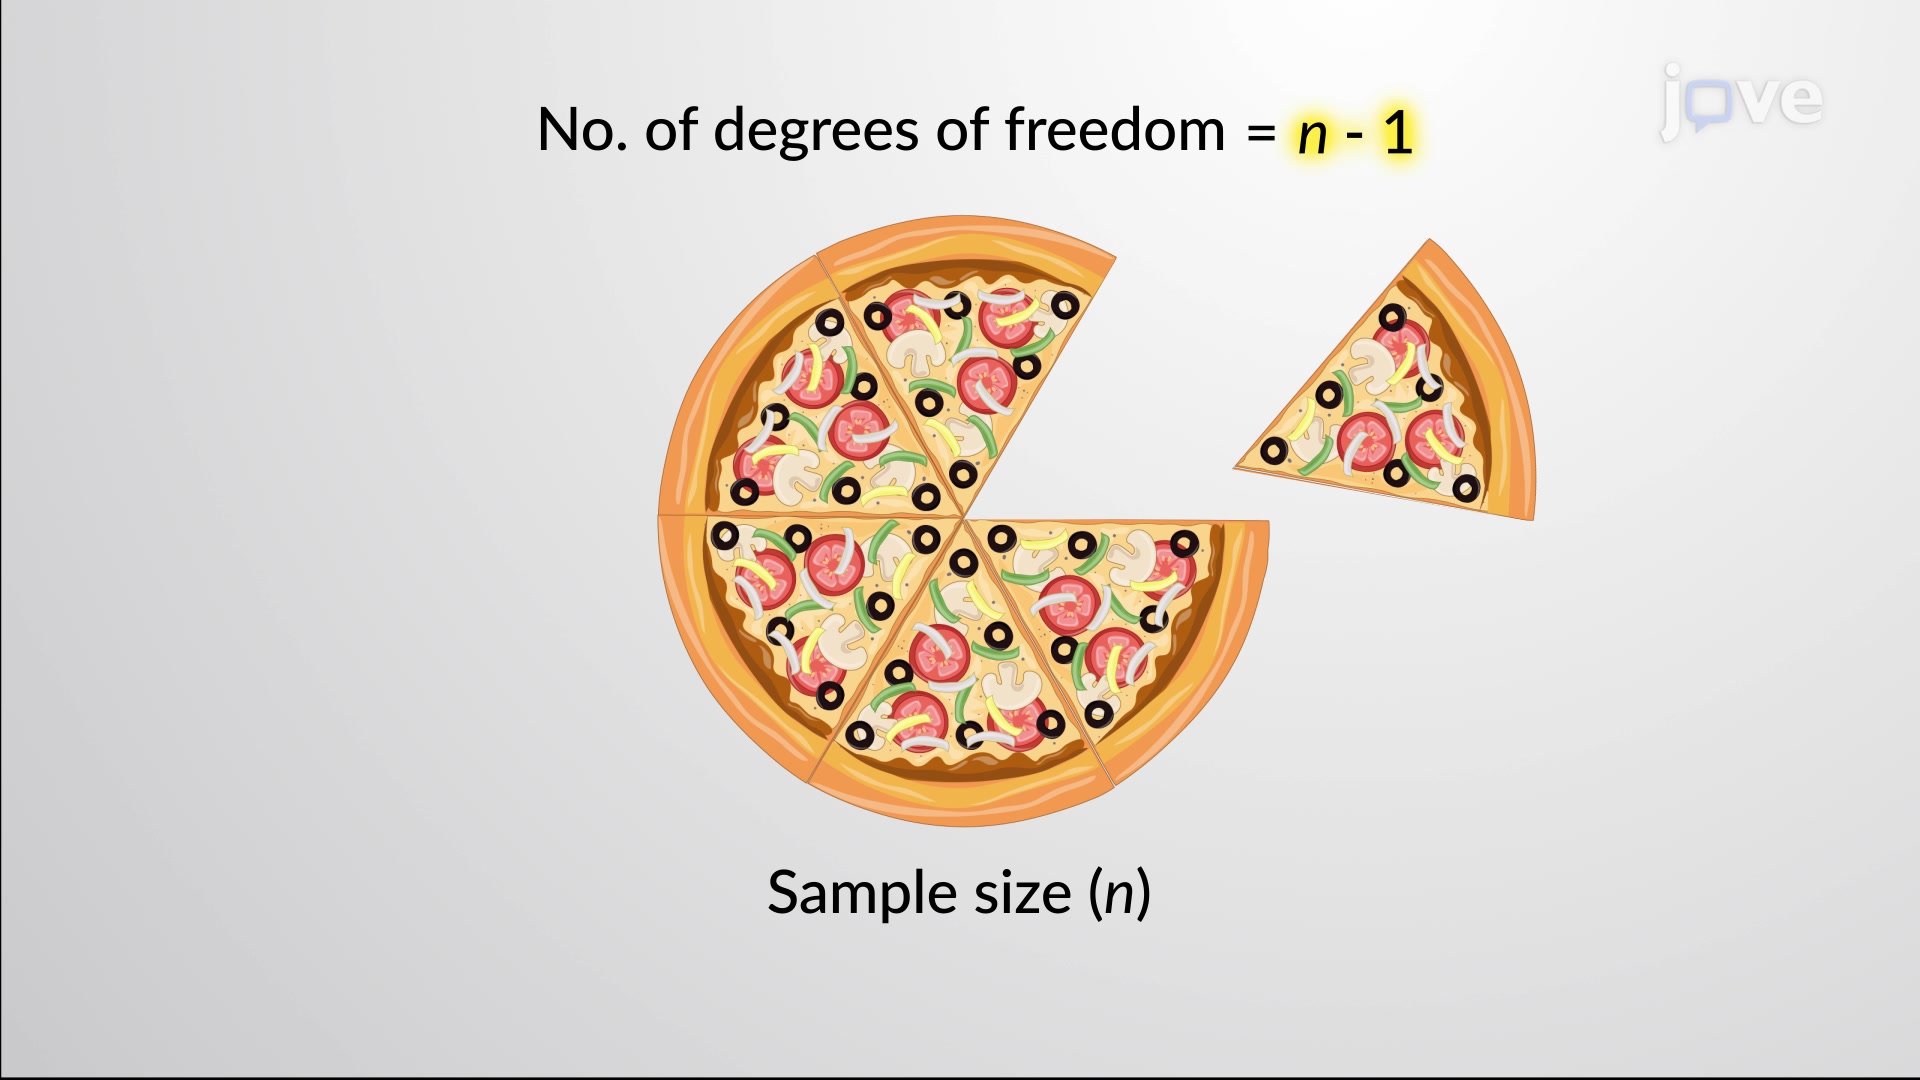
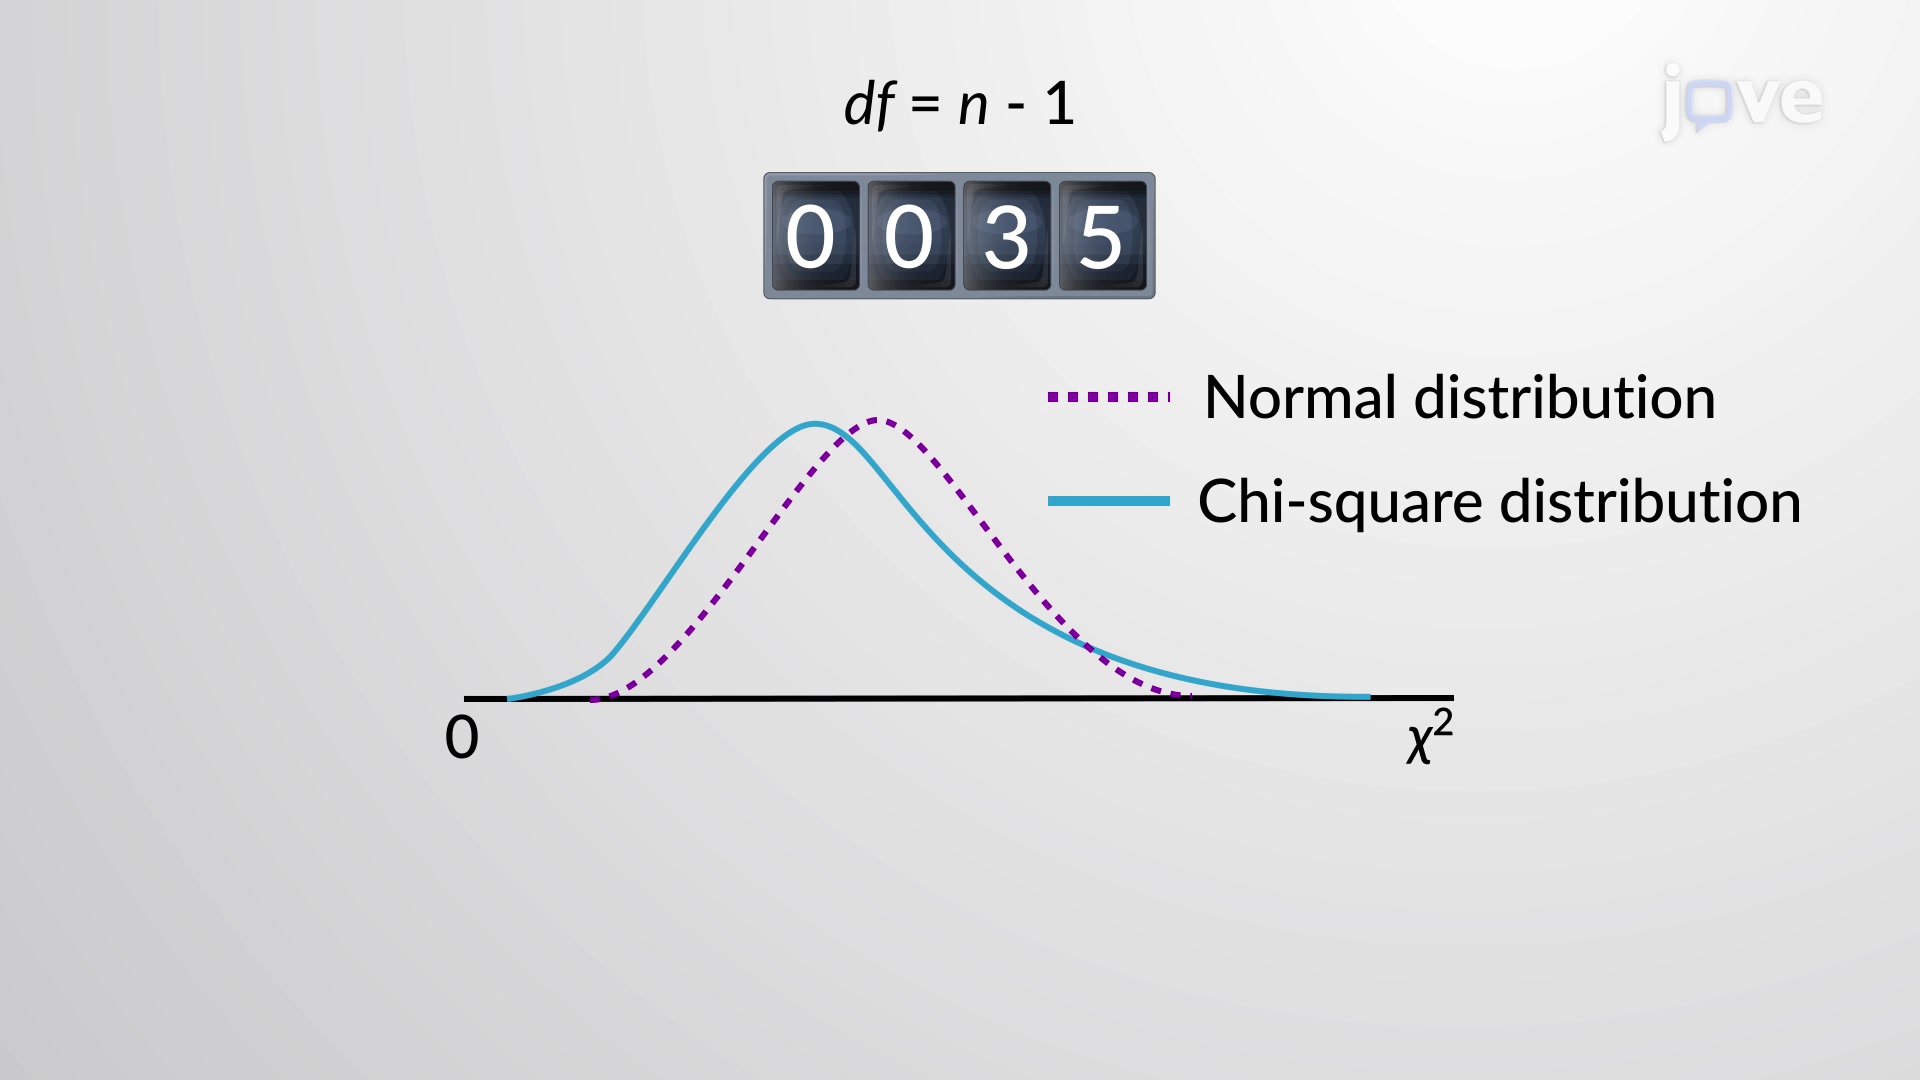
The degree of freedom for a particular statistical calculation is the number of values that are free to vary. Thus, the minimum number of independent …
check_url/science-education-library/80657/distributions/
The population standard deviation is rarely known in many day-to-day examples of statistics. When the sample sizes are large, it is easy to estimate the …
check_url/science-education-library/80657/distributions/
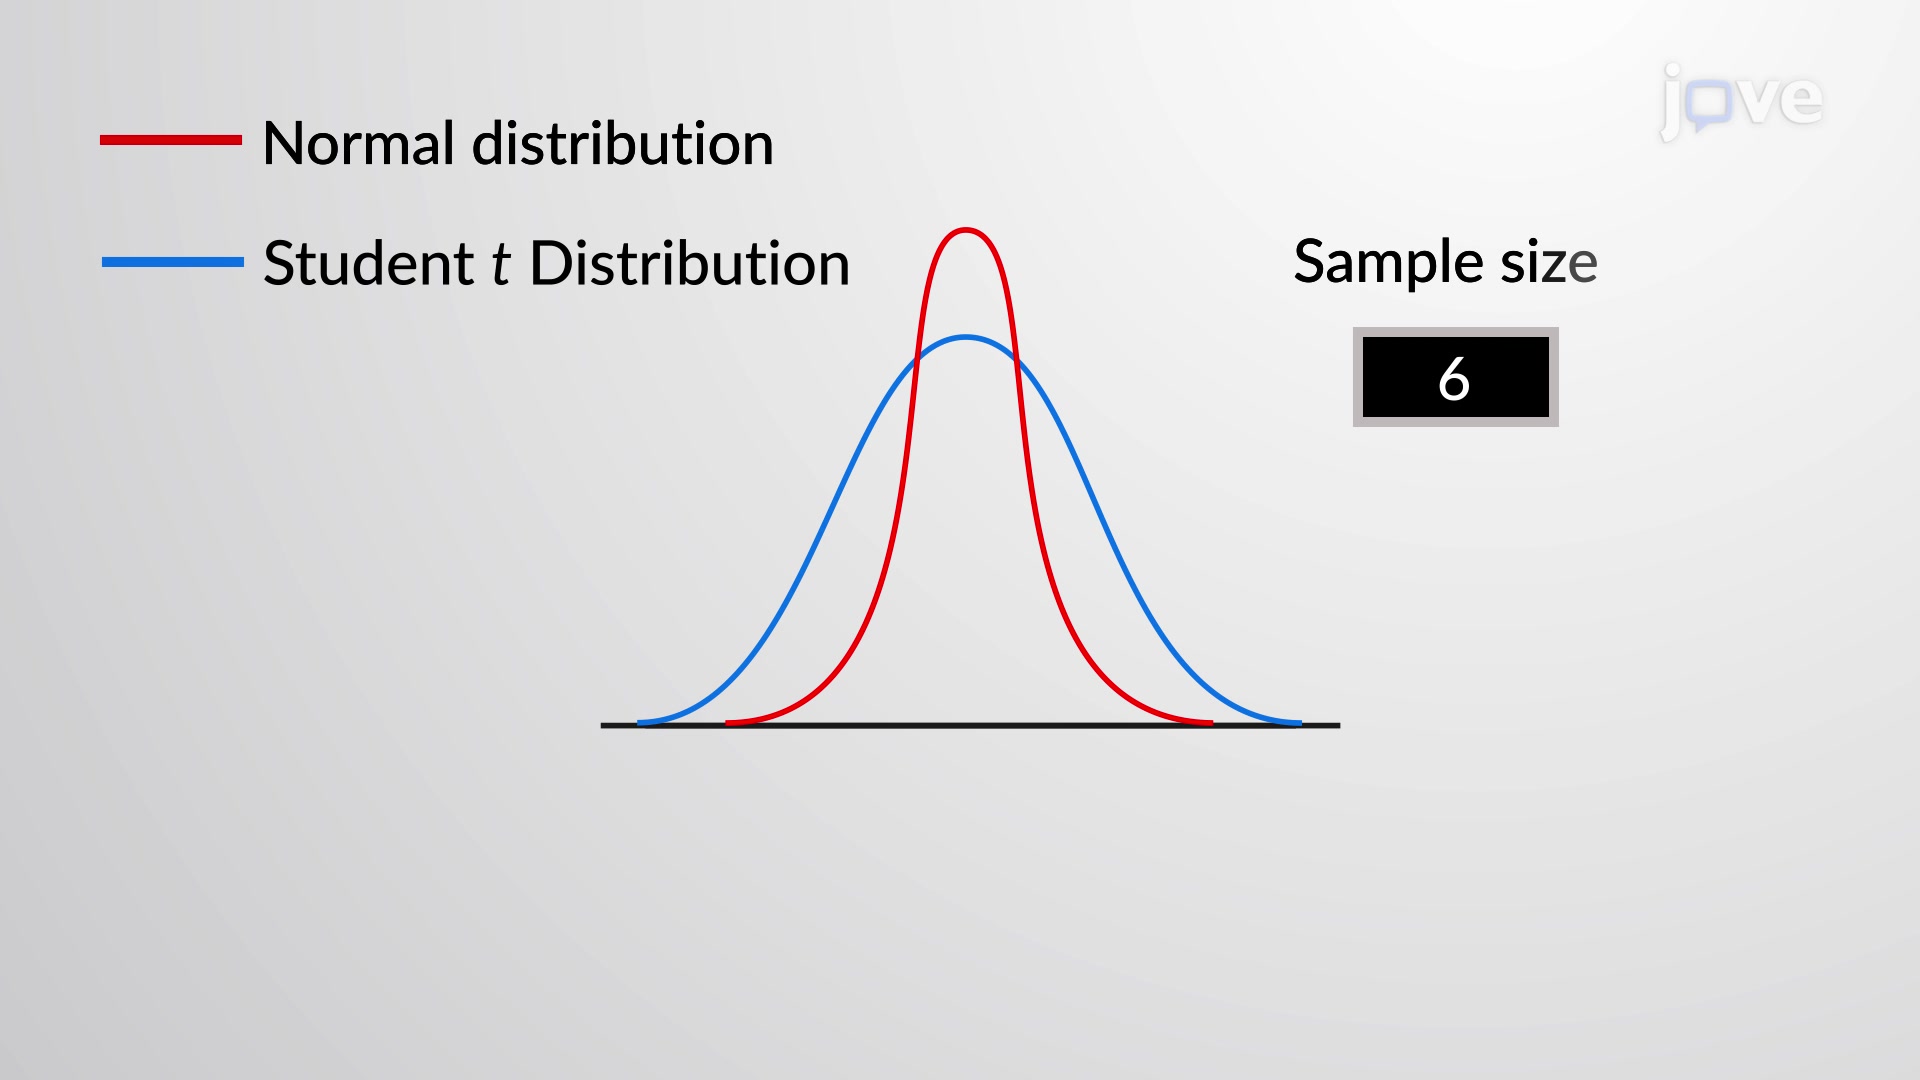
The z and the Student t distribution estimate the population mean using the sample mean and standard deviation. However, to decide which distribution to …
check_url/science-education-library/80657/distributions/
How does one determine if bingo numbers are evenly distributed or if some numbers occurred with a greater frequency? Or if the types of movies people …
check_url/science-education-library/80657/distributions/
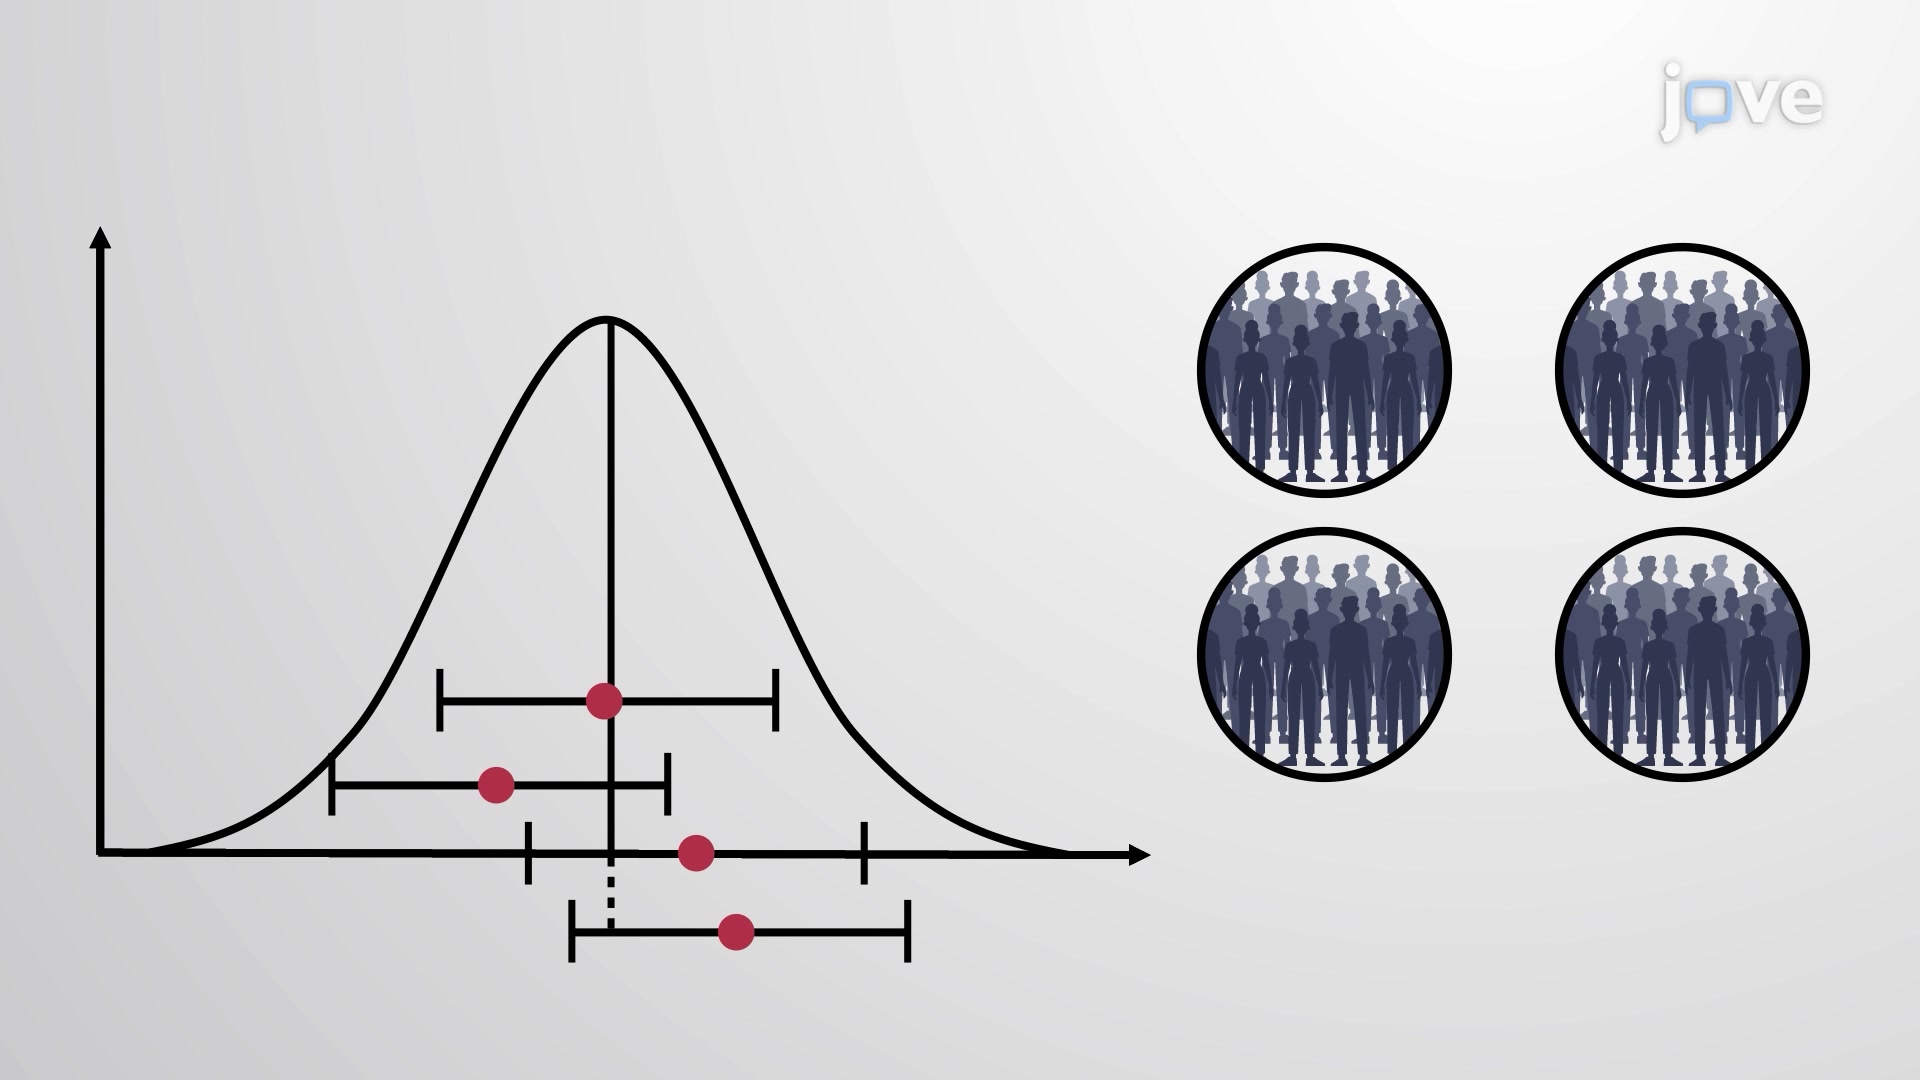
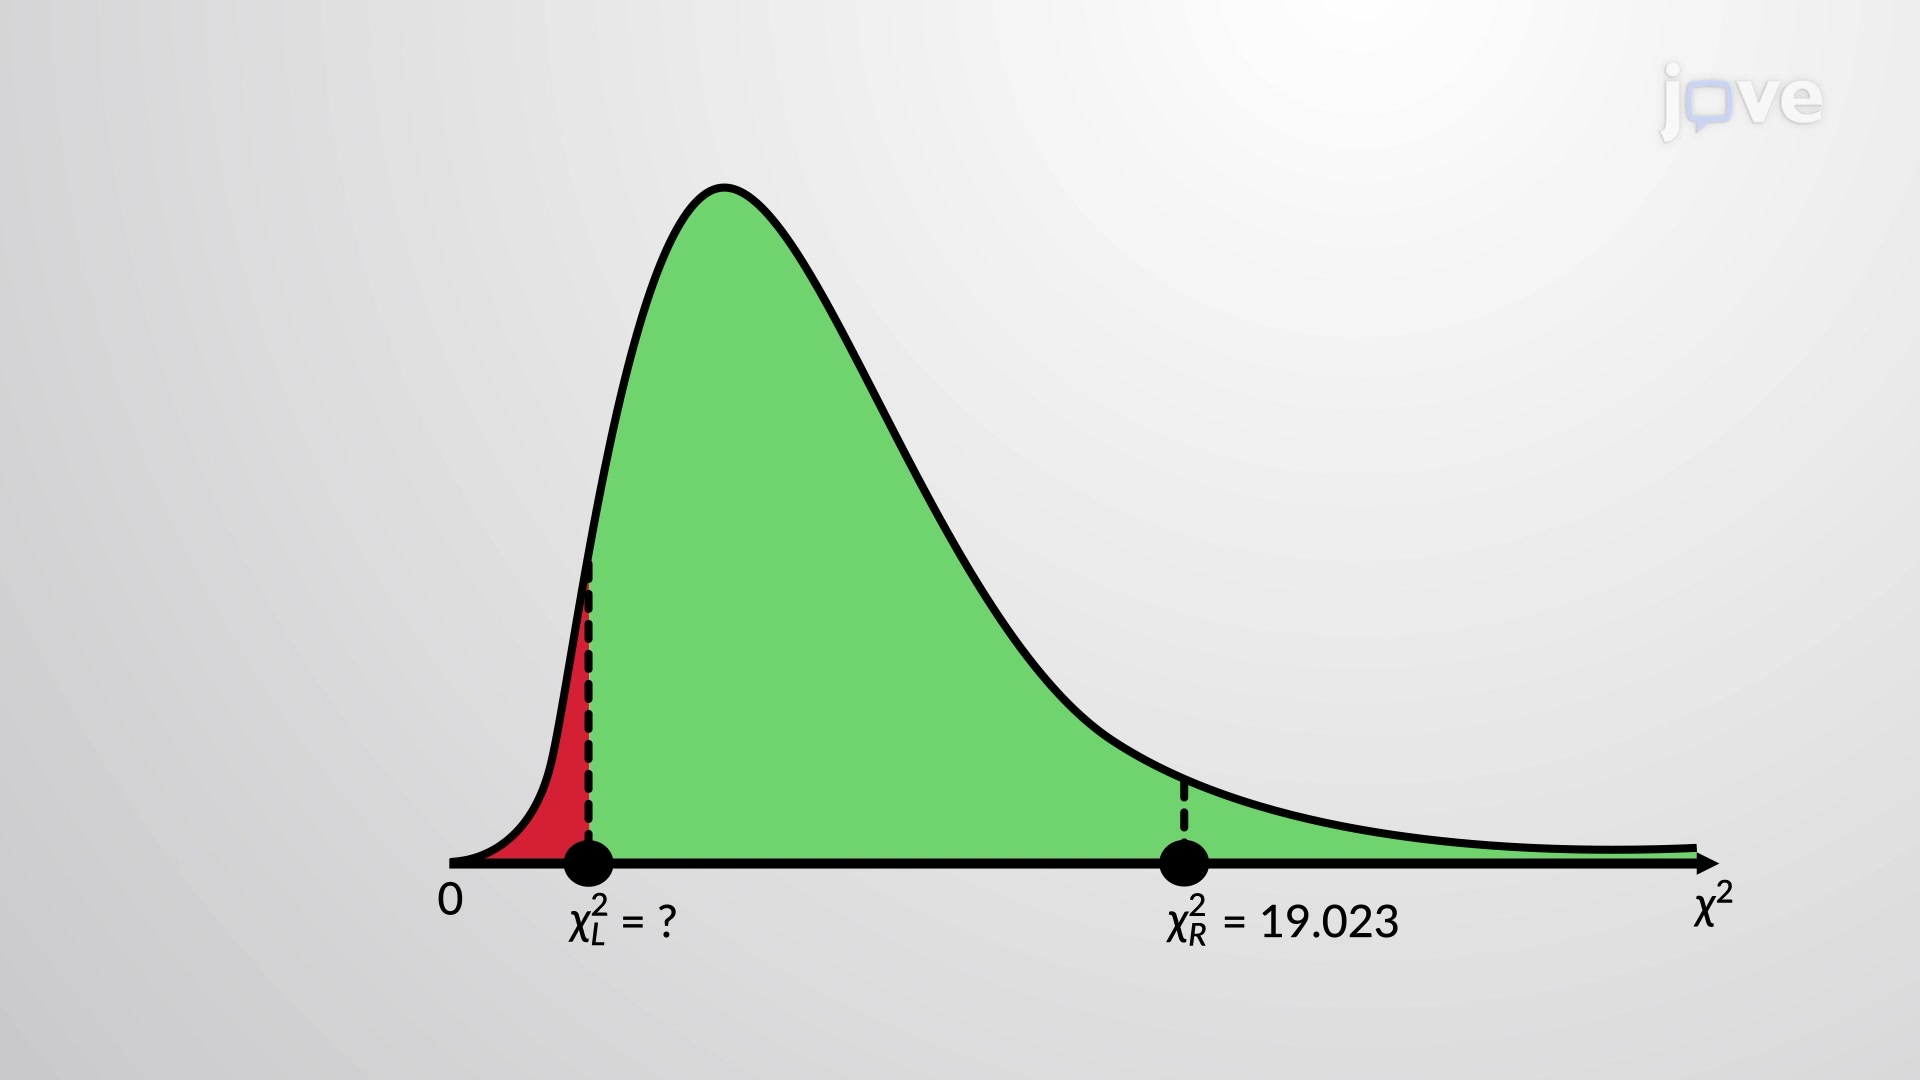
Consider a curve representing sample data drawn randomly from a normally distributed population. One must construct confidence intervals to estimate or to …
check_url/science-education-library/80657/distributions/
When the population standard deviation is unknown and the sample size is large, the sample standard deviation s is commonly used as a point estimate of …
check_url/science-education-library/80657/distributions/
The goodness-of-fit test is a type of hypothesis test which determines whether the data "fits" a particular distribution. For example, one may …
check_url/science-education-library/80657/distributions/
A goodness-of-fit test is conducted to determine whether the observed frequency values are statistically similar to the frequencies expected for the …
check_url/science-education-library/80657/distributions/
A contingency table provides a way of portraying data that can facilitate calculating probabilities. It is a method of displaying a frequency distribution …
check_url/science-education-library/80657/distributions/
In statistics, the term independence means that one can directly obtain the probability of any event involving both variables by multiplying their …
check_url/science-education-library/80657/distributions/
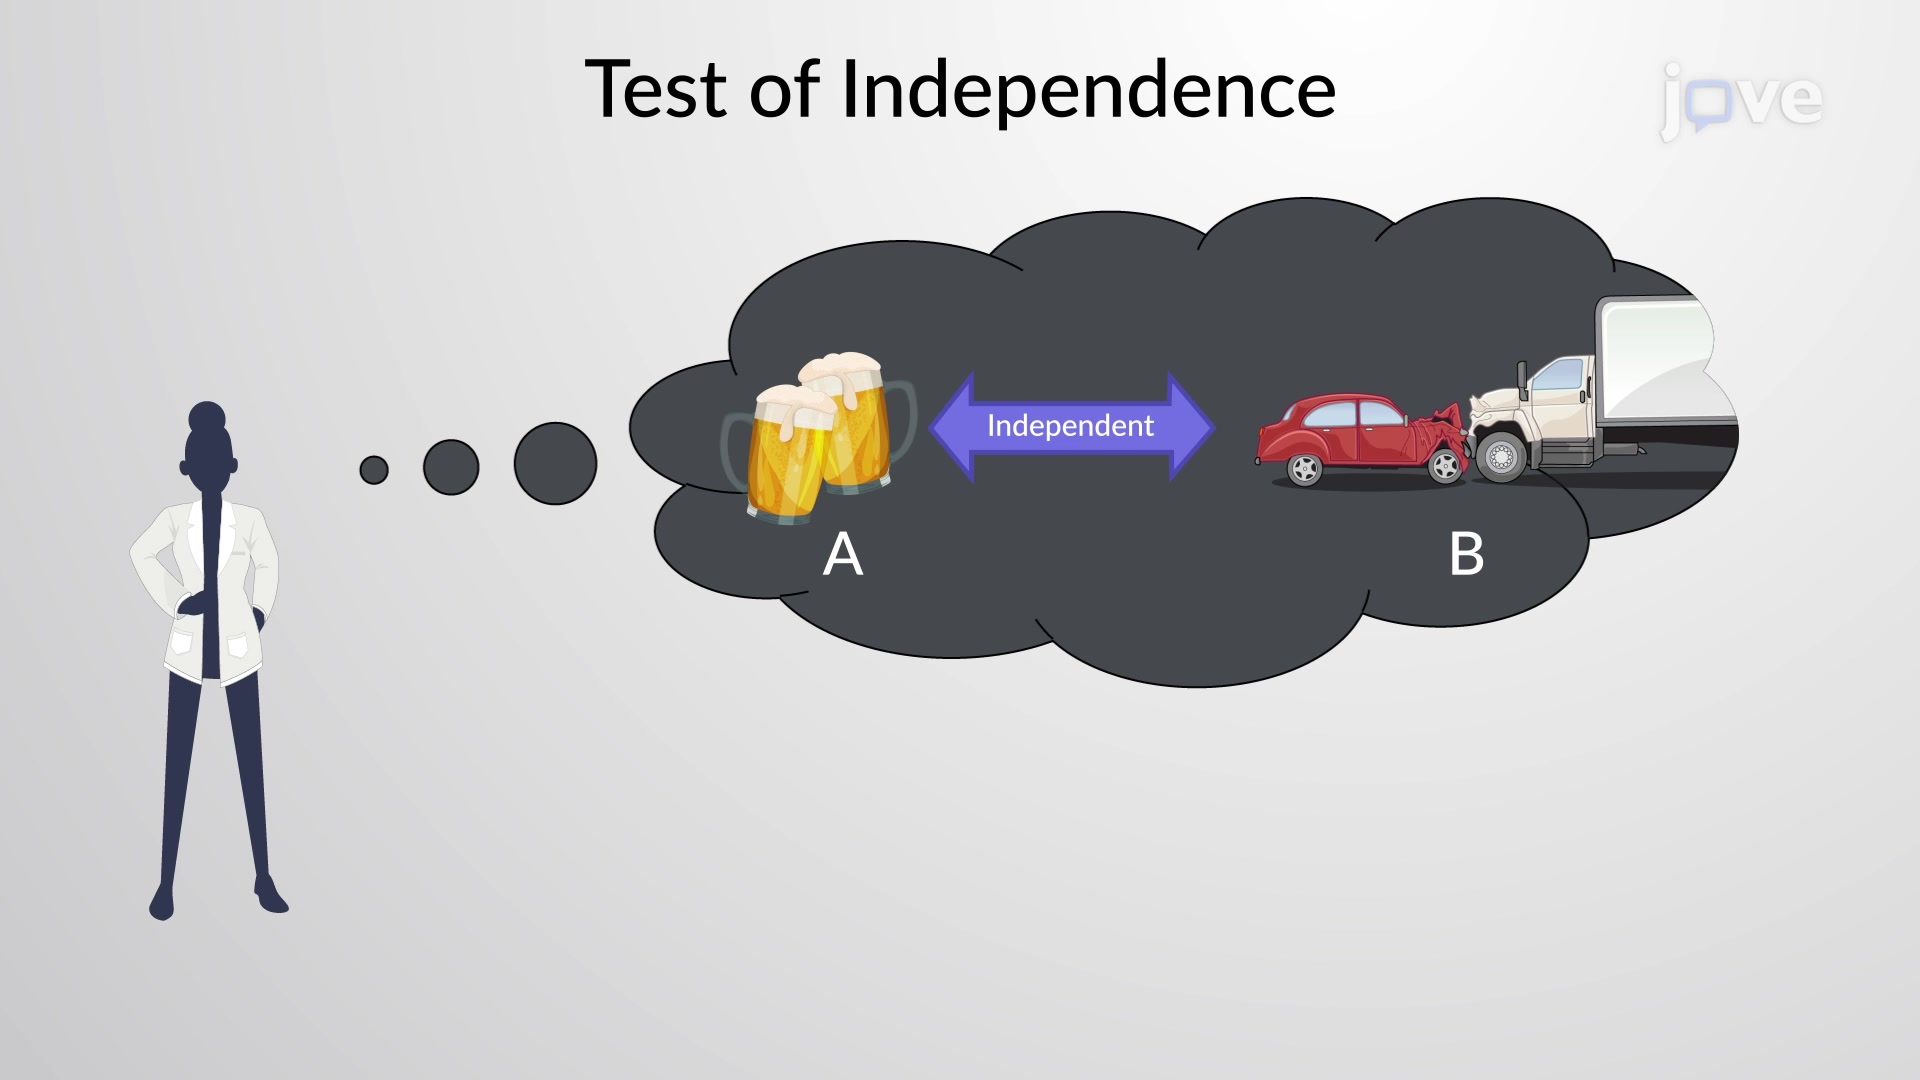
The test of independence is a chi-square-based test used to determine whether two variables or factors are independent or dependent. This hypothesis test …
check_url/science-education-library/80657/distributions/
Suppose one wants to test independence between the two variables of a contingency table. The values in the table constitute the observed frequencies of …
check_url/science-education-library/80657/distributions/
The goodness–of–fit test can be used to decide whether a population fits a given distribution, but it will not suffice to decide whether two …
check_url/science-education-library/80657/distributions/
The F distribution was named after Sir Ronald Fisher, an English statistician. The F statistic is a ratio (a fraction) with two sets of degrees of …
check_url/science-education-library/80657/distributions/
Perturbed mitochondrial metabolism has received renewed interest as playing a causative role in a range of diseases. Probing alterations to metabolic …
check_url/science-education-library/80657/distributions/
Anesthesia arguably provides one of the only systematic ways to study the neural correlates of global consciousness/unconsciousness. However to date most …
check_url/science-education-library/80657/distributions/
Limited evidence exists to precisely estimate efficacy and safety differences between parenteral nutrition (PN) prepared using olive-oil-based …