由于地表水的动作在流,河流或潮间带它创建头梯度驱动的水流入和流出的沉积物1。在河流系统的河床沉积物,其中该交换发生的部分是被称为潜流带2,3。这个区域是非常重要的,因为许多营养物质和污染物的存储,存放,或潜流带4-9范围内改变。的时间示踪剂花费在沉积物的量被称为停留时间。既停留时间和流动通道的位置会影响转化过程。影响流过泥沙的过程中认识的提高是需要预测溶质运移的河流和解决从材料的传播导致,如营养物质(例如沿海缺氧10,11)大环境的问题。尽管潜流交换的重要性,它往往不是在本科课程水文描述,流体力学,水力学等教育工作者希望增加潜流交换他们的课程可能会发现它有用有实验和数值模拟可视化,明确表明了这一过程。
河道弯度,周围的地下水水位和河床地形(如酒吧,河床和生物丘)都会影响潜流交换不同程度12-17。这项研究的重点河床,如沙丘和波纹,这通常是影响潜流流14,15键地貌特征。我们创建了一个数值模拟和实验室实验过有规律的一系列底形的可视化流程。此模拟基于以前的研究有关潜流流路,以容易观察到的系统特性15,18-21的本体。作为这项研究形成了科学背景的模拟,理论的主要方面简要总结如下。底形地形,T(X),计算公式如下:
方程1: 
其中 H是两倍底形的幅度,k是波数,和x是平行于平均河床表面的纵向尺寸。本底形地形的一个例子示于图1。

图1.参数定义和设置由用户控制在 接口 ,示踪粒子被释放在水/沉积物界面焊剂加权方式,并通过沉淀跟踪。如果节目径?“上”水示踪标记,他们一直在,展示自己的路径。当示踪剂返回到地表水,这改变吨他系统中的示踪剂的总数, 再下降时?设置为 “关”。的累积停留时间分布曲线示出这种变化通过绘制残留在沉积物床的初始数量作为时间的函数的示踪剂的数量的比率。如果再滴?是“上”,那么示踪剂让系统被替换在同一个流量加权的方式原厂颗粒,累积情节被禁用。 请点击此处查看该图的放大版本。
| 参数名称 | 单位 | 定义 | 接口 | Mousedrop | ||
| 拉姆达(λ) | 厘米 | 底形的波长(见图1)</ TD> |  | | ||
| BedformHeight(H)的 | 厘米 | 在两次底形幅度(见图1) | | | ||
| BedDepth(D) | 厘米 | 沉积物的深度(参见图1) | | | ||
| HydrCond(K) | 厘米/秒 | 导水率 | | | ||
| 孔隙度(θ)的 | 孔隙度 | | | |||
| ChannelVelocity(U) | 厘米/秒 | 平均速度在地表水或通道 | | | ||
| 深度(d) | 厘米 | 水深度(见图1) | | | ||
| 斜率(S) | 在河床和水面坡度 | | <tD> ||||
| NumParticles | 释放到系统的粒子数。 | | ||||
| TIMEX(时间1,时间2 ..) | 分 | 在每个颜色发生变化的时间 | | |||
| 模拟按钮 | 定义 | 接口 | Mousedrop | |||
| 建立 | 设定的最高使用参数显示的模拟 | | | |||
| 去/停止 | 启动和停止模拟 | | | |||
| 步骤 | 单击步骤会使一次性地通过。这使得用户可以减缓代码,看看在100秒的情况完全相同。 | | ||||
| 清晰的路径 | 清除所有从屏幕上,他的蓝色粒子的路径 | | | |||
| 前进到下一次 | 这将导致程序运行,直到下一个颜色变化时(TIMEX) | | ||||
| 鼠标拖放 | 这个按钮必须被点击之前的颗粒可以通过点击在地下位置被放置在地下。 | | ||||
| 秀径? | 如果显示,路径?处于“打开”的水粒子离开的蓝色表示在他们已经一条路径(参见图1)。 | | | |||
| 重新降? | 如果再下降?处于“打开”的颗粒被替换的助熔剂加权方式为每一个颗粒,它退出系统,累积积不起作用。当汉邦第一百退出潜流带如果再滴颗粒在系统中的数量减少?为“关”(见图1)。 | | ||||
表1.潜流参数和模拟控制。每个参数,按钮,滑块,可以由用户进行调整,给出在此表以及一个定义。
在该模拟中,两个过程诱导流体速度在沙床上。首先是因为与底形流流的相互作用。的速度头在诱导底形的水/沉积物接口也是近似正弦波,并通过从底形本身22的四分之一波长偏移。的速度头功能在表面地下界面上的幅度已近似从测量值作为16:
<p class="jove_content" fo:keep-together.within-pa GE =“总是”> 方程2: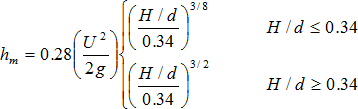
其中 U是平均表面水流速度,g为重力常数,d是水(图1中示出)的深度。的速度头函数由下式给出:
公式3: 
该磁头函数然后可以用于通过求解拉普拉斯方程以恒定砂床深度20来计算的地下速度函数的底形为基础的部分。的孔隙水速度的第二组分是由系统,S,其对应于重力梯度头的斜率确定,收率 流在下游方向成正比S / ftp_upload / 53285 / 53285eq_S_inline.jpg“/>的最终功能孔隙水的速度是:
公式4: 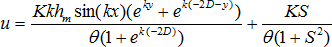
公式5: 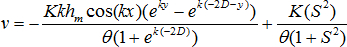
其中 ,u表示所述纵向速度分量,v是垂直速度分量,K为沉积物的平均水力传导率,是沉积物的平均孔隙率,y是垂直坐标,D是沉积物的深度。
粒子跟踪模拟创建,它使用的NetLogo建模语言和仿真平台23。这两种实现方式(Mousedrop.nlogo和Interface.nlogo)利用这些方程模型HYPorheic流着相同的模拟核心。主要的区别是示踪粒子的初始位置。Mousedrop允许用户放置地下内的任何地方模拟示踪剂。地下速度等式4和5是用来移动示踪以模拟染料注射实验。在接口方面,示踪总是沿着表面/地下边界放在通量加权方式。这模仿递送溶解和悬浮材料从表面的水进入孔隙水,这是理解潜流交换。示踪剂然后地下内移动,直到它重新到达流水。跟踪在水槽染料路径和模拟使用的NetLogo路径产生的流场的流线,只要在观察期间的流动条件和底形形态保持稳定。Interface.nlogo创建累积停留时间分布,其示出了的数量的比值示踪粒子残留在沉积物放置在时间0作为时间的函数示踪粒子的初始数量。
由于在最近的文献调查24所讨论的,仍然大约动手实验室实验与模拟实验室和计算机模型的相对优点中的教育研究界相当大的争议。在一方面,有些人认为“实践经验是学习的心脏”25,并警告说,节省成本的论点可能会助长更换动手基于计算机的模拟实验活动的,对损害学生的理解26。而另一方面,一些研究人员在科学/工程教育认为,模拟是至少一样有效,传统的动手实验室27,或在培养学生为中心的“发现式学习”28讨论计算机模拟的好处。尽管共识并没有被重新疼痛难忍,许多研究人员得出结论认为,理想状态下,计算机模拟应补充,而不是取代,动手实验室实验29,30。也有一些在科学和工程教育的举措,同时耦合物理实验和真实世界的感知与现象的计算机模拟; 例如 ,见“双焦建模”31。
学生可以有更深刻的概念性知识并通过与两个物理系统,以及基于计算机的仿真该系统的相互作用的更好的理解科研过程。此过程涉及具有学生进行溶质运输实验演示引力和底形诱导的潜流交换流动,匹配其自己的实验装置和结果用计算机模拟的相同的现象。这比较有利于学生的重要学习成果,和T的深入讨论他科学的方法和模型/理论建设,并通过数据收集实证验证之间的相互作用。执行此对比后,学生还可以利用基于计算机模拟的好处,通过改变模型参数快速探索多种替代方案。
