We introduce the CorExplorer web portal, an resource for exploration of tumor RNA sequencing factors found by the machine learning algorithm CorEx (Correlation Explanation), and show how factors can be analyzed relative to survival, database annotations, protein-protein interactions, and one another to gain insight into tumor biology and therapeutic interventions.
Method Article
Analyzing Tumor Gene Expression Factors with the CorExplorer Web Portal
In This Article
Summary
Abstract
Differential gene expression analysis is an important technique for understanding disease states. The machine learning algorithm CorEx has shown utility in analyzing differential expression of groups of genes in tumor RNA-seq in a way that may be helpful for advancing precision oncology. However, CorEx produces many factors that can be challenging to analyze and connect to existing understanding. To facilitate such connections, we have built a website, CorExplorer, that allows users to interactively explore the data and answer common questions related to its analysis. We trained CorEx on RNA-seq gene expression data for four tumor types: ovarian, lung, melanoma, and colorectal. We then incorporated corresponding survival, protein-protein interactions, Gene Ontology (GO) and Kyoto Encyclopedia of Genes and Genomes (KEGG) pathway enrichments, and heatmaps into the website for association with the factor graph visualization. Here we employ example protocols to illustrate use of the database for comprehending the significance of the learned tumor factors in the context of this external data.
Introduction
Since its introduction just over a decade ago, RNA-seq has become a ubiquitous tool for measuring gene expression1. This is because it enables rapid and cheap de novo profiling of the entire transcriptome of a sample. However, RNA-seq tumor data reflects an underlying biology that is intrinsically complex and often under-sampled, while the data itself is high-dimensional and noisy. This presents a significant challenge for extracting reliable signals. The CorEx algorithm leverages multivariate mutual information to find subtle patterns in such situations2,3 . This technique was previously adapted to analyze ovarian tumor RNA-seq samples from the The Cancer Genome Atlas (TCGA) and in this context it appeared to have significant advantages over more commonly used analysis methods4.
Though the use of RNA-seq is enormously widespread in research applications, including in oncology, those efforts have not led to broad utilization for the purposes of clinical interventions5. Part of the reason for this is a lack of user-friendly algorithms and software targeted to these specific problems. To help bridge this gap, we have designed the CorExplorer web portal to enable researchers from a variety of backgrounds to study gene expression factors of tumor RNA-seq samples as found by the CorEx machine learning algorithm. The CorExplorer portal supports interactive visualization and querying of factors from several different tumor types including lung, colon, melanoma, and ovarian6,7,8,9,10, with the intent of helping researchers to sift through the data correlations and identify candidate pathways to stratify patients for therapeutic purposes.
We expect the CorExplorer portal may be useful to several types of users. The portal was designed with the user in mind who wishes to understand the broad factors driving tumoral gene expression differences in public databases and possibly also place individual gene expression profiles in the context of tumors with similar characteristics. In addition to the representative protocols outlined here, CorExplorer investigations may serve as a starting point to suggest hypotheses for further testing, to compare and contrast CorEx findings on datasets outside of the CorExplorer, and to connect pathological expression signatures of one or a few genes in an individual tumor to larger groups that may be coordinately affected. Finally, it may serve as a user-friendly introduction to the application of machine learning to RNA-seq for those getting started in the field.
Protocol
1. Exploring factors containing a gene of interest
- Open a web browser and go to http://corex.isi.edu, the CorExplorer home page.
- On the right side under Quick Links, click on the + expand button next to Ovarian (TCGA-OV) to see a summary of the CorEx factor graph that was trained on the TCGA ovarian cancer data (shown in Figure 1). Optionally, click on others to compare.
- Once finished inspecting the factor graphs, click on Lung (TCGA-LUAD) to access the CorExplorer page for lung cancer RNA-seq.
- Explore the CorEx factor graph for a gene of interest using the CorExplorer ‘Factor Graph’ window.
- Move the mouse cursor over the factor graph display window. Zoom into the factor graph using the mouse scroll wheel or trackpad to see details of the graph such as the most important genes in each factor and the connections between nodes at different layers. Alternatively, click and drag to move the view area or any node.
- To find a target gene (here we'll use BRCA1), click on the Gene dropdown menu at the top of the factor graph window. Type ‘BRCA1’ to select it in the dropdown list and press Return to make the view zoom to factor 26, the factor with which BRCA1 is most strongly correlated.
- Reposition the mouse over the graph display and scroll to zoom out to see the Level 2 node, L2_8, and its associated factors that are neighbors to factor 26. Note that only genes with weight greater than the threshold indicated on the Min link weight slider are shown.
- To see all of the genes associated with the factor, click on the L1_26 node and select Load additional genes in the pop-up window. When the word ‘Done’ appears, close the pop-up window.
- Now go back to the header section above the factor graph window and grab and drag the Min link weight modifier. Now, as the link weight slider is moved down to 0.05, other genes in factor L1_26, including BRCA2, will appear in weight order. Optionally, reposition nodes by grabbing and dragging to improve layout.
- Determine how stratification of patients with respect to the factor affects survival by querying in the survival window.
- In the survival window, uncheck Sort by p-val, then select factor 26 in the Single Factor dropdown menu in order to show survival curves for factor 26.
- Scroll down the survival graph to show the number of patients at risk along the x-axis.
- Find associations with biological function by querying within the Annotation window.
- In the annotation window, to sort the Factor dropdown menu by factor number rather than False Discovery Rate (FDR), uncheck FDR sort.
- Scroll and click to select factor 26 in the annotation window dropdown to show enrichment annotations for the factor.
- Scroll down the annotation list until DNA repair is visible and click on it to immediately see associated genes highlighted in yellow on the graph display. See the middle panel of Figure 2.
- Note that factors disappear or appear as different GO terms are selected, according to whether or not they are enriched for genes with the selected annotation, e.g. ‘intrinsic apoptotic signaling pathway in response to DNA damage.’
- Explore the factors further by adding windows with different functionality.
- From the top menu bar, add a protein-protein interaction network (PPI) window by selecting PPI from the Add Window dropdown, then click the Add button to add a PPI graph window to the display area. In the PPI graph window, choose factor ‘Layer1: 26’ to show the protein-protein interactions. Note the density of connections.
- From top menu bar, instead of PPI, select Heatmap from the Add Window dropdown, then click the Add button to add a heatmap window to the display area. In the heatmap window, choose factor ‘Layer1: 26’ to show the gene expression patterns.
- Grab and reposition the heatmap window so that the survival window is also visible. Along the top of the heatmap, observe how the orange/blue/grey colored bar corresponds to patient risk strata on survival graph. Results are shown in the bottom of Figure 2.
- Explore the CorEx factor graph for a gene of interest using the CorExplorer ‘Factor Graph’ window.
2. Filtering and interpreting CorEx factors using gene weight, survival, and annotation data
- Filter for factors of interest using survival and cluster quality.
- From the Dataset dropdown menu at the top, select TCGA_OVCA to go to the CorExplorer page for the TCGA ovarian cancer RNA-seq.
- Once the page has loaded, note from the survival window that the factor with the largest survival differential for different strata is 114.
- At the top of the factor graph window select ‘Layer1: 114’ from the Factor dropdown.
- Grab the link weight slider with the mouse and move it up to 0.5. Note that the large number of genes in factor 114 (1609), with none having weight >0.35, indicates a relatively weak clustering.
- Next, expand the list of factors in the survival window and select the next best factor in the survival window dropdown, factor 39, to show its associated survival curves.
- Select factor 39 in the annotation window by clicking on it. The significant GO and KEGG annotations are shown.
- To gain a better understanding of the biological role of genes in factor 39, interpret the factors using neighborhood annotation information as follows.
- At the top of the factor graph window, select factor ‘Layer1: 39’ in the factor dropdown. Then, move the mouse over the factor graph window and zoom out to reveal the entire L2_14 cluster with 6 factors: 14, 32, 39, 42, 52, and 82 (shown in Figure 3).
- To understand the relative significance of the factors linked to the L2_14 node, start by viewing survival differentials for each of the L2_14 factors. Uncheck Sort by p-val in the survival window and then click on each of the factor numbers in succession. Doing this, note that only factors 14, 32, and 39 display a survival association.
- Now from the top menu bar, select PPI from the Add Window dropdown once again. Press Add to add a PPI graph window to the display area. In the PPI graph window, select factor ‘Layer1: 52’ to show the protein-protein interactions that are significant. An example layout of windows at this point is shown in Figure 3.
- Click the View at StringDB link at the bottom of the PPI window to link out to the StringDB online database. Click Continue from the first screen, then select the Analysis tab below the network graph as before to get an online GO analysis for the PPI network genes. The top cellular component is ‘MHC class II protein complex.’
- Return to the CorExplorer tab and PPI window and select factor 32, this time from the factor dropdown. Click the link View at StringDB out to the StringDB analysis. The top cellular component is ‘MHC class I protein complex,’ in contrast to class II for factor 52 in the previous step!
- Finally, go back to the PPI window and select ‘Layer1: 39’ from the factor dropdown menu at the top. Click the link View at StringDB to link out to the StringDB analysis.
- Click Continue from the first screen, then select the Analysis tab below the network graph to get an online GO analysis for the PPI network genes. Observe that the top molecular function is ‘CXCR3 chemokine receptor binding.’
3. Using survival and database annotations to look for promising therapeutic combinations
- Switch to the TCGA melanoma CorExplorer by selecting TCGA_SKCM from the Dataset dropdown menu.
- Note that the factor with the largest survival differential is factor 171. Examine the factor 171 annotations by scrolling and note that ‘immune response’ and ‘cytokine-mediated signaling pathway’ are near the top (as they were for the top ovarian factor).
- To find a complementary factor, examine the top survival-associated factors along with their top annotation terms. To do this, click on the Dataset overview link in the top menu bar to open a separate tab containing a table with dataset processing details as well as a summary of top factors according to p-value of the survival differential. Note that the first non-immune factor is 88.
- Return to the TCGA_SKCM browser tab.
- Select factor 88 in the survival, annotation, and graph windows. The top several GO terms are related to ‘rRNA processing’ and ‘mitochondrion organization,’ confirming it as distinct from the immune-related factors.
- In the survival window, on the paired factors dropdown, select ‘88_171’ to see how survival is improved for patients in the middle stratum for the combined 171 and 88 expression factors. Annotation and survival comparisons are illustrated in Figure 4.
4. Finding commonalities and differences of gene expression variation across tumor types using the Search page
- Click on the CorExplorer heading to return to the front page.
- Click on Search on the top menu bar to go to a page allowing searching over all the datasets on the CorExplorer site.
- In the Gene search box, enter ‘FLT1’ (VEGFR1) and hit Return or press Search. FLT1 is found with a relatively high weight in the following factors: OVCA - 76, LUAD - 162, SKCM - 195 and SKCM - 184, as well as COAD - 112 and COAD - 74.
- Alternatively, search for a related GO term across all the datasets. Try this in the ‘GO Search’ box by typing ‘angiogenesis’ and hitting Return or pressing Search. All FLT1 factors, with the exception of SKCM-195, are listed as statistically enriched for ‘angiogenesis’ genes–factor 195 does, in fact, have the annotation, but below the default 10-8 threshold. Search results for this and the prior step are shown in Figure 5.
- As further examples, in the GO search box, first type ‘epidermal growth factor receptor.’ Only LUAD is enriched for this term, a well-known stratification factor for lung cancer. Next, type ‘mesenchymal’ in the search box. This term is enriched in gene expression groups for OVCA, where it is a well-studied stratification factor.
Results
Searching for the gene ‘BRCA1’ in the lung cancer dataset reveals it to be most strongly associated with CorEx factor 26 (Figure 2). GO term enrichment for this factor is seen to be extremely high, with DNA repair exhibiting an FDR of only 1 x 10-19. The selection also draws attention to the second level cluster L2_8 that has six closely related factors as children. Selecting ‘DNA repair’ in either the GO term annotations or the factor graph's GO enriched dropdown highlights associated genes in each of the factors, with the factor 26 having by far the most, as expected11. The protein-protein interaction network is strongly connected, further supporting the tightly linked functionality of the genes in factor 26. The associated survival graph suggests a possible association with patient survival, but this would have to be confirmed in a larger dataset.
Starting with survival can allow dissection of reasons for improved survival associated with particular gene expression groups. As an example, the top factor influencing survival for ovarian cancer is seen to be number 39, which is strongly enriched for genes associated with the immune system (Figure 3). Five other factors associated with the same level 2 node are also indicated to be immune-related, however the survival impact appears to be strongly variable among them, with 39 being the highest and 52 being the lowest. Adding a protein-protein interaction window for a factor shows the immediate interaction network and allows for link out to the StringDB12 website to query various enrichments for the PPI network genes. By doing this for each of the L2_14 factors in turn, one finds that StringDB enrichments for the PPI network genes suggest the following possible explanation for the associations with survival. Factor 32 contains genes that make up the major histocompatibility complex (MHC) class I protein complex, which is recognized by cytotoxic T lymphocytes. Factor 39 corresponds to cytokine signaling and CXCR3 receptor binding, related to CD8+ T lymphocytes. Both of these factors appear to confer a significant survival advantage for patients exhibiting relatively high expression of the corresponding genes. Cytotoxic CD8+ T lymphocytes are primarily responsible for anti-tumor immunity. Factor 52, on the other hand, is comprised of genes coding for proteins in the MHC class II complex which are recognized primarily by CD4+ T helper cells rather than directly by cytotoxic T lymphocytes. The remaining L2_14 factors reflect generalized immune system activation that doesn't differentiate the two types of lymphocyte populations. A survival association specific to cytotoxic T lymphocyte recognition of MCH class I cellular antigens is consistent with our understanding of antitumor immunity in general and from other cancers such as melanoma13,14.
The web portal supports the discovery of pairs of factors with complementary functions that may suggest effective tumor-specific combination therapies. The dataset overview can be scanned for factors that show a correlation with survival yet have distinct GO enrichments. For melanoma (TCGA_SKCM; Figure 4), it is seen that the top survival factor 171 is immune related, while factor 88 down the list shows enrichment for genes related to mitochondrion organization. Indeed, this has been suggested as a target in melanoma15. Adding survival windows to the CorExplorer page allows comparison of stratification using the factor pair to that of each factor individually, showing that favorable gene expression patterns from both groups exhibits a trend of survival better than that for either factor alone. The top stratum does not appear to be improved however, suggesting immunotherapy only may be the best option for some patients.
Commonalities and differences among tumors can be seen by searching across datasets for genes or GO terms (Figure 5). As an example, FLT1 (aka VEGFR1) is a well-studied pro-angiogenic marker16,17. When it is put into the search bar, all of the tumors have factors in which FLT1 plays a major role. Conversely, when the GO term ‘angiogenesis’ is input on the search page, 5 out of 6 of the FLT1 groups appear with that enrichment. All FLT1 factors, with the exception of SKCM-195, are listed as statistically enriched for ‘angiogenesis’ genes. The sixth factor does, in fact, have the annotation, but below the default 10-8 threshold. When the weighting within the factor list is utilized in an alternative enrichment calculator, e.g., Gene Set Enrichment Analysis (GSEA)18, the sixth factor is found to be significantly enriched for ‘angiogenesis’ genes as well.
It is important to check the heatmaps to ensure the gene expression pattern is of adequate quality to support biological interpretations. Heatmaps that show strong clear variation may exhibit either coordinated expression of the factor genes ranging from low to high or more complex patterns with some genes having low expression correlated with others having high (Figure 6). A key marker of a high-quality grouping is the presence of several genes with a smooth variation in expression as a function of factor score. The factor heatmaps show samples ordered according to factor score, thus there should be a smooth gradient moving from left to right. However, this can fail to happen in at least two different ways. Most commonly, the correlations may be extremely noisy (Figure 5C), calling into question the robustness and utility of any inferences regarding survival and/or biological function. Also, patterns that happen only in a small minority of samples may not conform to the model of three expression states assumed by the CorEx algorithm, resulting in a misleading classification of the samples (right side of Figure 5D).
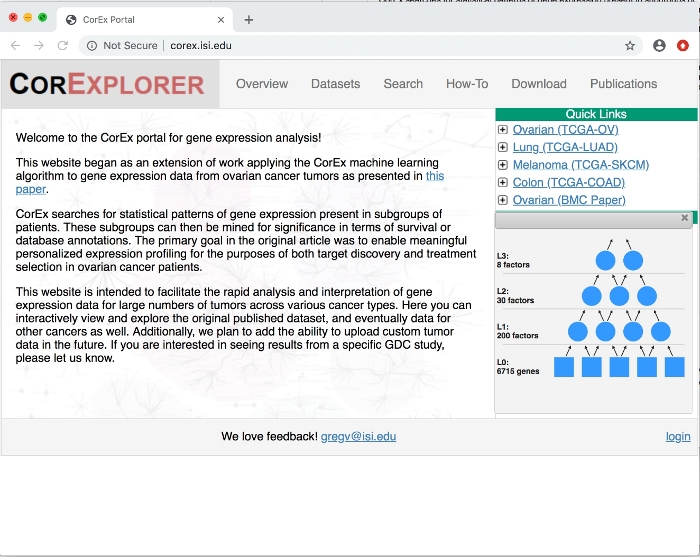
Figure 1: CorExplorer front page. After clicking on + next to Ovarian Cancer under Quick Links, factor graph details are shown. The CorEx hierarchical model is made up of input variables (gene expression in this case) on the bottom layer and inferred latent factors in the higher layers. Please click here to view a larger version of this figure.
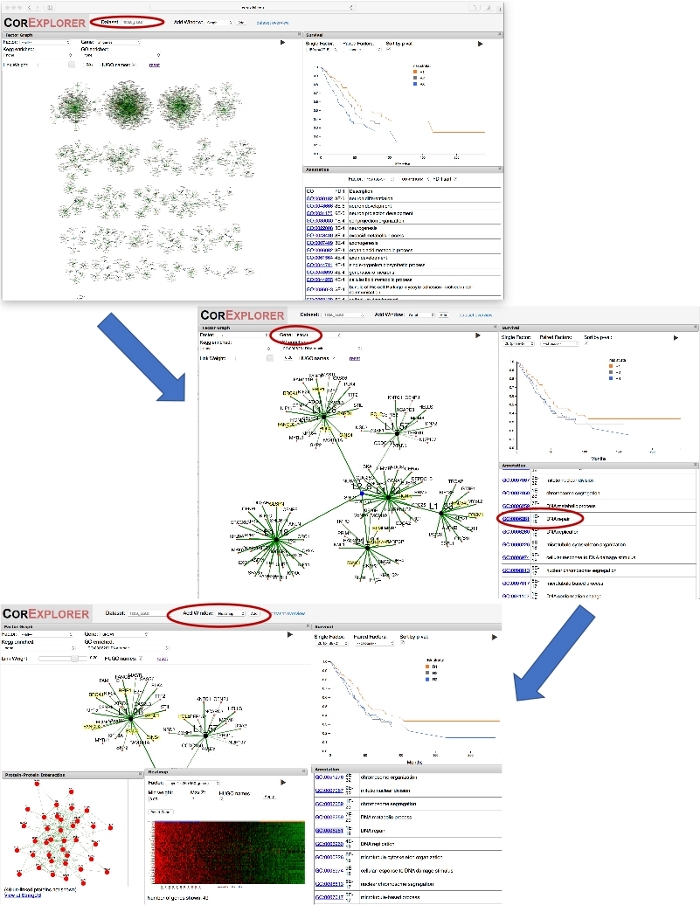
Figure 2: Using a gene name to guide exploration. The figure shows a series of screenshots illustrating exploration of CorEx lung cancer factors strongly related to BRCA1. First, selecting ‘BRCA1’ in the Gene dropdown box for the factor graph causes the graph view to zoom in on the factor for which BRCA1 has greatest weight. Zooming out a bit frames the layer two node L2_8 connecting that factor to other related ones. Survival and annotations can be compared: clicking on the GO term DNA repair highlights annotated genes. A PPI window is added to show the network interactions for genes in the factor. Using the Add Window button to add a heat map shows association of expression patterns with survival, suggesting increased expression of DNA repair genes may be associated with decreased survival. Please click here to view a larger version of this figure.
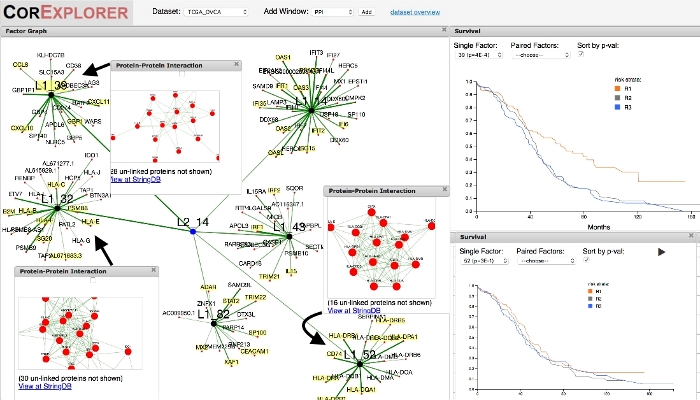
Figure 3: Using clinical data (survival) to guide exploration. Exploring the top survival-associated factor (39) for ovarian cancer reveals interesting relationships among neighboring factors. After selecting factor 39 in the factor graph and zooming out a bit, the layer two factor linked to factor 39 is seen to have five other associated factors. An additional survival window allows direct comparison of the associated survival differentials. Factors 39 and 32 both show a positive survival correlation, in contrast to factor 52, which does not. The protein-protein interaction networks are all well-defined. Linking out to StringDB allows comparison of the GO annotations (not shown): Factor 39 is associated with a cytokine signaling network related to cytotoxic CD8+ T lymphocyte activation and factor 32 is dominated by MHC class I antigen presenting proteins that trigger recognition by such lymphocytes; the neighboring factors, however, are dominated by other immune system components such as CD4+ helper T cells and show no survival correlation. Please click here to view a larger version of this figure.
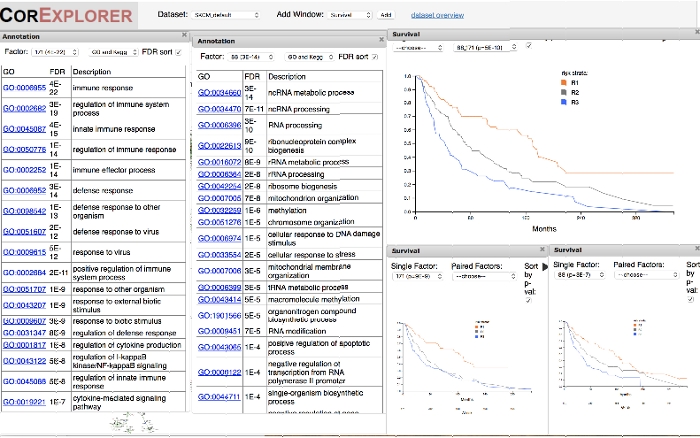
Figure 4: Exploring top survival factors suggests potential therapeutic combinations. The ‘Datasets’ link on the home page menu bar leads to a concise table of survival factors ordered by p-value, along with the top GO annotation (not shown). Using this information for melanoma, the combination of factor 171 for immune function with factor 88 for mitochondrion organization appears complementary. The figure shows annotation windows for each of the factors side-by-side to contrast them. Survival curves for patients stratified by the two factors individually or together indicate that the combination increases the survival differential compared to either factor alone. Please click here to view a larger version of this figure.
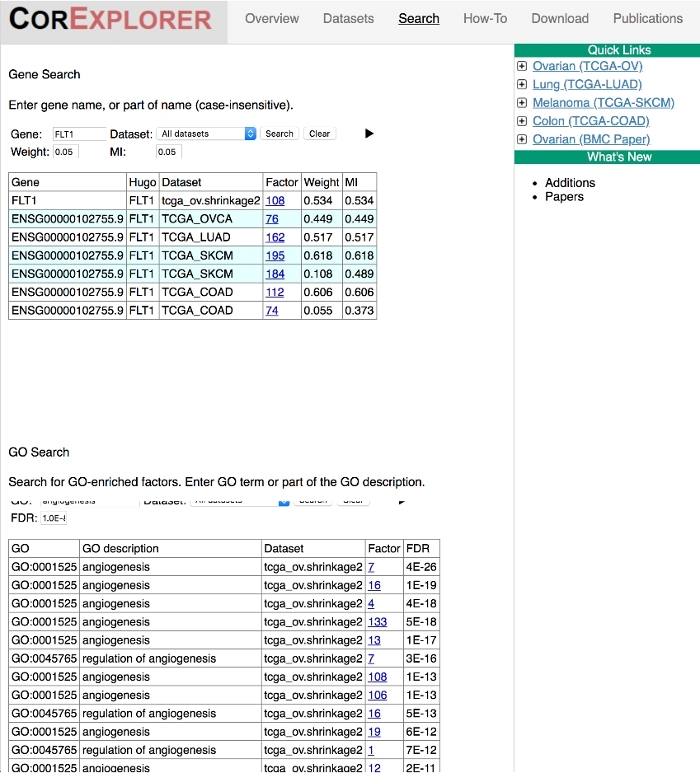
Figure 5: The Search page facilitates pan-cancer analysis. Genes or GO biological process terms can be searched for across all datasets using the Search link from the home page. The figure shows search results for the gene FLT1 and the GO term ‘angiogenesis’. The results show the presence of FLT1 in factors annotated with the term ‘angiogenesis’ across cancers. Please click here to view a larger version of this figure.
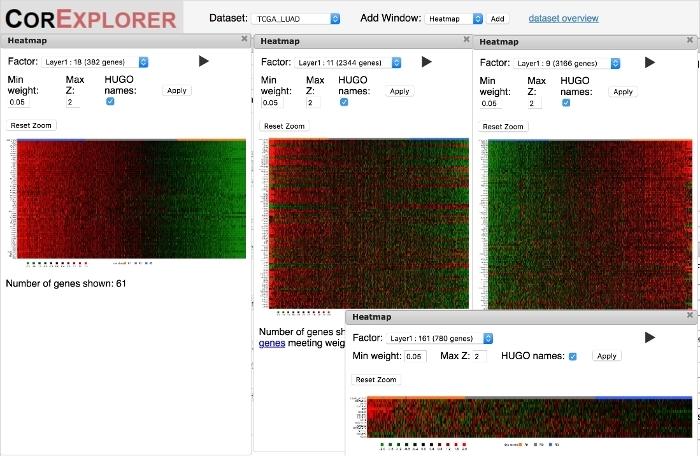
Figure 6: Heatmaps can be used to qualitatively assess correlations among genes and samples according to factor score. High quality gene expression relationships are shown by smooth gradation when patients are ordered by factor score in the heatmaps. The leftmost heatmap for factor 18 is one example. The patterns may also encompass complex signatures of up and down expression as in the middle large heatmap for factor 11. Lower quality patterns sometimes show abrupt changes in expression for a subgroup of patients as in the factor 9 heatmap on the right or simple very noisy correlations as in the factor 161 heatmap at the lower right. Please click here to view a larger version of this figure.
Discussion
We have presented the CorExplorer site, a publicly accessible web server for interactive exploration of maximally correlated gene expression factors learned from tumor RNA-seq by the CorEx algorithm. We have shown how the website may be used to stratify patients according to tumor gene expression, and how such stratification corresponds to biological function and survival.
Other webservers for RNA-seq analysis have been built. Differential and co-expression analysis for tumors can be examined and integrated with other data types in cbioPortal19,20. The servers GenePattern21, Mev22, and Morpheus23, incorporate established clustering techniques such as principal component analysis (PCA), kmeans, or self-organizing maps (SOMs). More innovative efforts include CamurWeb24, based upon an automated rule-generating classifier, and TACCO25, which implements random forest classifiers and lassos. The CorEx algorithm used here optimizes multivariate information in order to find a hierarchy of factors that explain patterns in data. The nonlinear and hierarchical factor learning appears to yield improved interpretability relative to the linear global factors found via PCA4. Additionally, the technique's fine-grained parsing of sample signals allows precise tumor comparisons vis-à-vis more commonly used broad subtypes. This combination of overlapping and hierarchical factor analysis distinguishes the CorExplorer from most other approaches and necessitates new tools for visualization and summarization.
A critical part of the CorExplorer factor analysis is the capability to explore not just several, but over 100 factors with informative gene patterns that are placed within an overlapping hierarchy. The CorExplorer facilitates the mining of these myriad factors for biological and clinical associations and allows for exceptionally detailed characterization of individual tumors. The unsupervised learning of such a large number of factors means that not all will be relevant to disease biology. In such a case, it is essential to either use annotations or known genes to pull out factors of interest or search for factors associated with clinical data such as survival. Thus, the CorExplorer allows users to implement this very important filtering step. The presence of factor gene patterns in a tumor may even suggest an approach to personalized oncology treatment. Further, the multiplicity of factor scores for each tumor that allows for discovery of potentially useful therapeutic combinations.
It is sometimes the case that no significant GO annotations appear for factors highly correlated with survival. While this may occur due to noisy or under sampled data, there are other possible causes such as a cluster size that is too small to register significant enrichment scores or the group being a ‘basket’ of single genes from diverse pathways without coherent biological association. Additionally, a category of annotation different from the KEGG and GO biological process, e.g. cellular compartment, may be appropriate. These can be accessed by linking out to StringDB as demonstrated in the protocol. The Gene Ontology enrichment analysis on the CorExplorer site currently does not account for the gene weighting in a factor, though this will likely be remedied in the near future. Note a gene list option is available under ‘Add Window’ that allows for download of the complete factor gene list for further analysis with external tools.
For the purposes of the website, CorEx was run on each of the datasets five times and the run that resulted in the greatest overall Total Correlation was retained. Having a statistical representation of the results of multiple runs may be more informative and is a goal for future work. Additionally, the set of tumor types available on the server is rather small, but we expect this to expand over time according to user interest.
As outlined above, the CorExplorer visualizes CorEx RNA-seq factor relationships along with clinical and database information, thus enabling a variety of different modes of interrogation. We are hopeful that this tool will lead to further work to utilize the power of RNA-seq analysis for discovery and clinical application in oncology.
Disclosures
The authors declare that they have no competing financial interests.
Acknowledgements
GV was supported by DARPA award W911NF-16-0575.
Materials
| Name | Company | Catalog Number | Comments |
|---|---|---|---|
| Public server for CorExplorer website | USC | http://corex.isi.edu | Intel Xeon E5-2690 4-core 2.6 GHz, 8GB RAM. Backend architecture is LAMP: Linux, Apache, MySQL, PHP. |
| Web browser | Google/Apple | Chrome/Safari | Verified web browsers. |
References
- Petryszak, R., et al. The RNASeq-er API-a gateway to systematically updated analysis of public RNA-seq data. Bioinformatics. 33, 2218-2220 (2017).
- Steeg, G. V., Galstyan, A. Maximally Informative Hierarchical Representations of High-Dimensional Data. Proceedings of the Eighteenth International Conference on Artificial Intelligence and Statistics (AISTATS). , San Diego, CA. (2015).
- Ver Steeg, G., Galstyan, A. Discovering structure in high-dimensional data through correlation explanation. Advances in Neural Information Processing Systems. , Montreal, Canada. (2014).
- Pepke, S., Ver Steeg, G. Comprehensive discovery of subsample gene expression components by information explanation: therapeutic implications in cancer. BMC medical Genomics. 10, 12(2017).
- Byron, S. A., Van Keuren-Jensen, K. R., Engelthaler, D. M., Carpten, J. D., Craig, D. W. Translating RNA sequencing into clinical diagnostics: opportunities and challenges. Nature Reviews Genetics. 17, 257(2016).
- Cancer Genome Atlas Research Network. Comprehensive molecular profiling of lung adenocarcinoma. Nature. 511, 543(2014).
- Cancer Genome Atlas Network. Comprehensive molecular characterization of human colon and rectal cancer. Nature. 487, 330(2012).
- Akbani, R., et al. Genomic classification of cutaneous melanoma. Cell. 161, 1681-1696 (2015).
- Cancer Genome Atlas Research Network. Integrated genomic analyses of ovarian carcinoma. Nature. 474, 609(2011).
- Grossman, R. L., et al. Toward a shared vision for cancer genomic data. New England Journal of Medicine. 375, 1109-1112 (2016).
- Moynahan, M. E., Chiu, J. W., Koller, B. H., Jasin, M. Brca1 controls homology-directed DNA repair. Molecular Cell. 4, 511-518 (1999).
- Szklarczyk, D., et al. STRING v11: protein–protein association networks with increased coverage, supporting functional discovery in genome-wide experimental datasets. Nucleic Acids Research. 47, 607-613 (2018).
- Durgeau, A., Virk, Y., Corgnac, S., Mami-Chouaib, F. Recent advances in targeting CD8 T-cell immunity for more effective cancer immunotherapy. Frontiers in Immunology. 9, 14(2018).
- Sato, E., et al. Intraepithelial CD8+ tumor-infiltrating lymphocytes and a high CD8+/regulatory T cell ratio are associated with favorable prognosis in ovarian cancer. Proceedings of the National Academy of Sciences of the United States of America. 102, 18538-18543 (2005).
- De Moura, M. B., et al. Mitochondrial respiration-an important therapeutic target in melanoma. PLoS One. 7, 40690(2012).
- Folkman, J., Merler, E., Abernathy, C., Williams, G. Isolation of a tumor factor responsible for angiogenesis. Journal of Experimental Medicine. 133, 275-288 (1971).
- Takahashi, S. Vascular endothelial growth factor (VEGF), VEGF receptors and their inhibitors for antiangiogenic tumor therapy. Biological and Pharmaceutical Bulletin. 34, 1785-1788 (2011).
- Subramanian, A., et al. Gene set enrichment analysis: a knowledge-based approach for interpreting genome-wide expression profiles. Proceedings of the National Academy of Sciences of the United States of America. 102, 15545-15550 (2005).
- Cerami, E., et al. The cBio Cancer Genomics Portal: An Open Platform for Exploring Multidimensional Cancer Genomics Data. Cancer Discovery. 2, 401-404 (2012).
- Gao, J., et al. Integrative Analysis of Complex Cancer Genomics and Clinical Profiles Using the cBioPortal. Science Signalling. 6, 1(2013).
- Reich, M., et al. GenePattern 2.0. Nature Genetics. 38, 500(2006).
- Wang, Y. E., Kutnetsov, L., Partensky, A., Farid, J., Quackenbush, J. WebMeV: A Cloud Platform for Analyzing and Visualizing Cancer Genomic Data. Cancer Research. 77, 11-14 (2017).
- Morpheus. , Available from: https://software.broadinstitute.org/morpheus (2019).
- Weitschek, E., Lauro, S. D., Cappelli, E., Bertolazzi, P., Felici, G. CamurWeb: a classification software and a large knowledge base for gene expression data of cancer. BMC Bioinformatics. 19, 354(2018).
- Chou, P. -H., et al. tACCo, a Database Connecting transcriptome Alterations, pathway Alterations and Clinical outcomes in Cancers. Scientific Reports. 9, 3877(2019).
Reprints and Permissions
