The present protocol shows how to differentiate CD3−/CD45+CD56+ cells with mild cytotoxicity from human expanded potential stem cells (hEPSCs) under both 3D and 2D culture conditions. This allows for routine phenotypical validation without the destruction of the complex microenvironment.
Method Article
Generation of Natural Killer Cells from Human Expanded Potential Stem Cells
In This Article
Summary
Abstract
The differentiation of natural killer (NK) cells from human pluripotent stem cells allows for research on and the manufacture of clinical-grade cellular products for immunotherapy. Described here is a two-phase protocol that uses a serum-free commercial medium and a cocktail of cytokines (interleukin [IL]-3, IL-7, IL-15, stem cell factor [SCF], and FMS-like tyrosine kinase 3 ligand [Ftl3L]) to differentiate human expanded potential stem cells (hEPSCs) into cells that possess NK cell properties in vitro with both 3-dimensional (3D) and 2-dimensional (2D) culture technology. Following this protocol, CD3−CD56+ or CD45+CD56+ NK cells are consistently generated. When cocultured with tumor targets for 3 h, the differentiated products display mild cytotoxicity as compared to an IL-2-independent permanent cell line, NK92mi cells. The protocol preserves the complexity of the differentiation microenvironment by the generation of 3D structures, thus facilitating the study of the spatial relationships between immune cells and their niches. Meanwhile, the 2D culture system enables the routine phenotypical validation of cell differentiation without harming the delicate differentiation niche.
Introduction
Compared to conventional pluripotent stem cells like human embryonic stem cells (hESCs) and human induced pluripotent stem cells (hiPSCs), human expanded potential stem cells (hEPSCs) are closer to the state of totipotency, as they can differentiate into both extra-embryonic and embryonic lineages1. For example, hEPSCs can be differentiated into trophoblasts1 and yolk-sac-like cells2. To achieve the unique potency of hEPSCs, an individual blastomere is cultured in a medium containing several small molecules that inhibit lineage commitment signaling1, which is referred to as EPSC medium (EPSCM). Culturing hESCs and hiPSCs in the EPSCM expands their previously restricted potency to differentiate them into trophoblast cells1.
Pluripotent stem cells are a valuable research tool for experimenting with novel genetic modifications. Due to the self-renewal and differentiation capacities of pluripotent stem cells, one transformed clone of a pluripotent stem cell can produce differentiated cellular products that possess the same genetic modification at the same locus. Zhu and Kaufman established the standard for NK cell differentiation from conventional pluripotent stem cells (hESCs and hiPSCs)3. First, they induced hematopoietic stem cells (HSCs) from an embryoid body derived from pluripotent stem cells. The addition of stem cell factor (SCF), FMS-like tyrosine kinase 3 ligand (Ftl3L), interleukin (IL)-7, IL-15, and an early supplement of IL-3 biased the HSCs to develop into natural killer (NK) cells. Subsequently, they expanded the NK cells with artificial antigen-presenting cells (aAPCs), which present membrane-bound IL-21, with the continuous supplementation of IL-2. Researchers have applied this approach to immunotherapy in order to generate iPSC-derived natural killer cells endowed with the chimeric antigen receptor (CAR-iNK)4.
Human NK cells are defined as CD3−CD56+ leukocytes in the peripheral blood. They are effectors against virus-infected cells and tumor cells5. Some inhibitory receptors on NK cells recognize molecules expressed ubiquitously in normal cells. As an example, the NKG2A/CD94 heterodimer expressed on NK cells recognizes MHC class I molecules5. Meanwhile, the activating receptors on NK cells recognize stress-induced ligands, like how NKG2D recognizes transformation-induced MHC class I polypeptide-related sequence A (MICA/MICB)6. Some transformed cells downregulate their "self-ligands" to escape immune surveillance and upregulate aberrant ligands, which triggers the NK cells to execute their lytic machinery. The intrinsic anti-tumor abilities of NK cells has brought attention to this immune cell type.
The ability to simultaneously give rise to both embryonic and extra-embryonic lineages may render hEPSCs a more faithful recapitulation of the embryonic development niche than conventional pluripotent stem cells. From experience, it is easier to maintain the potency of hEPSCs than hiPSCs. In the present study, a protocol was developed (Figure 1) to bias hEPSCs to develop into hematopoietic lineages and later differentiate progenitor cells into natural killer (NK) cells in vitro. In the protocol, commercial media are employed to avoid serum inconsistencies, followed by the stepwise addition of cytokines to bias differentiation into lymphoid lineages. This protocol has two systems to preserve the complex 3D microenvironment while deriving CD3−CD56+/CD45+CD56+ cells that phenotypically and functionally resemble human NK cells.
This protocol may be useful in studying the interaction of immune cells with their differentiation niches and may have the potential to purify cellular products for immunotherapeutic uses.
Protocol
The present study involved in vitro experiments; therefore, ethics approval is not applicable. The established cell lines used in this study were obtained from commercial sources (see the Table of Materials).
1. Generation of 3D organoid structures from hEPSCs
- Maintain hEPSCs by culturing them with 1 mL of EPSC medium (12-well plate) on SNL feeder cells1.
NOTE: Dome-shaped colonies are observed (Figure 2A) if their expanded potency remains. - Perform pre-differentiation of the hEPSCs.
- Remove the hEPSC medium, and add 1 mL of DFK medium (DMEM/F12 + 10% serum replacement medium, see the Table of Materials). Incubate for 2-3 days at 37 °C and 5% CO2. Perform a medium change on the second day if continuing the incubation for 3 days.
NOTE: Under the microscope, the dome-shaped colonies are flattened (Figure 2B).
- Remove the hEPSC medium, and add 1 mL of DFK medium (DMEM/F12 + 10% serum replacement medium, see the Table of Materials). Incubate for 2-3 days at 37 °C and 5% CO2. Perform a medium change on the second day if continuing the incubation for 3 days.
- Check the formation of embryoid bodies by the hanging drop technique7,8.
- Remove the DFK medium, and wash with 1 mL of PBS once. Add 500 µL of 0.05% trypsin, and incubate the plate at 37 °C and 5% CO2 for 3-7 min based on the morphology.
NOTE: The hEPSCs must be able to be detached from the feeder cells when the plate is slightly disturbed. - Remove the trypsin, and add 2 mL of DFK medium to harvest the cells. Spin down the cells at 300 x g for 3 min at room temperature.
- Remove the supernatant with a pipette. Add 1 mL of DFK medium and 1 µL of Y27632 (see the Table of Materials) to resuspend the cells by flicking.
- Count the number of cells within the cell suspension with a hemocytometer9. Dilute the cell suspension with DFK medium and Y27632 (1,000x) so that there are 4,000 cells/25 µL of DFK medium.
- Fill the cap of a 10 cm Petri dish with around 30-40 drops of 25 µL of cell suspension per cap. Pour some PBS into the lower dish to prevent the evaporation of the droplets. Gently invert the cap, and cover the dish. Incubate the dish at 37 °C and 5% CO2 for 3 days.
- Remove the DFK medium, and wash with 1 mL of PBS once. Add 500 µL of 0.05% trypsin, and incubate the plate at 37 °C and 5% CO2 for 3-7 min based on the morphology.
2. Mesoderm and hemato-endothelial patterning of the embryoid body (EB)
- Collect EBs within the droplet.
- Collect all the EBs from the droplet into a 15 mL tube using a 1 mL pipette and some PBS. Pump a little PBS into the droplet, and then aspirate out the medium, including the EBs, with the pipette.
NOTE: Droplets that are more yellow indicate more successful formation and growth than pink droplets. - Spin down the collected EBs at 100 x g for 1 min at room temperature, and use a pipette to remove the supernatant. Add 1 mL of medium A (from a commercially available cell differentiation kit, see the Table of Materials) to transfer the collected EBs to a non-adherent 24-well plate. Label this day as Day 0 (Figure 1).
NOTE: Usually, all the EBs collected from one 10 cm dish are grouped and transferred to one well of a 24-well plate.
- Collect all the EBs from the droplet into a 15 mL tube using a 1 mL pipette and some PBS. Pump a little PBS into the droplet, and then aspirate out the medium, including the EBs, with the pipette.
- Perform mesoderm patterning of the EBs.
- Incubate the plate for 3 days at 37 °C with 5% CO2. On Day 2, remove 500 µL of medium A (from the kit, step 2.1.2) while avoiding pipetting the EBs. Then, add 500 µL of fresh medium A.
- Perform haemato-endothelial specification of the embryoid body.
- Remove 700 µL of medium A from the well, and add 700 µL of medium B (from the kit, step 2.1.2). Culture for 7 days. Perform a half-change of medium B on Day 5, Day 7, and Day 9.
3. NK cell differentiation
- Transfer the patterned EBs onto an air-liquid interface.
- Slightly tilt the plate so the EBs aggregate on the bottom. Use a 1 mL pipette to remove as much of medium B as possible while avoiding the EBs.
- Pick up the EBs with a pipette by aspirating the remaining medium. Transfer them to a transwell in a 24-well plate (see the Table of Materials).
NOTE: Restrict the numbers to two to three EBs per transwell for optimal density.
- Perform lymphoid progenitor expansion.
- Add 500 µL of NK-1 medium (commercially available lymphoid expansion medium + 14 IU/mL IL-3, 4,500 IU/mL IL-15, 8,800 IU/mL IL-7, 26 IU/mL SCF, and 12 IU/mL ftl3L, see the Table of Materials) to the lower compartment of the transwell. Culture for 14 days, and perform a medium change every other day.
- Harvest and transfer the cells on Days 7-10 to a coated plate.
- To coat the plate, dilute the coating material (commercially available lymphoid differentiation coating material, 100x, see the Table of Materials) in PBS. Add 1 mL of diluted coating solution to each well of a 12-well plate, and incubate the plate at 4 °C overnight. Cover the opening of the plate with wrapping film.
- Add 200 µL of PBS into the transwell, and slowly pipette up and down around five to six times to harvest the cells released from the organoids. Avoid pipetting the organoids.
NOTE: Round cells are released from the organoids continuously (Figure 2D). - Transfer the harvested cell suspension to a 2 mL tube, and spin down the cells at 500 x g for 5 min at room temperature. Remove the supernatant with a pipette, and add 1 mL of NK-1 medium (step 3.2.1) to resuspend the cells by pipetting.
- Remove all the coating solution from the well, and wash each well of a 12-well plate with 1 mL of PBS twice.
- Split the harvested cells at a 1:2 ratio. Transfer the cell suspension onto a coated 12-well plate (step 3.3.1). Add 1 mL of NK-1 medium so that each well has 1.5 mL of medium.
- To perform a medium change, let the cells sit for 1-2 min to allow the cells to sink to the bottom. Carefully aspirate out 750 µL of medium. Spin down the collected supernatant at 500 x g for 5 min at room temperature.
- Discard most of the supernatant, and resuspend in 750 µL of NK-1 medium with pipetting five to six times. Add the cells resuspended in the fresh medium into the original well.
NOTE: This parallel system is referred to as the 2D system in Figure 1. Follow the medium change schedule of the well of the organoids the cells originated from.
- Perform NK cell maturation following the steps below.
- Remove the old medium of the 3D system, and add 500 µL of NK-2 (commercially available NK cell differentiation medium + 4,500 IU/mL IL-15, 8,800 IU/mL IL-7, 26 IU/mL SCF, and 12 IU/mL ftl3L, see the Table of Materials) into the lower compartment of the transwell. Incubate at 37 °C and 5% CO2 for 14 days.
NOTE: Ensure that the medium is touching the bottom of the transwell. - Perform a full medium change on the cells in the 2D system. Collect all 1.5 mL of cells from one well, and centrifuge it at 500 x g for 5 min at room temperature. Remove most of the supernatant with a pipette, and resuspend the pellet with 1.5 mL of NK-2 medium (step 3.4.1).
- Perform a medium change every alternate day. Slightly tilt the plate of the 3D system, and remove all the old medium outside the transwell. Add 500 µL of NK-2 medium outside of the transwell.
- To perform a half medium change on one well of a 12-well plate for the 2D system, let the cells sit for 1-2 min to allow the cells to sink to the bottom. Carefully aspirate out 750 µL of the medium.
- Spin down the collected supernatant at 500 x g for 5 min at room temperature to prevent cell loss. Discard most of the supernatant, and resuspend in 750 µL of NK-2 medium by pipetting five to six times. Add the cells resuspended in fresh medium into the original well.
- Remove the old medium of the 3D system, and add 500 µL of NK-2 (commercially available NK cell differentiation medium + 4,500 IU/mL IL-15, 8,800 IU/mL IL-7, 26 IU/mL SCF, and 12 IU/mL ftl3L, see the Table of Materials) into the lower compartment of the transwell. Incubate at 37 °C and 5% CO2 for 14 days.
4. Harvesting mature cells
- Harvest the cells cultured in the 2D system.
- Harvest the cells by pipetting up and down during Days 38-45. Wash with 1 mL of PBS twice. Centrifuge the cell suspension at 500 x g for 5 min at room temperature.
- Remove the supernatant with a pipette, and resuspend it in the buffer of choice (i.e., PBS + 2% FBS for flow cytometry, see the Table of Materials).
- Harvest the cells embedded in the organoid.
- Collect the medium from outside of the transwell into a 15 mL tube during Days 38-45. Wash the organoid twice by adding 200 µL of PBS inside the transwell and pipetting up and down five to six times. Transfer the suspension to the 15 mL tube.
- Add 500 µL of PBS into a well of a 12-well plate. Transfer the organoid from the transwell to that well of the 12-well plate with forceps.
- Cut the organoid 20 times using a pair of scissors and forceps. Flush the remaining cells on the forceps and scissors into the well with PBS. Collect as much PBS as possible, and transfer it to the 15 mL tube used in step 4.2.1 without aspirating the organoid structure.
- Add 500 µL of the dissociation reagent (see the Table of Materials) into the transwell to digest the organoid enzymatically. Incubate with a commercial cell detachment solution (see the Table of Materials) for 7-10 min at 37 °C and 5% CO2. Quench the reaction by adding 1 mL of PBS with 2% FBS, and collect the solution in another 15 mL tube. Wash the well with 1 mL of PBS with 2% FBS twice.
NOTE: Determine the length of the incubation based on the morphology. Try to achieve the point at which single cells start to be released from the membrane of the 3D structure. - Add 1 mL of PBS with 2% FBS, and pipette up and down 8-10 times. Collect all the solutions, including the organoid structures. Transfer them to the 15 mL tube used in step 4.2.3 with a cell strainer.
- Centrifuge both of the tubes at 500 x g for 5 min at room temperature. Discard the supernatant with a pipette. Resuspend the cell pellet with the buffer of choice (step 4.1.2).
Results
It was hypothesized that the present in vitro differentiation (IVD) products would possess similar surface markers and anti-tumor abilities to human NK cells.
The defining marker of human NK cells was accessed to test whether the differentiation products from the 3D culture system yielded cells that phenotypically resembled human NK cells. About 15% of the cells dissociated from the 3D culture system from two batches induced at different time points (n = 2) were CD3−CD56+ (Figure 3A). CD3 was replaced with CD45 (a pan-leukocyte marker) in the test panel due to the absence of CD3 and the difficulty inducing T cells in vitro. Approximately 16% of the cells dissociated from the 3D structure were CD45+CD56+ (Figure 3B, n = 1), which is in line with the percentages of CD3−CD56+ cells seen in earlier trials. The percentages of CD3−CD56+ cells in the cells harvested from the 2D culture system ranged from 30% to 6%, from more successful inductions (Figure 3C, n = 3) to less successful inductions (Figure 3D, n = 2). The functionality and phenotypes of the cells harvested from the 2D culture system were validated. During the Day 18 culture from the 2D system, about 12% of the cells expressed both ectopic CD56 and CD107a after 2 h of 50 ng/mL IL-18, 455 IU/mL IL-2, and 20 ng/mL anti-CD244 antibody stimulation (Figure 4C, n = 1). About 28% of the harvested cells were CD94+CD159a+ (Figure 4B, n = 1). The ectopic expression of CD107a, a protein lining on the membrane of granules, indicates degranulation10, while the CD94/NKG2A(CD159a) heterodimer is another defining marker of NK cells. This provides an example of the phenotypic and functionality validation of IVD products.
The functionality of the IVD products was tested by their cytotoxicity against human erythroleukemia cells-K562 cells. Comprehensive ligand profiling on K562 cells reveals their downregulated major histochemistry complex I (MHC-I) and comparatively strong NKG2D ligand expression (such as ULBP-1, ULBP-2/5/6, and ULBP-3)11; thus, K562 cells are susceptible to the lytic activity of NK cells12. Both IVD endpoint products and NK92mi cells were primed with 50 ng/mL IL-18, 455 IU/mL IL-2, and 20 ng/mL anti-CD244 antibodies overnight. The GFP+ K562 cells were cocultured with either harvested cells from IVD or NK92mi cells at different effector-to-target ratios (E:T) in the presence of 50 ng/mL (IU not provided) IL-18, 455 IU/mL IL-2, and 20 ng/mL anti-CD244 antibodies in the same volume of H5100 medium for 3 h. The readout of NK cell killing activity was the expression of the dead cell marker on GFP+ subsets. The K562 cells were transduced with a commercially available control vector (see the Table of Materials) to express GFP constitutively, and the efficiency of the transduction was about 80% (Supplementary Figure 1A). The percentages of GFP signal added were proportional to the number of GFP+ K562 cells added, suggesting specific GFP expression from the transduced K562 cells (Supplementary Figure 1B).
The percentages of dying target cells shown in Figure 5 were calculated with the following formula13:
Percentage of dying cells = (FITC + DAPI + % of coculture [for example, Figure 5A]) - (FITC + DAPI + % of transduced K562 cells)
Of all three E:T ratios assessed (0.1:1, 0.33:1, 1:1), the percentages of dying GFP+ cells were positively correlated with the E:T ratios when cocultured with IVD products (Figure 5B, hEPSC-NK) or NK92mi cells (Figure 5B, NK92mi), indicating the specific killing of tumor targets. However, the cytotoxicity of the IVD products was comparatively modest within the tested timeframe (Figure 5C).
Finally, the lymphoid progenitor cell generation was compared between the 3D and 2D cultures. It was found that the 3D culture condition generated more progenitor cells (55,000 cells) than the 2D culture condition (36,000 cells) (Supplementary Figure 2). This suggests that the context of tissue architecture and cellular components in the 3D culture supported the generation of lymphoid progenitor cells.
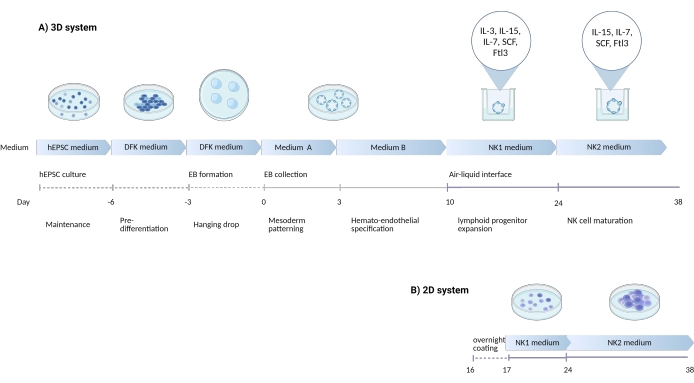
Figure 1: Schematic diagram showing the differentiation strategy to differentiate NK cells from hEPSCs. (A) Here, the timeline of the 3D culture systems is shown, detailing the culture conditions and brief keywords from each step. The air-liquid interface of the 3D system is maintained during the NK cell induction. (B) Here, the timeline of the 2D culture systems is shown. The released cells harvested from Days 7-10 from structures in the 3D system are seeded on a coated plate without the air-liquid interface. Please click here to view a larger version of this figure.

Figure 2: Morphology of the cells observed at distinct stages of differentiation. (A) The morphology of hEPSCs when maintained in EPSCM. The hEPSCs form domed-shaped colonies. (B) The morphology of hEPSCs after pre-differentiation. The domed-shaped colonies are flattened. The hEPSCs are harvested and form EBs with the hanging drop technique. The EBs are collected and cultured in medium A and then medium B. (C) The morphology of an EB on Day 10. During this period, the EB starts to expand and inflate, forming membranous structures. (D) The morphology of a cell-releasing EB. After seeding on the transwell, the EB grows and constantly releases round cells to the surroundings. Some of the released cells are collected and cultured on a 12-well plate coated with lymphoid differentiation coating materials. The cell populations are morphologically heterogeneous and tend to aggregate together. (E) The morphology of cells observed at the endpoint of the IVD. Small, circular suspension cells (black arrow) are observed. Scale bars: (A,B,E) = 100 µm; (C,D) = 100 µm. Please click here to view a larger version of this figure.

Figure 3: Representative FACS plots of hEPSC-derived products at the endpoint. Cells are incubated with fluoroscope-conjugated antibodies on ice for 30 min. The samples are stained with DAPI before being loading into the FACS sample injection port. Unstained cells are used to establish the negative gating. (A) Representative FACS plot on CD3 and CD56 expression in cells dissociated from the 3D culture system from two batches (n = 2). (B) Representative FACS plot on CD45 and CD56 expression in cells dissociated from the 3D culture (n = 1). (C) Representative FACS plot on CD3 and CD56 expression in cells harvested from the coated plate from a successful induction (n = 3). (D) Representative FACS plot on CD3 and CD56 expression from the coated plate when the induction is suboptimal (n = 2). Please click here to view a larger version of this figure.

Figure 4: Representative FACS plot on hEPSC-derived products during Day 18 culture (n = 1). (A) FACS plot on CD56 and CD107a expression after 2 h of stimulation with IL2, IL-18, and anti-CD244 antibodies. (B) FACS plot on CD159a and CD94 expression. The samples are stained withDAPI before being loaded into the FACS sample injection port. Unstained cells are used to establish the negative gating. Please click here to view a larger version of this figure.

Figure 5: Plot of the percentages of dying cells against different E:T ratios from the coculture of GFP+ K562 cells with either the IVD endpoint product or NK92mi cells (n = 1). The expression of FITC+ DAPI+ cells was assessed with a cell analyzer, and the data analysis was performed with compatible software. (A) A representative FACS plot showing the gating of FITC + DAPI + subsets from the coculture of IVD products and K562 cells with an E:T ratio of 1. (B) Individual plots from the coculture experiment with GFP+ IVD products (left) or NK92mi cells (right) for 3 h. Both reflect a positive proportional relationship between the percentage of dying cells and the E:T ratio. (C) A plot showing the killing curves of IVD products and NK92mi cells on the same scale. The IVD products displayed mild cytotoxicity as compared to the NK92mi cells. Please click here to view a larger version of this figure.
Supplementary Figure 1: Functional assay of NK cells from hEPSCs. (A) FACS histogram of transduced K562 cells. The FITC+ K562 cells expressed GFP. (B) FACS histograms from the coculture of GFP+ K562 cells and the endpoint IVD products at three E:T ratios (n = 1). The percentages of FITC+ cells in the coculture corresponded to the number of added transduced K562 cells. The gatings were established with untransduced K562 cells. Please click here to download this File.
Supplementary Figure 2: Lymphoid progenitor differentiation in 2D versus 3D culture. The present organoid-based protocol was used to induce lymphoid progenitors from human expanded potential stem cells. Two conditions were set up: (1) lymphoid progenitors were kept in culture within the organoids (3D), and (2) lymphoid progenitors were isolated and kept on the culture dish (2D). After 2 weeks of additional culture, the cell numbers were determined to compare the 2D versus 3D culture. Please click here to download this File.
Discussion
There are a few pivotal steps to ensure the successful differentiation of CD45+CD56+ cells from hEPSCs. The pre-differentiation (step 1.2) is crucial since the EPSC medium contains inhibitors of lineage commitment1. After pre-differentiation, the dome-shaped colonies of hEPSCs are flattened (Figure 2B). The addition of Y27632, a Rho-kinase inhibitor (ROCKi), during the formation of EBs from hEPSCs (step 1.3) is indispensable for the survival of the hEPSCs after dissociation. Another important consideration is the number of EBs planted on each transwell. Since it is a small-scale system, two to three EBs per transwell is the optimal density to prevent overconsumption of the media. The air-liquid interface is maintained during the whole course of NK cell differentiation for the 3D system, which is believed to maintain the polarity of the stromal cells and support the expansion of the AGM-derived hematopoietic progenitors14,15.
As mentioned before, the density of EBs on the transwell is a determining factor for successful differentiation. The key sign for this is the color of the medium 1 day after the implantation of EBs on the transwell. If the color turns yellow quickly, this indicates either contamination or overcrowding. To solve the issue, a 1 mL pipette should be used to manually pick up extra EBs and transfer them into another transwell.
A major limitation of this protocol is the purity of CD3−/CD45+ CD56+ cells in the IVD products, which is believed to be partially responsible for the inferior cytotoxicity compared to pure NK92mi cells. A 3D culture system was employed to induce hematopoietic progenitors via the generation of an EB that resembles the three embryonic germ layers. This strategy mimics the development of blood cells in the bone marrow microenvironment, thus removing the need for stromal cells to support the differentiation3. Without a sorting step to purify the hematopoietic progenitors, the purity of the IVD products is anticipated to be reduced. A strategy to retain the complex differentiation niche while increasing the purity of the endpoint product is developing an expansion method for the sorted CD3−CD56+ IVD products. For example, the sorted CD3−CD56+ IVD products can be cultured on artificial antigen-presenting cells (aAPCs), such as irradicated K562 cells engineered with membrane-bound IL-21. With the supply of IL-2 in the culture, this method can achieve a 1,000-fold increase in NK cell numbers3.
Another limitation is the limited access to bona fide human NK cells as a positive reference. NK92mi is the positive reference employed in the coculture assay, but it is not accurate enough. NK92mi cells are engineered from NK92 cells, a permanent cell line that expresses activated NK cell phenotypes16, to autonomously produce IL-2 to meet the culture requirements. NK92 cells demonstrate superior killing activity against K562 cells in vitro than human primary NK cells17. A fairer comparison of the tumor-killing capacity of IVD products could be achieved by assaying the cytotoxicity of peripheral blood NK cells in parallel, but unfortunately, access to blood banks is lacking.
This two-system culture protocol aims to generate CD3−/CD45+CD56+ cells from hEPSCs. The assessment of the surface markers and cytotoxicity with FACS can be routinely performed on cells from 2D systems without disrupting the differentiation niche. Despite the differences in the percentages of CD3−CD56+ cells, the 3D and 2D systems can derive CD3−CD56+ cells with similar variations in CD56 expression (Figure 3), and the 2D system reflects the existence of lymphoid progenitors from the 3D culture condition.
The significance of utilizing the 3D culture system is that it allows the use of high-resolution profiling assays, such as spatial transcriptomics or imaging mass spectrometry, to research the spatial relationships and cell-cell interactions within the complex differentiation niche.
Disclosures
The authors declare no conflicts of interest.
Acknowledgements
We would like to thank Dr. Handi Cao, Sanxing GAO, David Xiang, Yiming Chao, Ritika Jogani, Owen Chan, Stephanie Cheung, and Celine Chan for their technical assistance and useful discussions. This work was supported by the Platform Technology Fund. Figure 1 has been created with BioRender.com.
Materials
| Name | Company | Catalog Number | Comments |
|---|---|---|---|
| 30 w/v% Albumin Solution, from Bovine Serum(BSA), Fatty Acid Free | Wako Chemicals | 017-22231 | For resuspending cytokines. |
| ACCUMAX | STEMCELL Technologies | 07921 | |
| Anti-human-CD159a-PE | BD | 375104 | During antibody staining, 0.5 µL of antibodies is added into the staining buffer (PBS + 5% FBS) |
| Anti-human-CD3-APC antibodies | BD | 555355 | During antibody staining, 0.5 µL of antibodies is added into the staining buffer (PBS + 2% FBS) |
| Anti-human-CD45-APC antibodies | BD | 555485 | During antibody staining, 0.5 µL of antibodies is added into the staining buffer (PBS + 3% FBS) |
| Anti-human-CD56-PE antibodies | BD | 555516 | During antibody staining, 0.5 µL of antibodies is added into the staining buffer (PBS + 4% FBS) |
| Anti-human-CD56-PEcy7 antibodies | BD | 335826 | During antibody staining, 0.5 µL of antibodies is added into the staining buffer (PBS + 5% FBS) |
| Anti-human-CD94-APC | BD | 559876 | During antibody staining, 0.5 µL of antibodies is added into the staining buffer (PBS + 5% FBS) |
| Bemis Parafilm M Laboratory Wrapping Film | Thermo Scientific | 11772644 | |
| Cd244 Monoclonal Antibody (eBioC1.7 (C1.7)), Functional Grade, eBioscience | Thermo Scientific | 16-5838-85 | |
| Costar 6.5 mm Transwell, 0.4 µm Pore Polyester Membrane Inserts | STEMCELL Technologies | 3470 | |
| Dapi Solution, 1 mg/mL | BD | 564907 | It is resuspended with ddH2O so the concentration is 10 µM/mL. Add 1 µL of the aliquot in 300 µL of FACS buffer (PBS + 2% FBS) |
| DMEM | CPOS-Bioreagent core | 11965092 | |
| DMEM/F12 | Thermo Scientific | 11320033 | |
| FcX, human | Biolengend | 422302 | |
| Fetal Bovine Serum(FBS) qualified E.U.-approved South America | CPOS-Bioreagent core | 10270106 | |
| FlowJo v10.8.0 | BD | ||
| Gibco PBS (10x) pH 7.4 | CPOS-Bioreagent core | 70011044 | 10x concentrated PBS is manufactured as follows: without calcium, magnesium or phenol red |
| K562 cells | ATCC | CCL-243 | |
| Knockout Serum Replacement | Thermo Scientific | 10828-028 | |
| MyeloCult H5100 medium | STEMCELL Technologies | 5150 | |
| NK92mi cells | ATCC | CRL-2408 | Lot: 70045208. Once thawed, they are cultured in MyeloCult H5100 medium, and maintained the density between 2 x 10⁵ to 1 x 10⁶ cell/mL. |
| Nunc Cell-Culture Treated Multidishes 12 well plate | Thermo Scientific | 150628 | flat bottom |
| Nunc Cell-Culture Treated Multidishes 24 well plate | Thermo Scientific | 142475 | |
| Nunc EasYDish Dishes | Thermo Scientific | 150460 | |
| pLenti-GFP Lentiviral Control Vector | CELL BIOLABS | LTV-400 | It is packaged as the manufactuer suggested (https://www.cellbiolabs.com/sites/default/files/LTV-400-gfp- lentiviral-plasmid.pdf). 40 μL of 50x lentivirus is added with 1 μL 10 mg/mL polybrene per 1 mL of cell suspension. Complete medium change is performed 24 h after the addition of lentivirus. Cells are incubated undisputedly for 3 days at 37 °C, 5% CO2. |
| Polybrene | EMD Millipore | TR-1003-G | |
| Recombinant Human Flt-3 Ligand/FLT3L Protein | R&D Systems | 308-FK-005 | It is resuspend with PBS + 0.2% BSA. Thr working concentration is 10 ng/mL or 12 IU/mL. |
| Recombinant Human IL-15 Protein | R&D Systems | 247-ILB-005 | It is resuspended with PBS + 0.2% BSA. The working concentration is 10 ng/mL or 4500 IU/mL. |
| Recombinant Human IL-18/IL-1F4 Protein | R&D Systems | 9124-IL-010 | It is resuspended with PBS + 0.2% BSA. The working concentration is 50 ng/mL. The IU is not provided by the company. |
| Recombinant Human IL-2 Protein | R&D Systems | 202-IL-010 | It is resuspended with PBS + 0.2% BSA. The working concentration is 50 ng/mL or 455 IU/mL. |
| Recombinant Human IL-3 Protein, 50ug | PeproTech | 200-03 | It is resuspended with PBS + 0.2% BSA. The working concentration is 5 ng/mL or 14 IU/mL. |
| Recombinant Human IL-7 Protein | R&D Systems | 207-IL-010 | It is resuspended with PBS + 0.2% BSA. The working concentration is 20 ng/mL or 8800 IU/mL. |
| Recombinant Human SCF Protein | R&D Systems | 255-SC-010 | It is resuspended with PBS + 0.2% BSA. The working concentration is 20 ng/mL or 26 IU/mL. |
| STEMdiff Hematopoietic Kit | STEMCELL Technologies | 5310 | Medium A: 45 mL STEMdiff Hematopoietic Basal Medium + STEMdiff Hematopoietic Supplement A ; Medium B: 75 STEMdiff Hematopoietic Basal Medium + STEMdiff Hematopoietic Supplement B |
| StemSpan lymphoid differentiation coating material | STEMCELL Technologies | 9950 | It is resuspended in PBS (100x) |
| StemSpan NK cell differentiation medium | STEMCELL Technologies | 9960 | It is prepared by adding 500 µL StemSpan NK Cell Differentiation Supplement (100x) into 49.5 mL of SFEM II. Both are provided in StemSpan NK Cell Generation Kit. |
| StemSpan lymphoid expansion medium | STEMCELL Technologies | 9960 | It is prepared by adding 5 mL StemSpan Lymphoid Progenitor Expansion Supplement (10x) into 45 mL of StemSpan SFEM II. Both are provided in StemSpan NK Cell Generation Kit. |
| StemSpan NK Cell Generation Kit | STEMCELL Technologies | 9960 | Thaw the medium and materials in room temperature and the medium is stored in 4 °C once thawed. |
| The BD LSRFortessa cell analyzer | BD | ||
| Trypsin-EDTA (0.05%), phenol red | Thermo Scientific | 25300054 | |
| Y-27632 dihydrochloride | Tocris | 1254 | working concentration: 10 µM |
References
- Gao, X., et al. Establishment of porcine and human expanded potential stem cells. Nature Cell Biology. 21 (6), 687-699 (2019).
- Mackinlay, K. M. L., et al. An in vitro stem cell model of human epiblast and yolk sac interaction. eLife. 10, 63930(2021).
- Zhu, H., Kaufman, D. S. An improved method to produce clinical-scale natural killer cells from human pluripotent stem cells. Methods in Molecular Biology. 2048, 107-119 (2019).
- Li, Y., Hermanson, D. L., Moriarity, B. S., Kaufman, D. S. Human iPSC-derived natural killer cells engineered with chimeric antigen receptors enhance anti-tumor activity. Cell Stem Cell. 23 (2), 181-192 (2018).
- Vivier, E., Tomasello, E., Baratin, M., Walzer, T., Ugolini, S. Functions of natural killer cells. Nature Immunology. 9 (5), 503-510 (2008).
- Dhar, P., Wu, J. D. NKG2D and its ligands in cancer. Current Opinion in Immunology. 51, 55-61 (2018).
- Dang, S. M., Kyba, M., Perlingeiro, R., Daley, G. Q., Zandstra, P. W. Efficiency of embryoid body formation and hematopoietic development from embryonic stem cells in different culture systems. Biotechnology and Bioengineering. 78 (4), 442-453 (2002).
- Rungarunlert, S., Techakumphu, M., Pirity, M. K., Dinnyes, A. Embryoid body formation from embryonic and induced pluripotent stem cells: Benefits of bioreactors. World Journal of Stem Cells. 1, 11-21 (2009).
- Counting cells using a hemocytometer. abcam. , Available from: https://www.abcam.com/protocols/counting-cells-using-a-haemocytometer (2022).
- Alter, G., Malenfant, J. M., Altfeld, M. CD107a as a functional marker for the identification of natural killer cell activity. Journal of Immunological Methods. 294, 15-22 (2004).
- Tremblay-McLean, A., Coenraads, S., Kiani, Z., Dupuy, F. P., Bernard, N. F. Expression of ligands for activating natural killer cell receptors on cell lines commonly used to assess natural killer cell function. BMC Immunology. 20, 8(2019).
- Inoue, T., Swain, A., Nakanishi, Y., Sugiyama, D. Multicolor analysis of cell surface marker of human leukemia cell lines using flow cytometry. Anticancer Research. 34 (8), 4539(2014).
- Mhatre, S. Rapid flow cytometry based cytotoxicity assay for evaluation of NK cell function. Indian Journal of Experimental Biology. 52 (10), 983-988 (2014).
- Medvinsky, A., Dzierzak, E. Definitive hematopoiesis is autonomously initiated by the AGM region. Cell. 86 (6), 897-906 (1996).
- Motazedian, A., et al. Multipotent RAG1+ progenitors emerge directly from haemogenic endothelium in human pluripotent stem cell-derived haematopoietic organoids. Nature Cell Biology. 22 (1), 60-73 (2020).
- Gong, J. H., Maki, G., Klingemann, H. G. Characterization of a human cell line (NK-92) with phenotypical and functional characteristics of activated natural killer cells. Leukemia. 8 (4), 652-658 (1994).
- Yan, Y., et al. Antileukemia activity of a natural killer cell line against human leukemias. Clinical Cancer Research. 4 (11), 2859-2868 (1998).
Reprints and Permissions
