JoVE Science Education
Earth Science
A subscription to JoVE is required to view this content.  Sign in or start your free trial.
JoVE Science Education Earth Science
Determining Spatial Orientation of Rock Layers with the Brunton Compass
  • 00:00Overview
  • 00:59Principles of the Brunton Compass
  • 01:49Setup of the Brunton Compass
  • 02:42Collection of Measurements
  • 03:52Results
  • 04:33Applications
  • 05:18Summary

Détermination de l'orientation spatiale des couches rocheuses avec la boussole Brunton

English

Share

Overview

Source : Laboratoire de Alan Lester – Université du Colorado Boulder

La plupart des unités lithologiques présentent une forme de surfaces planes ou caractéristiques linéaires. Exemples incluent literie – faute-, fracture-et joint-surfaces et diverses formes d’alignement foliation et minérale. L’orientation spatiale de ces éléments forment les critiques données brutes utilisées pour contraindre les modèles traitant de l’origine et la déformation subséquente des unités lithologiques.

Bien que maintenant plus de 100 ans depuis son invention et l’introduction, la boussole Brunton (Figure 1) reste un outil central dans l’arsenal de la géologue moderne d’équipements de terrain. C’est toujours le principal outil utilisé pour générer des données de terrain concernant l’orientation géométrique des surfaces planes de roche ou des caractéristiques de la roche linéaires. Ces mesures d’orientation sont appelés grève tremper et fournir des données fondamentales pour faire des cartes géologiques. Par ailleurs, la boussole Brunton peut également fonctionner comme une boussole traditionnelle pour les exercices de localisation et de triangulation. Enfin, il peut également servir un transit de poche pour mesurer les altitudes angulaires.

Figure 1
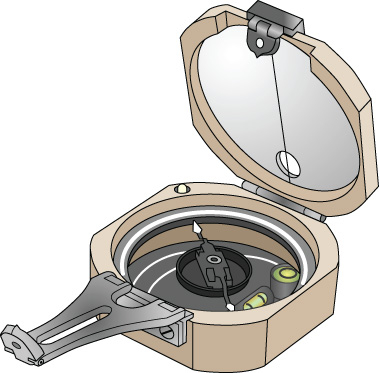
La figure 1. La boussole Brunton.

Principles

Procedure

1. préparation Vérifiez gratuitement mouvement aiguille. Vérifiez que l’aiguille est sans entrave dans le plan horizontal. Certaines boussoles ont des boutons de bride qui maintiennent l’aiguille en place, et le cas échéant, vérifiez que pousser la bride ne bouge pas l’aiguille. Vérifier le centrage de la « bulle de l’oeil de boeuf » et la continuité. Cette bulle est l’un des deux bulles de nivellement et sert à déterminer l’horizontalité de la boussole. Autre la bulle est…

Results

A set of strike and dip data for a non-dipping rock layer has a range of values. The precision of a single measurement is, of course, linked to mechanical compass-errors and the experience of the compass-user. The accuracy of the final analysis is dependent on the uniformity of the natural surface (many nominally “flat-lying” rock layers have some degree of inherent surface undulations) and the number of total measurements taken.

Strike and dip data are initially recorded in field notebooks, and then transferred to tabulated form, and ultimately onto geologic maps (Figure 4). All geologic maps show the boundaries between rock units, and the strike and dip data (bar and stick symbols) provides the three-dimensional component, describing the spatial orientation of each rock unit.

Strike and dip of bedding, the most common kind of rock orientation data, is shown at a specific location with symbols like the ones below.

Besides strike and dip of bedding, there are many other sorts of planar and/or linear rock features that have strike and dip and some of these are shown in Figure 5.

Figure 4
Figure 4. Strike and dip of bedding on a map. Strike and dip of bedding, the most common kind of rock orientation data, is shown at a specific location with symbols like the ones below.

Figure 5
Figure 5. Strike and dip map key. Map key for planar and/or rock features demonstrating strike and dip.

Applications and Summary

Geologists strive to understand the earth in four-dimensions. The goal is to interpret the structure of rocks on the surface, in the subsurface, and through time. Strike and dip information generated by the Brunton Compass is the starting point with which geologists make geologic maps, and then those maps can be used to make cross sectional diagrams, showing the structures in the subsurface (Figure 6).

Understanding rock structures in the three spatial dimensions and also through time provides a window on the physical evolution of our planet. In addition, this kind of knowledge is central to many industrial and economic applications. One example is the identification of rock up-warps, where layers have been bent in domes or fold structures called anticlines— and it is at the apex of these structures that oil and gas often collect.

Figure 6
Figure 6. Geologic cross section. Geologic cross sections are representations of underground geology. The line (D-D’) on the map is the line along which the cross section was drawn. Anticlines, synclines, and faults can be seen in cross sections.

Transcript

The role of geology is to understand the earth in four dimensions: spatial as well as time.

The Brunton compass, while over 100 years old, is still the primary tool for generating geologic field data. There are several key components of the compass, including the sighting arm, magnetic needle, clinometer, index pin, and bubble and clinometer levels. The compass is used to collect field data regarding the geometric orientation of planar rock surfaces, known as strike and dip. This information is the fundamental data for generating geologic maps.

This video will demonstrate the proper way to measure strike and dip with the Brunton compass.

Most rock units exhibit some form of planar surface structure, such as bedding. Rock layers can be described as a planar surface in space. Any angular deviation for the horizontal is known as “dip”. Dip is reported in degrees, with a range between 0 and 90. The value is followed by the general direction of the dipping.

In addition to the deviation from the horizontal, geologists also measure the deviation of the rock surface from North, or, “strike”. Strike can be visualized as the linear intersection of the horizontal plane and the surface being studied. Strike is reported in degrees from North.

Now that you understand the principles behind strike and dip, let’s see how it is measured in the field.

Before measurements can be collected with the compass, the functionality of the components must be verified.

First, the needle must be unimpeded when held in the horizontal plane. Second, verify that the lift pin locks the needle in place when depressed.

Third, check that the bull’s eye level can be centered in a smooth, uninterrupted manner. The bubble is used to determine the horizontality of the compass.

Finally, while the geographic North Pole is a static location, the magnetic north pole moves over time. Because of this, a declination pin is used to correct for the difference. Find the declination on a local topographic map, and the adjust the set-screw to the appropriate value.

Because natural surfaces are inherently rough, a representative, flat surface must be established. A way to create the surface is the place a notebook or clipboard onto the rock in a representative orientation.

Place the compass against the surface. Rotate the compass until the bubble is centered in the bull’s eye level.

With the bull’s eye leveled, the compass is now aligned in the horizontal plane. The strike is indicated by the compass needle. The value at either end of the needle is correct, but by convention, the value closer to North is used.

Dip is measured perpendicular to the strike. Set the compass on its side, aligned along the downward slope. Adjust the inclinometer until the bubble is leveled. The dip magnitude is indicated be the inclinometer. In addition, the general direction of the dip is notated.

The process of collecting strike and dip values is continued for all rock units of interest.

When taking measurements, it’s important to practice good technique and verify the compass is working properly. This will ensure good precision for the data.

The accuracy of the data is dependent on the uniformity of the natural surface. Taking multiple measurements of the same surface can increase the accuracy.

Once the strike and dip values have been correctly recorded in the field, they are combined into geologic maps. These maps show the boundaries between rock units, and the strike and dip data provides the spatial orientation of each rock.

Strike and dip data is the starting point to understanding more complicated geological structures.

Once the geologic maps are created, geologic cross-sections can be generated. The information in the geologic map is extrapolated to determine the structure of rocks below the surface. In turn, this can provide information about the physical evolution of the area.

Another use of strike and dip data is to identify anticlines. Anticlines are upward folds in rock strata, caused by compressional stress. When one of the strata in the anticline is impenetrable, buoyant gas and oil are trapped beneath it. Drilling companies can use this information to locate drilling sites.

You have just watched JoVE’s introduction of the Brunton compass. You should now understand the setup of the compass, proper usage, and how to take strike and dip measurements. Thanks for watching!

Tags

Cite This
JoVE Science Education Database. JoVE Science Education. Determining Spatial Orientation of Rock Layers with the Brunton Compass. JoVE, Cambridge, MA, (2023).