


Summary
The combination of chromatin immunoprecipitation and ultra-high-throughput sequencing (ChIP-seq) can identify and map protein-DNA interactions in a given tissue or cell line. Outlined is how to generate a high quality ChIP template for subsequent sequencing, using experience with the transcription factor TCF7L2 as an example.
Abstract
ChIP-sequencing (ChIP-seq) methods directly offer whole-genome coverage, where combining chromatin immunoprecipitation (ChIP) and massively parallel sequencing can be utilized to identify the repertoire of mammalian DNA sequences bound by transcription factors in vivo. "Next-generation" genome sequencing technologies provide 1-2 orders of magnitude increase in the amount of sequence that can be cost-effectively generated over older technologies thus allowing for ChIP-seq methods to directly provide whole-genome coverage for effective profiling of mammalian protein-DNA interactions.
For successful ChIP-seq approaches, one must generate high quality ChIP DNA template to obtain the best sequencing outcomes. The description is based around experience with the protein product of the gene most strongly implicated in the pathogenesis of type 2 diabetes, namely the transcription factor transcription factor 7-like 2 (TCF7L2). This factor has also been implicated in various cancers.
Outlined is how to generate high quality ChIP DNA template derived from the colorectal carcinoma cell line, HCT116, in order to build a high-resolution map through sequencing to determine the genes bound by TCF7L2, giving further insight in to its key role in the pathogenesis of complex traits.
Introduction
For many years there has been an unmet need to identify the set of genes bound and regulated by a given protein genome wide, in particular those in the transcription factor class.
Odom et al.1 used chromatin immunoprecipitation (ChIP) combined with promoter microarrays to systematically identify the genes occupied by pre-specified transcriptional regulators in human liver and pancreatic islets. Subsequently, Johnson et al.2 developed a large-scale chromatin immunoprecipitation assay based on direct ultra high-throughput DNA sequencing (ChIP-seq) in order to comprehensively map protein-DNA interactions across entire mammalian genomes. As a test case, they mapped in vivo the binding of the neuron-restrictive silencer factor (NRSF) to 1946 locations in the human genome. The data displayed sharp resolution of binding position (+50 base pairs), which facilitated both the isolation of motifs and the identification of NRSF-binding motifs. These ChIP-seq data also had high sensitivity and specificity and statistical confidence (P < 10−4), properties that are important for inferring new candidate interactions.
Robertson et al.3 also used ChIP-seq in order to map STAT1 targets in interferon-γ (IFN-γ)-stimulated and unstimulated human HeLa S3 cells in vivo. By ChIP-seq, using 15.1 and 12.9 million uniquely mapped sequence reads, and an estimated false discovery rate of less than 0.001, they identified 41,582 and 11,004 putative STAT1-binding regions in stimulated and unstimulated cells, respectively. Of the 34 loci known to contain STAT1 interferon-responsive binding sites4-8, ChIP-seq found 24 (71%). ChIP-seq targets were enriched in sequences similar to known STAT1 binding motifs. Comparisons with two existing ChIP-PCR data sets suggested that ChIP-seq sensitivity was between 70% and 92% and specificity was at least 95%. Additionally, it was clear that ChIP-seq offers both low analytical complexity and sensitivity that increases with sequencing depth.
As such, "next-generation" genome sequencing technologies provide 1-2 orders of magnitude increase in the amount of sequence that can be cost-effectively generated over older technologies9. ChIP-seq methods therefore directly provide whole-genome coverage for effective profiling of mammalian protein-DNA interactions3.
In 2006, a strong association of variants in the transcription factor 7-like 2 (TCF7L2) gene with type 2 diabetes was discovered10. Other investigators have already independently replicated this finding in different ethnicities and, interestingly, from the first genome wide association studies of type 2 diabetes published in Nature11,12, Science13-15 and elsewhere16,17, the strongest association was indeed with TCF7L2; this is now considered the most significant genetic finding in type 2 diabetes to date18-20. In addition, TCF7L2 has been linked to cancer risk 21,22; indeed, this connection became more obvious when the 8q24 locus revealed by genome wide association studies of a number of cancers, including colorectal carcinomas, was shown to be due to an extreme upstream TCF7L2-binding element driving the transcription of MYC23,24. As such, there is great interest in determining the downstream genes regulated by this key transcription factor.
Based on experience with TCF7L2 as an example of the methodology, this paper outlines how to generate high quality ChIP DNA template. ChIP was carried out in the colorectal carcinoma cell line, HCT116, for subsequent sequencing in order build a high-resolution map of the genes bound by TCF7L225 in an endeavor to yield further insight in to its key role in the pathogenesis of complex traits.
Subscription Required. Please recommend JoVE to your librarian.
Protocol
1. Cross-link Chromatin
- Grow cells in 100x20mm cell culture dishes. The amount of cells can range from 1 to 10 million cells per dish depending on cell type. Approximately 2 million cells is sufficient for one immunoprecipitation.
- Cross-link cells in 1% Formaldehyde for 10 min at room temperature with occasional rocking.
- Quench cross-linking by adding a final concentration of 125 mM Glycine and incubate for 5 min at room temperature.
- Wash cells with 1X Phosphate Buffered Saline (PBS) twice, decant PBS, and then add 0.2 ml of PBS.
- Harvest cells with a plastic cell scraper into a microcentrifuge tube.
- Spin down cells at 2,000 rpm for 5 min at 4 °C.
- Aspirate the supernatant. Resuspend cells in SDS Lysis buffer (1% SDS, 10mM EDTA, 50mM Tris-HCl pH 8.1) for whole cell lysate or keep them as a pellet for nuclear extraction.
- Cells can be saved at -80 °C or one can proceed immediately with sonication.
2. Prepare Nuclei (Proceed to Step 3.5 for Whole Cell Lysate)
- Supplement Cell Lysis Buffer (5 mM PIPES pH 8.0, 85 mM KCl, 0.5% NP-40) with 1X Proteinase Inhibitor each experiment.
- Resuspend thawed cell pellet in approximately 10 times the pellet volume with Cell Lysis Buffer.
- Dounce-homogenize 10 times with pestle then incubate on ice for 10 min.
- Centrifuge sample at 4,000 rpm for 5 min at 4 °C, discard supernatant, and save nuclear pellet.
3. Sonication*
- Warm up SDS Lysis Buffer and supplement amount of buffer to be used with Proteinase Inhibitor.
- Resuspend nuclear pellet in SDS Lysis Buffer (approximately 0.5 ml of buffer per 1-10 million cells)
- Incubate on ice for 10 min.
- Add 0.5 ml aliquots of samples to microcentrifuge tubes.
- Sonicate on wet ice using Misonix sonicator with 30 sec on and 45 sec off at an amplitude setting of 2. Number of cycles for ideal fragment size can be determined by first trying out various cycle numbers (ex. 2, 4, 8, 12, 16, and 20 or more cycles). A different brand of sonicator may be used, however, the conditions will vary. Experimentation with the number of cycles and amount of time on and off must be carried out in order to determine the ideal conditions.
- Collect 20 μl of each sample to check sonication results and to do quantification,. The rest of the sample can be stored at -80 °C.
- Dilute the 20 μl of sample by adding 30 μl of 0.1X TE Buffer.
- Treat sample with 1 μl of RNase A at 37 °C for 1 hr then add 1 μl of Proteinase K and incubate at 62 °C for 2 hr.
- Run 20 μl of the sample on a 2% agarose gel.
- Purify the remaining amount of sample with QIAquick PCR Purification kit then quantify using NanoDrop spectrophotometer.
*For native ChIP, microccocal nuclease digestion may be used alternatively to shear the DNA.
4. Block Agarose Beads*
- If beads are already blocked, proceed to step 5.1.
- Use Protein A or Protein G agarose. For 5 immunoprecipitations (IPs), use 600 μl of 50% bead slurry (300 μl bead pellet)
- To wash the beads, spin them down at 800 rpm for 1 min at 4 °C and discard supernatant. Add slightly more than 2 ml ChIP Dilution Buffer (0.01% SDS, 1.2 mM EDTA, 167 mM NaCl, 1.1% Triton X-100, 16.7 mM Tris-HCl pH 8.1) and mix by slowly inverting the tube 10X. Spin down again at 800 rpm for 1 min at 4 °C and discard supernatant. Repeat the wash 2 more times.
- Block beads by rotating at 4 °C overnight in blocking solution. Refer to Table 1 for the recipe of the blocking solution.
5. Pre-clear Chromatin
- Thaw sonicated chromatin on ice.
- Spin down at 12,000 rpm for 10 min at 4 °C then put on ice right away to remove SDS (white pellet).
- Collect supernatant, discard pellet, and combine samples if necessary.
- Take out the amounts needed for the experiment based on calculations (1-10 ug of chromatin per IP).
- Dilute chromatin 10X in ChIP Dilution Buffer supplemented with proteinase inhibitor.
- Add 100 μl of blocked beads per IP.
- Rotate at 4 °C for 1 hr.
6. Immunoprecipitation
- Spin down samples at 800 rpm for 1 min and transfer the supernatant to a fresh tube.
- Spin down supernatant at 800 rpm for 1 min and transfer to another clean tube.
- Save 20 μl of the supernatant, to serve as the input control, at -20 °C.
- Aliquot the chromatin to the number of IPs to be done in the experiment.
- Add 2 ug of antibody per 1-10 ug of chromatin to each sample.
- Incubate overnight 4 °C with rotation.
- Add 100 μl of blocked beads to each IP sample.
- Incubate for 1 hr at 4 °C with rotation.
- Pellet the beads by spinning down at 800 rpm for 1 min and discard as much of the supernatant as possible.
- Wash beads once with Low Salt Immune Complex wash buffer. Add 1 ml of buffer to each tube; rotate at room temperature for 5-8 min; spin down at 800 rpm for 1 min, then discard supernatant. Repeat wash once with High Salt Immune Complex wash buffer and LiCl Immune Complex wash buffer and twice with TE Buffer for a total of 5 washes (Table 2).
7. Elution
- Thaw input samples from previous day to be processed with the eluants.
- Make Elution Buffer fresh (Table 3).
- Make a master mix of enough Elution Buffer needed for IPs and input control samples plus 1-2 extra samples.
- Add 100 μl Elution Buffer to each IP sample and incubate at room temp for 15 min with rotation.
- Spin down at 800 rpm for 1 min and add supernatant to a fresh tube.
- Add another 100 μl of Elution buffer to each tube of beads and incubate at room temp for 15 min with rotation.
- Vortex for 15 sec after incubation; spin down at 5,000 rpm for 1 min, then combine supernatant with the supernatant from the first elution. (Make sure there are no left over beads in the supernatants. If unsure, spin down supernatant again at 5,000 rpm for 1 min and collect the supernatant in a new tube.
- Add 180 μl of Elution Buffer to the 20 μl of input control samples.
8. Reverse Cross-link
- To the 200 μl of eluants and input controls, add 8 μl of 5 M NaCl.
- Seal tubes with parafilm and incubate in water bath at 65 °C overnight.
9. DNA Purification
- Treat each sample with 1 μl of RNase A for 1 hr at 37 °C.
- Add 4 μl of 0.5 M EDTA, 8 μl 1M Tris-HCl, mix, then add 1 μl of Proteinase K to each sample and incubate at 45 °C for 2 hr.
- Purify the samples using QIAquick PCR Purification kit. The samples can be saved at -20 °C and PCR check can be done on a later date.
*Alternatively, ChIP-grade magnetic beads can be used in place of agarose for the immunoprecipitation portion.
10. PCR check
- For the PCR check, use primers for regions known to be bound by the protein of interest. Also, use primers for non-binding regions as negative controls.
- Mix the reagents for the reaction. Dilute Input sample at 1:100 (Table 3).
- Run reaction. PCR Program:
Step 1: 94 °C 3 min
Step 2: 94 °C 20 sec
59 °C 30 sec
72 °C 30 sec
(Repeat Step 2 for at least 30 cycles)
Step 3: 72 °C 2 min
- Run samples on 1% agarose gel.
- Enrichment can also be determined quantitatively with real-time PCR.
Subscription Required. Please recommend JoVE to your librarian.
Representative Results
Once the chromatin has been sonicated and have been treated with RNase and Proteinase, the samples run on the 2% agarose gel should present a smear with the bulk of the DNA at the desired size. If several different cycles are tested, a gradual decrease in size should be seen as the number of cycles increase (Figure 2).
After completing the immunoprecipitation portion of the protocol the enrichment can either be checked by PCR or real-time PCR. For PCR samples run on an agarose gel there should be bands in the Input and ChIP (using antibody for protein of interest, which is TCF7L2 in this case) sample lanes and nothing or at most, a very faint band (background noise) in the IgG (negative) control lane for the positive binding region. For the negative binding region there should be very faint or no band for the IgG control and ChIP lanes. There should be a band in the Input lane (Figure 3).
Figure 4 shows the same samples examined by real-time PCR. As with the previous figure, there should be a significant fold enrichment of the positive binding region for the ChIP Sample over the IgG control. Also, there should be very little enrichment, if any, seen in the negative binding region.

Figure 1. Flow diagram of ChIP process. Click here to view larger figure.
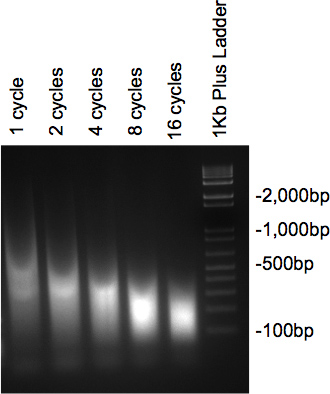
Figure 2. Gel check of DNA sonication.

Figure 3. PCR Check of ChIP.
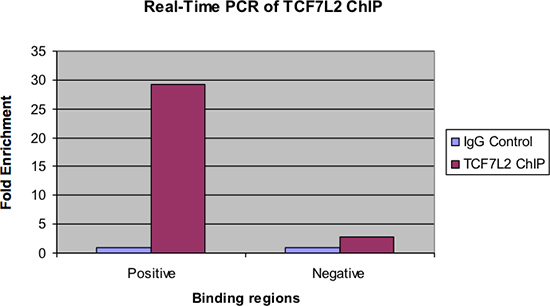
Figure 4. Real-time PCR of TCF7L2 ChIP.
| Reagent | Volume |
| Bead pellet | 300 μl |
| BSA (50 mg/ml) | 30 μl |
| 100X Proteinase Inhibitor | 10 μl |
| ChIP Dilution Buffer | 660 μl |
| Total | 1,000 μl |
Table 1. Recipe for blocking agarose.
| Buffer | Components |
| Low Salt Immune Complex Wash Buffer | 0.1% SDS 1% Triton X-100 2 mM EDTA 20 mM Tris-HCl pH 8.1 150 mM NaCl |
| High Salt Immune Complex Wash Buffer | 0.1% SDS 1% Triton X-100 2 mM EDTA 20 mM Tris-HCl pH 8.1 500 mM NaCl |
| LiCl Immune Complex Wash Buffer | 0.25 M LiCl 1% NP-40 1% Deoxycholate 1 mM EDTA 10 mM Tris-HCl pH 8.1 |
| TE Buffer | 10 mM Tris-HCl pH 8.1 1 mM EDTA pH 8.0 |
Table 2. ChIP wash buffers.
| Reagent | Volume |
| 20% SDS Buffer | 10 μl |
| 1 M NaHCO3 | 20 μl |
| H2O | 170 μl |
Table 3. Elution buffer for one IP.
| Reagent | 50 μl Reaction | 20 μl Reaction |
| Water | 27 μl | 10.8 μl |
| 5X PCR reaction buffer | 10 μl | 4 μl |
| MgCl2 | 4 μl | 1.6 μl |
| dNTP (10 mM) | 1 μl | 0.4 μl |
| Primer mix (5 uM each) | 2 μl | 0.8 μl |
| Taq (Promega Hotstart) | 1 μl | 0.4 μl |
| ChIP DNA | 5 μl | 2 μl |
Table 4. PCR reaction volumes.
Subscription Required. Please recommend JoVE to your librarian.
Discussion
It is now feasible to carry out a genome-wide profile of protein-DNA interactions association using ChIP-seq, as has been very recently demonstrated with other transcription factors2,3. The key to a successful sequencing outcome is the generation of a high quality chromatin immunoprecipitation DNA template.
Once the DNA template has been generated and ascertained to be adequately enriched, one can then take it in library preparation for subsequent sequencing. For example, one can use the sequencing library protocol provided by the vendor, Illumina. The size selection of this library can be performed by gel electrophoresis and subsequent excision and purification of DNA in the ~200- to 700-bp range. Reducing the size and narrowing the size range of DNAs collected from gel purification is intended to improve positional resolution of ChIP-seq. By enriching for smaller pieces of input DNA bound to the factor of interest, one would expect that site location will gain resolution. Tighter size selection also improves the size uniformity of molecular colonies produced on the Illumina platform. Such colony size uniformity also increases the effective read number obtained. Shorter input DNA size also produces more robust colonies on the Illumina platform, and this may mean that shorter DNA pieces within any given input sample distribution will be represented more efficiently in the final sequence output than are longer input pieces from the same distribution.
The bioinformatic approaches to "next-generation" sequence analysis are continuing to evolve, with many vendors making their software open-source for further refinement. One can transform the reads that map to unique genomic locations into a DNA fragment overlap profile. Significant peaks can be identified by threshholding profiles at a height equivalent to an estimated false discovery rate. The position specific frequency matrices derived from this work can be used to identify and localize DNA binding sites across the human genome for a given factor.
But one must be cautious with respect to what factors one wishes to study with ChIP-seq. Before embarking on such a study one should assess if an antibody is available on the market that is usable in the ChIP setting, as a poor antibody can have very detrimental effects on one's experimental outcomes. In addition, one should consider if there are splice isoforms of the protein under study; indeed, TCF7L2 is known to have many isoforms so we were particularly cautious in selecting an antibody that bound to amino acids consistently present in all main isoforms of this transcription factor25.
In summary, the combination of chromatin immunoprecipitation and ultra-high-throughput sequencing (ChIP-seq) can identify and map protein-DNA interactions in a given tissue or cell line. We have outlined how to generate a high quality ChIP template for subsequent sequencing.
Subscription Required. Please recommend JoVE to your librarian.
Disclosures
The authors declare that they have no competing financial interests.
Acknowledgments
The work is supported by an Institute Development Award from The Children's Hospital of Philadelphia.
Materials
| Name | Company | Catalog Number | Comments |
| QIAquick PCR Purification Kit | Qiagen | 28104 | |
| EZ-ChIP Kit | Millipore | 17-371 | |
| GoTaq Hot Start Polymerase | Promega | M5001 | |
| Misonix Sonicator | Qsonica | XL-2000 | |
| NanoDrop 1000 Spectrophotometer | Thermo-Scientific | ||
| Positive control primer sequences (TCF7L2-1) Forward- 5'-TCGCCCTGTCAATAATCTCC-3' Reverse- 5'-GCTCACCTCCTGTATCTTCG-3' Negative control primer sequences (CTRL-1) Forward-5'-ATGTGGTGTGGCTGTGATGGGAAC-3' Reverse- 5'-CGAGCAATCGGTAAATAGGTCTGG-3' |
|||
References
- Odom, D. T., et al. Control of pancreas and liver gene expression by HNF transcription factors. Science. 303, 1378-1381 (2004).
- Johnson, D. S., Mortazavi, A., Myers, R. M., Wold, B. Genome-wide mapping of in vivo protein-DNA interactions. Science. 316, 1497-1502 (2007).
- Robertson, G., et al. Genome-wide profiles of STAT1 DNA association using chromatin immunoprecipitation and massively parallel sequencing. Nature Methods. 4, 651-657 (2007).
- Reich, N. C., Liu, L.
- Lodige, I., et al. Nuclear export determines the cytokine sensitivity of STAT transcription factors. The Journal of Biological Chemistry. 280, 43087-43099 (2005).
- Schroder, K., Sweet, M. J., Hume, D. A. Signal integration between IFNgamma and TLR signalling pathways in macrophages. Immunobiology. 211, 511-524 (2006).
- Vinkemeier, U. Getting the message across, STAT! Design principles of a molecular signaling circuit. The Journal of Cell Biology. 167, 197-201 (2004).
- Brierley, M. M., Fish, E. N.
- Bentley, D. R.
- Grant, S. F., et al. Variant of transcription factor 7-like 2 (TCF7L2) gene confers risk of type 2 diabetes. Nature Genetics. 38, 320-323 (2006).
- Sladek, R., et al. A genome-wide association study identifies novel risk loci for type 2 diabetes. Nature. 445, 881-885 (2007).
- Wellcome Trust Case Control Consortium. Genome-wide association study of 14,000 cases of seven common diseases and 3,000 shared controls. Nature. 447, 661-678 (2007).
- Saxena, R., et al. Genome-wide association analysis identifies loci for type 2 diabetes and triglyceride levels. Science. 316, 1331-1336 (2007).
- Zeggini, E., et al. Replication of genome-wide association signals in UK samples reveals risk loci for type 2 diabetes. Science. 316, 1336-1341 (2007).
- Scott, L. J., et al. A genome-wide association study of type 2 diabetes in Finns detects multiple susceptibility variants. Science. 316, 1341-1345 (2007).
- Steinthorsdottir, V., et al. A variant in CDKAL1 influences insulin response and risk of type 2 diabetes. Nature Genetics. 39, 770-775 (2007).
- Salonen, J. T., et al. Type 2 Diabetes Whole-Genome Association Study in Four Populations: The DiaGen Consortium. American Journal of Human Genetics. 81, 338-345 (2007).
- Zeggini, E., McCarthy, M. I. TCF7L2: the biggest story in diabetes genetics since HLA. Diabetologia. 50, 1-4 (2007).
- Weedon, M. N.
- Hattersley, A. T. Prime suspect: the TCF7L2 gene and type 2 diabetes risk. The Journal of Clinical Investigation. 117, 2077-2079 (2007).
- Yochum, G. S., et al. Serial analysis of chromatin occupancy identifies beta-catenin target genes in colorectal carcinoma cells. Proceedings of the National Academy of Sciences of the United States of America. 104, 3324-3329 (2007).
- Duval, A., Busson-Leconiat, M., Berger, R., Hamelin, R. Assignment of the TCF-4 gene (TCF7L2) to human chromosome band 10q25.3. Cytogenet. Cell Genet. 88, 264-265 (2000).
- Pomerantz, M. M., et al. The 8q24 cancer risk variant rs6983267 shows long-range interaction with MYC in colorectal cancer. Nature Genetics. 41, 882-884 (2009).
- Tuupanen, S., et al. The common colorectal cancer predisposition SNP rs6983267 at chromosome 8q24 confers potential to enhanced Wnt signaling. Nature Genetics. 41, 885-890 (2009).
- Zhao, J., Schug, J., Li, M., Kaestner, K. H., Grant, S. F. Disease-associated loci are significantly over-represented among genes bound by transcription factor 7-like 2 (TCF7L2) in vivo. Diabetologia. 53, 2340-2346 (2010).
- Benjamini, Y., Yekutieli, D. Quantitative trait Loci analysis using the false discovery rate. Genetics. 171, 783-790 (2005).
