Iontophoresis of neural agonists and antagonists during extracellular in vivo recordings is a powerful way to manipulate a neuron’s microenvironment. These manipulations can most easily be done via piggy-back multibarrel electrodes. Here we describe how to manufacture them and use them during auditory recordings.
Method Article
Manufacturing and Using Piggy-back Multibarrel Electrodes for In vivo Pharmacological Manipulations of Neural Responses
In This Article
Summary
Abstract
In vivo recordings from single neurons allow an investigator to examine the firing properties of neurons, for example in response to sensory stimuli. Neurons typically receive multiple excitatory and inhibitory afferent and/or efferent inputs that integrate with each other, and the ultimate measured response properties of the neuron are driven by the neural integrations of these inputs. To study information processing in neural systems, it is necessary to understand the various inputs to a neuron or neural system, and the specific properties of these inputs. A powerful and technically relatively simple method to assess the functional role of certain inputs that a given neuron is receiving is to dynamically and reversibly suppress or eliminate these inputs, and measure the changes in the neuron's output caused by this manipulation. This can be accomplished by pharmacologically altering the neuron's immediate environment with piggy-back multibarrel electrodes. These electrodes consist of a single barrel recording electrode and a multibarrel drug electrode that can carry up to 4 different synaptic agonists or antagonists. The pharmacological agents can be applied iontophoretically at desired times during the experiment, allowing for time-controlled delivery and reversible reconfiguration of synaptic inputs. As such, pharmacological manipulation of the microenvironment represents a powerful and unparalleled method to test specific hypotheses about neural circuit function.
Here we describe how piggy-back electrodes are manufactured, and how they are used during in vivo experiments. The piggy-back system allows an investigator to combine a single barrel recording electrode of any arbitrary property (resistance, tip size, shape etc) with a multibarrel drug electrode. This is a major advantage over standard multi-electrodes, where all barrels have more or less similar shapes and properties. Multibarrel electrodes were first introduced over 40 years ago 1-3, and have undergone a number of design improvements 2,3 until the piggy-back type was introduced in the 1980s 4,5. Here we present a set of important improvements in the laboratory production of piggy-back electrodes that allow for deep brain penetration in intact in vivo animal preparations due to a relatively thin electrode shaft that causes minimal damage. Furthermore these electrodes are characterized by low noise recordings, and have low resistance drug barrels for very effective iontophoresis of the desired pharmacological agents.
Protocol
1. Pull Glass Electrodes
- Pull single barrel electrode. Use single barrel glass capillary with filament and pull tip to a diameter of about 1-2 micrometers, shaft length of 10-12 mm, and corresponding electrode resistance of about 12 MOhm (range 5-20 MOhms) as measured in 0.9% NaCl solution. Lower electrode resistances would result in more background activity and thus more difficulty in isolating unitary activity from individual neurons. For pulling this electrode, use either a horizontal or a vertical puller with either heating filaments or heating coils.
- Pull multibarrel electrode. Due to the much larger diameter of multibarrel glass and the need of even heat distribution around the entire multibarrel, a powerful puller with a larger diameter heating coil, not a heating filament, is needed. A multibarrel pipette has to be inserted in the center of the heating filament with no contact to the heating coil. Note that besides the 5-barrel pipettes described here, 3-barrel or 7-barrel pipettes are commercially available alternatives. Pull glass to a pipette tip of about 10 micrometers total diameter, or less. The tip will be broken to the correct diameter in the next step, so the exact tip size is less critical during the pulling process than the overall shape of the electrode tip, which should be long and relatively thin. Refer to the image in Figure 1C for the desired electrode tip shape. Short and stubby electrode shapes (Figure 1B) will cause a substantial amount of tissue damage when advanced into the brain, while very long and thin electrode shapes (Figure 1A) will bend and thus will make it difficult to break the electrode tip to the correct diameter (see step 2).
2. Modify Electrode Tips
Before the two electrodes can be glued together, they have to be modified. The shaft of the single electrode needs to be bent before it can be attached to the multibarrel to make sure the combined shaft of the finished piggy-back electrode is as thin as possible. Additionally, the tip of the multibarrel electrode has to be broken off in order to ensure low resistance for iontophoresis.
- Bend shaft of a single barrel electrode by about 20 degrees. Use the smallest Bunsen burner flame possible. Typical "small" Bunsen burners from standard lab supply companies create flame sizes that are far too large for this application. To circumvent this problem use the smallest commercial Bunsen burner and secure a syringe needle (~ 18 gauge) to the top of the burner, and seal the connection using dental cement. When operated, the flame should be difficult to see, about 5 mm or less in diameter, and about 8 mm tall. Any air movement in the room will extinguish that flame, so it is a good idea to operate the burner in a closed room, or to use wind shields. Move the single barrel electrode through the flame to bend it by about 20 degrees. Aim to have the burner flame melt the glass at the transition area at about 10 millimeters away from the electrode tip. To avoid melting the tip of the electrode we suggest that the electrode be held at about 45 degrees, tip pointing downward, and move the electrode through the flame relatively quickly.
- Break off the tip of the multibarrel electrode. To ensure visual control while breaking the electrode tip, use a microscope with a minimum 10x objective and 10x oculars. A measuring scale inserted in the ocular will also be needed to measure tip sizes. Attach a piece of plexiglass to the microscope such that the end of the plexiglass can be seen in about one-third to one-half of the field of view of the microscope. In our case, the plexiglass piece is about 25 x 70 mm and 5 mm thick and attached via a screw that can be secured into a custom made thread in the microscope stage. It is important to have a design that allows for the plexiglass moving independently of the slide. Place the multibarrel electrode in a bed of modeling clay on a glass slide, and insert the slide containing the electrode into the microscope stage's slide holder. Using the microscope stage's xy manipulators, gently move the electrode tip against the plexiglass piece, and observe the breaking of the tip through the microscope oculars. Attempt to cleanly break the multibarrel's tip to a cumulative diameter of about 25-35 micrometers. Discard pipettes with tip diameters that broke off too large, or tips with uneven breaks. We discard approximately 30% of our multibarrel electrodes due to undesirable tip shapes.
3. Assemble Piggy-back Electrode
- Position electrodes. Remove plexiglass piece used in step 2.2 from the microscope stage. Secure completed multibarrel electrode into modeling clay on a glass slide, tip pointing slightly upward. Pointing upward will be important for step 3.2, the gluing of the two electrodes. Tips that point up cause the glue to run away from the tip, avoiding gluing the electrode tips. Insert bent single barrel electrode into electrode holder of the custom made micromanipulator (Figure 2). Using visual guidance first and then microscopic guidance, lower the single barrel electrode onto the multibarrel electrode. The single electrode should be lowered directly into the groove that is formed by the arrangement of the 5 barrels, with its tip protruding the tip of the multibarrel tip by about 5-10 micrometers. When lowering the single barrel, closely observe the angle that is formed between the two electrodes. For best outcome avoid any angles in which the tips point apart from each other, but rather attempt to lower the single electrode onto the multi perfectly parallel or even with its tip touching the multibarrel first, forming a VERY slight 'wedge' arrangement. Since the single barrel tip is very flexible, it will bend when the single electrode is lowered a little further after the tip has reached the top surface of the multi barrel electrode, forming a clean composite tip that has a small amount of spring action built in that helps holding the tips together. However, if the angle between single barrel and multibarrel electrode is too steep (too much of a wedge), the spring action will be too high and bend the electrode arrangement downwards.
- Glue electrode shafts together. Glue the shafts of the two electrodes together using cyanoacrylate (superglue). Place a small drop of glue onto the small side of a flat toothpick and touch electrode assembly with the glue drop. Start at the position most distal of the tips and slowly move toothpick with glue drop along electrode shafts towards the electrode tips. Using too much glue, or applying glue too close to the electrode tips will result in gluing the electrode openings, rendering the electrode at least partially nonfunctional.
- Stabilize joint with dental cement. Mix a small amount of dental cement and dental acrylic in a small disposable plastic dish or weigh boat, using a flat toothpick. Wait until cement becomes moldable and apply a small amount to the joint between the two electrodes to stabilize the joint (pink material in Figure 3). Allow about 15 min to dry.
- Remove and store electrode. Carefully remove the completed piggy-back electrode first from the micromanipulator holder, and then detach from the glass slide, and store in a dustproof container.
4. Prepare Electrode Fill Solutions
Prepare electrode fill solutions. Since iontophoresis requires charged molecules, most agents have to be dissolved either in an acidic or alkaline environment (typically at a pH of about 3-4, or a pH of about 8-10, respectively). A number of chemicals that are often used in iontophoresis are listed in Table 1. For agents that are not listed in the table, determine from the pKa value, whether it would be easier to use the molecule in an acidic or an alkaline environment to keep the molecule charged, and dissolve accordingly. For best results, mix all solutions fresh daily.
5. Fill and Prepare Electrodes
Just before using the electrode, back-fill each barrel with its respective drug, using carbon fiber 28 - 34 gauge needles attached to syringes with syringe filters. Fill the 4 outer barrels of the 5-barrel configuration with the drugs of choice, and the center barrel with 3M NaCl as a balancing barrel. Fill the single barrel recording electrode with 3M NaCl as well. Adding a dye to the NaCl solution, such as fast green or phenol red will make it easier to see the electrode tip during placement of the electrode onto the brain surface. Insert the electrode into the electrode holder of the recording setup and insert all wires into the appropriate glass barrels. Use insulated silver wire from which about 1 cm of insulation has been removed at the tip. There should be 5 wires for the multibarrel electrode (4 drug barrels and one balancing barrel), plus the amplifier wire that needs to be inserted into the recording single barrel electrode.
6. Turn on Iontophoresis Pump Modules
Turn on iontophoresis pump modules and test all the barrels. The electrode test function of each pump module will help determine if the electrode barrel is functional. To prevent leakage of the drugs from the barrels when not in use, a retention voltage in the opposite polarity as the molecule charge needs to be applied.
Results
In this experiment, the glycine receptor antagonist strychnine hydrochloride was iontophoretically applied. Blocking glycinergic inhibition typically increases firing in neurons. Figure 4 shows sample data from an auditory neuron whose responses to sinusoidal sound stimuli of increasing intensity delivered to the animal's ears were recorded. This type of an experiment is referred to as the neuron's discharge rate vs intensity function. Louder sounds resulted in higher spike rates (black curve). The initial iontophoresis current used during this experiment was 15 nA. After the current was switched on and the changes in the rate intensity function had stabilized at their new level (dark blue curve), the ejection current was progressively increased to 30, 45, and 60 nA (orange, green, and light blue curves, respectively). In each case, the responses of the neuron over the same range of sound intensities were recorded after the changes in the discharge rate-intensity functions in response to the new ejection current had stabilized. The most appropriate ejection current to use in this example was 45 nA to 60 nA because these levels of current no longer alter differently the neuron's responses. This result suggests that at 45 nA current, all glycine receptors of that neuron had already been blocked by strychnine hydrochloride. Any further increase of the ejection current and releasing even more strychnine did not result in a further change of the neuron's discharge rate-level function. After the completion of the protocol, the ejection current was turned off. The recovery of neural responses back to baseline was achieved after about 25 min (red line). This might take, depending on the type and amount of drug ejected, between several seconds and several tens of minutes.
| Drug | Concentration | pH of a solution | Solvent | Company | Cat. # | Typical Retention Current | Typical Ejection Currents |
| GABA | 500 mM | 3.5-4.0 | dH2O | Sigma | A-2129 | -15 nA | +5 nA to +100 nA |
| Glycine | 100 mM | 3.5-4.0 | dH2O | Sigma | G-7126 | -15 nA | +5 nA to +100 nA |
| Bicuculline Methiodide | 10 mM | 3.0 | 0.165 M NaCl in dH2O | Sigma | B-6889 | -15 nA | +5 nA to +60 nA |
| Strychnine hydrochloride | 10 mM | 3.0 | 0.165 M NaCl in dH2O | Sigma | S-8753 | -15 nA | +5 nA to +80 nA |
| L-Glutamic Acid | 500 mM | 8.0 | dH2O | Sigma | G-1251 | +30 nA | -10 nA to -150 nA |
| L-Aspartic Acid | 500 mM | 8.0 | dH2O | Sigma | A-8949 | +30 nA | -10 nA to -150 nA |
| Kainic Acid | 1 mM | 9.0 | dH2O | Sigma | K-0250 | +30nA | -10nA to -100 nA |
Table 1. Commonly used drugs, with pH for dissolving and concentration. The table lists the most commonly used synaptic agonists and antagonists used with iontophoresis. The pH environment listed accounts for the need to polarize these agents, and the suggested concentration accounts for the variability in effectiveness between different drugs.
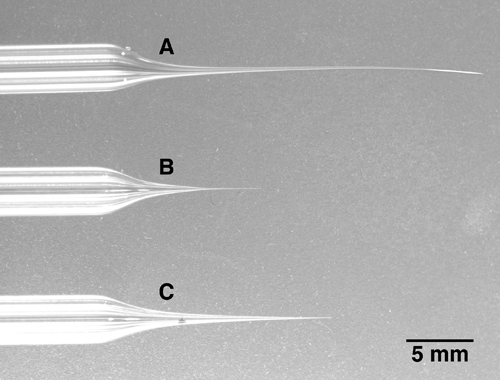
Figure 1. Three multibarrel pipettes with different tip lengths. A: The tip of this 5-barrel electrode has been pulled too long and thin. Note that the tip is bent and very soft. This type of tip is very difficult to break to the desired diameter. B: The tip of this electrode is too short and stubby. When advanced into deeper brain areas, this electrode will cause unnecessary brain damage due to the fact that the electrode becomes relatively thick just a few millimeters after the tip. C: An example of an electrode with a correctly pulled tip. While being long and thin, the tip is still firm and can be broken easily to the desired tip diameter.
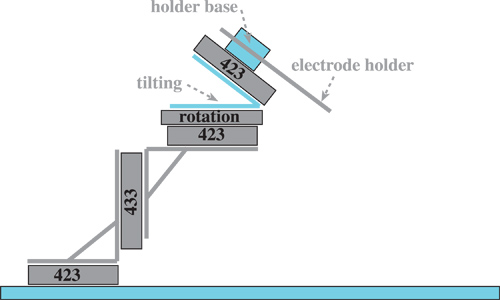
Figure 2. Drawing of electrode manipulator assembly. The manipulator assembly is used together with a microscope to assemble the piggy-back electrodes. Items marked in grey are commercially available products and are listed in Table 2. Items marked in blue were custom machined at our institution's machine shop. They are 1) 1/4 inch steel plate sized 43x26 cm with holes for Newport stage 423 drilled into it according to the hole pattern provided by Newport; 2) a tilting stage that allows for tilting of the assembly at arbitrary angles; 3) a connector that mounts the electrode holder to the top translational stage.
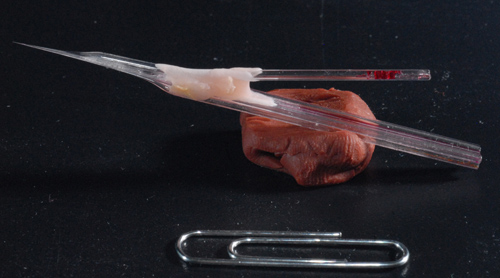
Figure 3. Photo of a sample piggy-back electrode. A finished 5-barrel electrode assembled together with a single-barrel recording electrode. Note long shaft of about 7mm allowing for a deep brain recordings.
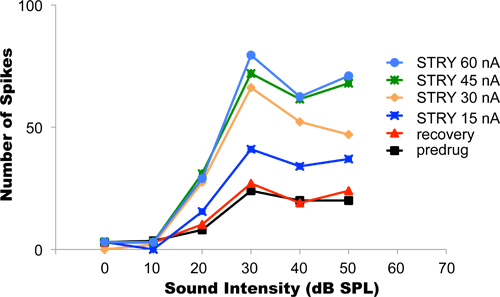
Figure 4. Titration of ejection currents. The graph shows rate-intensity functions recorded from a single auditory neuron while the animal's ears were stimulated with tones of various intensities. Louder sounds tended to elicit higher firing rates. Before drug application, the neuron's rate-intensity function showed the lowest spike rates (black curve). Progressively higher ejection currents blocked progressively more glycine receptors at the neuron, resulting in progressively higher firing rates. The optimal ejection current in this neuron was 45-60 nA. With these ejection currents, complete blockage of all the neuron's glycine receptors was achieved. After completion of the experimental protocol, the iontophoresis was terminated and the neuron was allowed to recover. Complete recovery was achieved when the recovery rate-intensity function matched the initial pre-drug recovery function. Reproduced, with permission from the American Physiological Society, from Klug et al, 1995.
Discussion
We describe a technique that allows for the manipulation of a single neuron's microcircuit in vivo, while at the same time allowing for the recording of the neuron's responses during the experimental manipulation. Neural circuits are manipulated via the iontophoretical application of synaptic agonists and antagonists. The main advantage of iontophoresis over pressure ejection is that iontophoresis does not require the physical movement of fluid from the electrode into neural tissue, and thus there is no concern of causing tissue damage through the applied pressure or fluid volume. The major limitation of this technique is lack of information about the absolute drug concentration in the tissue, and the volume of tissue affected. However, since the amounts of pharmacological agents ejected with iontophoresis are much smaller and much more precisely controllable than with pressure ejection, the recovery from the drug application is typically much faster and much more complete. Microiontophoresis has successfully been used in a number of neural systems, sensory and others, and is applied most successfully in brain areas with little or no intrinsic processing. The reason is that some of the ejected pharmacological agent may diffuse from the application site to a neighboring neuron and also manipulate the response properties of the neighboring neuron.
The separate manufacturing of single and multi barrel electrodes allows for the combination of electrodes with arbitrary and unrelated properties. Pulling electrode barrels together and using some for recording and some for iontophoresis purposes would produce electrode tips with very similar properties, such that the electrode tips would either be too large for single cell recording, or too small for drug application. Also, having the single barrel tip extend beyond the multibarrel electrode tips by about 20 micrometers greatly reduces noise in the recordings, and eliminates possible confounding current effects from the retention or ejection currents on the neuron's firing 3.
Piggy-back multibarrel electrodes have first been described over 30 years ago 4-6 and have been used very successfully to dissect neural circuits 7-18 19-29.Thus, the method per se is not novel or unique . However, the particular details of electrode preparation and use have been modified over the years, and the set of instructions described here has proven to be especially easy and successful, and has not been published in detail elsewhere in the literature. Particularly, the bending of the single barrel electrode tip allows the final tip of the piggy-back electrode to be relatively slim (Figure 3) and thus, allows for recordings from deep nuclei with minimal damage to the brain; the protruding of the single barrel electrode over the multi-barrel electrode removes virtually all current effects, which were often cited as a disadvantage of the technique 3. New details presented here such as having the electrode tip pointing upward during the gluing process and resting the single barrel in the groove of the multibarrel electrode will ensure a high success rate when producing piggy-back electrodes. The technique is relatively easy and can typically be mastered by a novice within a few days.
Disclosures
No conflicts of interest declared.
Acknowledgements
The work was supported by R01 DC 011582 (AK) and RO1 DC011555 (DJT).
Materials
| Name | Company | Catalog Number | Comments |
|---|---|---|---|
| Bunsen burner | 17928-027 | Available from: VWR | |
| Two-component dental cement: "Cold cure" dental material | Co-oral-ite Dental Mfg. Co | 525000 | Available from: A-M Systems, Inc |
| Two-component dental cement: Denture material crosslinking Liquid Compound | Co-oral-ite Dental Mfg. Co | 525000 | Available from: A-M Systems, Inc |
| Liquid glue | Henkel | 01-06849 | Available from: Loctite Super Glue |
| Micro-Iontophoresis Unit: Neurophore BH-2 | Harvard Apparatus | 65-0200 & 65-0203 | Available from: Harvard Apparatus |
| Insulated silver wire | AM-Systems | 785500 | Available from: AM-Systems |
| Horizontal puller | Zeitz DMZ-Universal Puller | NA | Available from: AutoMate Scientific |
| Micro-manipulator pieces: electrode holder | WPI | M3301EH | Available from: WPI |
| Micro-manipulator pieces: linear stage | Newport 423 Series | 423 | Available from: Newport |
| Micro-manipulator pieces: rotation stage | Newport RSP-2 | RSP-2 | Available from: Newport |
| Micro-manipulator pieces: z translation | Newport 433 Series | 433 | Available from: Newport |
| Micro-manipulator pieces: angle bracket 90 ° to assemble z and xy axis | Newport 360-90 | 360-90 | Available from: Newport |
| Micro-manipulator pieces: x translation / linear stage | Newport 423 Series | 423 | Available from: Newport |
| Micro-manipulator pieces: y translation / linear stage | Newport 423 | 423 | Available from: Series Newport |
| Microscope | Leitz Laborlux 11 | ||
| Microscope: objective | Leitz Wetzlar 10x, NA 0.25 | 519760 | |
| Microscope: eypieces | Leitz Wetzlar, Periplan 10x/18 | 519748 | |
| Microscope: stage | Leitz Wetzlar | 513544 | |
| Multibarrel capillary | N/A | 612000 | Available from: A-M systems, Inc |
| Sinlge barrel capillary (GC 150F-10) | Harvard Apparatus | 30-0057 | Available from: Harvard Apparatus |
| Vertical puller | Narishige model PE-2 | ||
| Custom made elements of the Micro-manipulator (marked light blue in Figure 1) | |||
| steel plate | |||
| tilting base | |||
| attachment for electrode holder | |||
| Table 2. Manufacturers and item numbers of all equipment and supplies used in the procedure. |
References
- Curtis, D. R. A method for assembly of "parallel" micro-pipettes. Electroencephalogr. Clin. Neurophysiol. 24, 587-589 (1968).
- Carette, B. A new method of manufacturing multi-barrelled micropipettes with projecting recording barrel. Electroencephalogr. Clin. Neurophysiol. 44, 248-250 (1978).
- Crossman, A. R., Walker, R. J., Woodruff, G. N. Problems associated with iontophoretic studies in the caudate nucleus and substantia nigra. Neuropharmacology. 13, 547-552 (1974).
- Havey, D. C., Caspary, D. M. A simple technique for constructing "piggy-back" multibarrel microelectrodes. Electroencephalogr. Clin. Neurophysiol. 48, 249-251 (1980).
- Verberne, A. J., Owens, N. C., Jackman, G. P. A simple and reliable method for construction of parallel multibarrel microelectrodes. Brain Res. Bull. 36, 107-108 (1995).
- Oliver, A. P. Technical contribution. A simple rapid method for preparing parallel micropipette electrodes. Electroencephalogr. Clin. Neurophysiol. 31, 284-286 (1971).
- Oswald, J. P., Klug, A., Park, T. J. Interaural intensity difference processing in auditory midbrain neurons: effects of a transient early inhibitory input. J. Neurosci. 19, 1149-1163 (1999).
- Park, T. J., Pollak, G. D. GABA shapes a topographic organization of response latency in the mustache bat's inferior colliculus. J. Neurosci. 13, 5172-5187 (1993).
- Park, T. J., Pollak, G. D. GABA shapes sensitivity to interaural intensity disparities in the mustache bat's inferior colliculus: implications for encoding sound location. J. Neurosci. 13, 2050-2067 (1993).
- Peterson, D. C., Nataraj, K., Wenstrup, J. Glycinergic inhibition creates a form of auditory spectral integration in nuclei of the lateral lemniscus. J. Neurophysiol. 102, 1004-1016 (2009).
- Ramsey, L. C. B., Sinha, S. R., Hurley, L. M. 5-HT1A and 5-HT1B receptors differentially modulate rate and timing of auditory responses in the mouse inferior colliculus. Eur. J. Neurosci. 32, 368-379 (2010).
- Wenstrup, J. J., Leroy, S. Spectral Integration in the Inferior Colliculus: Role of Glycinergic Inhibition in Response Facilitation. J. Neurosci. 21, RC124(2001).
- Yang, L., Pollak, G. D. Features of ipsilaterally evoked inhibition in the dorsal nucleus of the lateral lemniscus. Hear. Res. 122, 125-141 (1998).
- Yang, L., Pollak, G. D. GABA and glycine have different effects on monaural response properties in the dorsal nucleus of the lateral lemniscus of the mustache bat. J. Neurophysiol. 71, 2014-2024 (1994).
- Yang, L., Pollak, G. D. The roles of GABAergic and glycinergic inhibition on binaural processing in the dorsal nucleus of the lateral lemniscus of the mustache bat. J. Neurophysiol. 71, 1999-2013 (1994).
- Yang, L., Pollak, G. D., Resler, C. GABAergic circuits sharpen tuning curves and modify response properties in the mustache bat inferior colliculus. J. Neurophysiol. 68, 1760-1774 (1992).
- Faingold, C. L., Gehlbach, G., Caspary, D. M. On the role of GABA as an inhibitory neurotransmitter in inferior colliculus neurons: iontophoretic studies. Brain Res. 500, 302-312 (1989).
- Faingold, C. L., Hoffmann, W. E., Caspary, D. M. Effects of excitant amino acids on acoustic responses of inferior colliculus neurons. Hear. Res. 40, 127-136 (1989).
- Hurley, L., Pollak, G. D. Serotonin shifts first-spike latencies of inferior colliculus neurons. J. Neurosci. 25, 7876-7886 (2005).
- Hurley, L., Pollak, G. D. Serotonin effects on frequency tuning of inferior colliculus neurons. J. Neurophysiol. 85, 828-842 (2001).
- Hurley, L. M., Pollak, G. D. Serotonin differentially modulates responses to tones and frequency-modulated sweeps in the inferior colliculus. J. Neurosci. 19, 8071-8082 (1999).
- Klug, A., Bauer, E. E., Pollak, G. D. Multiple components of ipsilaterally evoked inhibition in the inferior colliculus. J. Neurophysiol. 82, 593-610 (1999).
- Klug, A., Park, T. J., Pollak, G. D. Glycine and GABA influence binaural processing in the inferior colliculus of the mustache bat. J. Neurophysiol. 74, 1701-1713 (1995).
- Moore, M. J., Caspary, D. M. Strychnine blocks binaural inhibition in lateral superior olivary neurons. J. Neurosci. 3, 237-242 (1983).
- Nataraj, K., Wenstrup, J. J. Roles of inhibition in creating complex auditory responses in the inferior colliculus: facilitated combination-sensitive neurons. J. Neurophysiol. 93, 3294-3312 (2005).
- Fukui, I., Burger, R. M., Ohmori, H., Rubel, E. W. GABAergic inhibition sharpens the frequency tuning and enhances phase locking in chicken nucleus magnocellularis neurons. J. Neurosci. 30, 12075-12083 (2010).
- Burger, R., Pollak, G. D. Reversible inactivation of the dorsal nucleus of the lateral lemniscus reveals its role in the processing of multiple sound sources in the inferior colliculus of bats. J. Neurosci. 21, 4830-4843 (2001).
- Burger, R. M., Pollak, G. D. Analysis of the role of inhibition in shaping responses to sinusoidally amplitude-modulated signals in the inferior colliculus. J. Neurophysiol. 80, 1686-1701 (1998).
- Coleman, W. L., Fischl, M. J., Weimann, S. R., Burger, R. M. GABAergic and glycinergic inhibition modulate monaural auditory response properties in the avian superior olivary nucleus. J. Neurophysiol. 105, 2405-2420 (2011).
Reprints and Permissions
