The medial temporal lobe (MTL), a putative area of the highest level of integration of sensory information1, has been a frequent subject of targeted analyses. For example, the hippocampus and the associated parahippocampal areas have been extensively studied in memory research2-5. Also, the role of the amygdala has been frequently emphasized in research examining emotion processing and emotion-cognition interactions6-11. Recently, various MTL regions have also received attention in the emerging field of personality neuroscience, which links the structure and function of these and other brain regions to individual variation in personality traits12. Assessing the anatomy and function of the MTL structures can be important in facilitating diagnosis of degenerative diseases where specific structural and functional anomalies can occur in different MTL structures. For example, in Alzheimer’s disease (AD), significant atrophy of the entorhinal cortex and hippocampus can be observed13,14, and atrophy of the hippocampus can predict the transition from mild cognitive impairment to AD15. Automatic segmentation algorithms have recently become popular for segmenting cortical and subcortical structures, but as with any tool, these programs inevitably encounter errors in some cases. In such instances a researcher should be equipped with both the knowledge and guidelines to recognize the anatomical borders of the MTL structures. The tendency in the extant literature has been to target individual MTL subregions16-21, with many protocols tending to focus on hippocampus16-19.
Unlike most of the available published guidelines for MTL tracing, the present protocol provides a comprehensive set of guidelines that allow for clear localization of all MTL subregions. Tracing guidelines for the following MTL structures are described: the amygdala (AMY), the hippocampus (HC), the perirhinal cortex (PRC), the entorhinal cortex (ERC), and the parahippocampal cortex (PHC). The AMY and the HC are traced first, and are then followed by the parahippocampal gyrus (PHG) structures. Note that the generic term HC is used here to refer to the HC formation, which encompasses the HC proper, the subiculum, and the posterior segment of the uncus22-24. Also, note that the PHG can be divided into two segments, the anterior portion and the posterior portion. Within the anterior portion of the PHG, it can be further divided into the lateral and medial anterior PHG, whose cortical areas correspond to the PRC and the ERC, respectively. The PHC, the cortical area of the posterior portion of the PHG, corresponds to the parahippocampal cortex proper. For simplicity reasons, we will be using the terms PRC and ERC to refer to the lateral and medial anterior PHG, and PHC to refer to the posterior PHG. The segmentation for each structure begins with a rough localization of the anterior and posterior borders, along with other relevant landmarks, which is then followed by the actual tracing performed slice-by-slice in the coronal plane, in an anterior-posterior/rostro-caudal direction. In all cases, the sagittal and axial sections are closely monitored to assist the localization of anatomical boundaries and landmarks.
The need for such tracing guidelines is also illustrated in figures displaying possible differences between the output of automatic and manual segmentation protocols. The advantage of a protocol that describes all of the MTL structures in the current visual format is that variations in the anatomy (e.g., the collateral sulcus [CS] depth) that can affect border definitions can be described in context with the surrounding anatomy (e.g., the PRC and ERC medial and lateral borders vary in location depending on the depth of the CS25). This might not be clear or understandable to an inexperienced tracer or an experienced tracer who only traces single or separate structures, and to our knowledge, such a visually comprehensive guideline does not exist.
The present protocol is an explicit presentation of guidelines used for MTL tracing in a previous investigation identifying differential contributions from MTL subregions to the memory enhancing effect of emotion26, adapted to higher resolution brain images allowed by recent developments in structural magnetic resonance (MR) imaging. The tracing is illustrated on scans obtained from a healthy volunteer (female, aged 24), using a 3T MR scanner. Anatomical images were acquired as 3D MPRAGE (TR = 1,800 msec; TE = 2.26 msec; FOV = 256 x 256 mm; voxel size = 1 x 0.5 x 0.5 mm) with an acquisition angle parallel to AC-PC. If image data is acquired with a different acquisition angle, such as oblique orientation, the data should be regridded to a parallel or perpendicular orientation to AC-PC, such that anatomical landmark descriptions translate appropriately. The images were then translated to NIFTI format and input into segmentation software27 for manual tracing. Scan data used in the current protocol was collected as part of a study that was approved by the Institutional Review Board, and the volunteer provided written consent.
By drawing information from various separate tracing protocols for these structures18-22,25,28-31, as well as from anatomical analyses and atlases23,32-37, the present protocol presents a comprehensive set of guidelines that address inconsistencies in the extant literature. Complemented by the accompanying visual materials, this work is expected to promote clearer understanding of the MTL structures, and stir up interest of future research in adopting manual segmentation, either as a primary method of MTL tracing or as a supplementary method to automatic segmentation. By providing an accurate, intuitive, and convenient guide for understanding the MTL anatomy, this protocol will help researchers identify the location of all MTL subregions, relative to their neighboring structures, even when only some MTL structures are specifically targeted for analyses. This will not only increase localization accuracy but will also help tracers make informed decisions in cases of morphological variation, which is highly likely in the MTL. These guidelines can be applied to research involving structural and/or functional MRI investigations of the MTL, including volumetric analyses and brain anomaly detection, as well as localizing procedures for functional, anatomical, and tractographic analyses, in healthy groups. The present protocol could also be used to inform segmentation of MTL structures for patients (e.g., patients with atrophy), if the major anatomical landmarks are relatively preserved. Tracing clinical subjects’ data can take additional time and effort, depending on the severity of atrophy and/or anatomical changes.
It is important to consider the distinction between gyri and cortices when defining ROI. Anatomically, gyrus here refers to both white matter and grey matter, while cortex refers to grey matter only. Depending on the intended use of the ROI, segmentations might include white matter or exclude it.
We recommend the tracing to be performed sequentially, substructure by substructure, one hemisphere at a time. Certain software packages27 allow for tracing borders outlined on one slice to be pasted onto subsequent slices, a feature that speeds up the process. It is always advisable to reference the opposing hemisphere as needed, in order to check for consistency across the two sides (e.g., in detecting anatomical landmarks). Alternatively, parallel tracing of the same structures within the two hemispheres can also be performed. Regardless of whether the tracing is sequential or parallel, once the process is complete, the tracers should double-check the end-result and make adjustments as needed, referencing both hemispheres and multiple plane views. Depending on the experience of the tracer and the resolution of the imaging data, manual segmentation of the MTL for healthy subject data can take from 8-10 hr or more, in the case of a novice tracer, to 3-4 hr, in the case of an experienced one.

Figure 1. A 3D overview of the MTL, traced using the present protocol. Structures shown here are the AMY (red), the HC (blue), the PRC (yellow), the ERC (pink), and the PHC (green).
1. Amygdala
- Anterior Slices of the AMY
- Identify the first slice of the AMY in which the limen insula initially appears, where the white matter connection between the frontal and temporal lobes is continuous and visible30. In the coronal view, use the angular bundle as the inferolateral border of the AMY.
- Locate the optic chiasm as a landmark for the appearance of the AMY. Use the axial and sagittal views to distinguish the AMY in its early slices from the surrounding uncus. Follow the white matter tract around the AMY in the axial view to exclude the entorhinal area32.
- Moving posteriorly, identify the first slice in which the anterior commissure is continuous throughout both hemispheres20, where the AMY is visible in its typical shape. Trace the AMY counter-clockwise using the entorhinal sulcus as the superomedial border, the imaginary line from the fundus of the semianular sulcus along the white matter to the inferior tip of the AMY as the inferomedial border, the temporal stem as the lateral border, and back to the entorhinal sulcus to complete the tracing31.
- Posterior Slices of the AMY
- Note that at this level, both the AMY and HC are visible in the same slice(s).
- Still in the coronal view, identify the last slice of the AMY where the structure is superior to the medial extension of the temporal horn of lateral ventricle38 (or the alveus if the ventricle is not present) and lateral to the uncinate gyrus, the protuberance of the head of the HC. Check the sagittal and axial views for accurate and consistent tracing.
- Draw an imaginary line from the fundus of the inferior circular sulcus of the insula to the optic tract as the superior border of the AMY31, which also differentiates it from the grey matter of the globus pallidus and the putamen.
- Trace along the semilunar gyrus as the superomedial border and exclude the uncinate gyrus32. Use the inferior horn of the lateral ventricle and the temporal stem for the lateral delineation.
- Consecutive Slices of the AMY in Anterior-posterior Direction
- Systematically trace the AMY slice-by-slice using the relevant guidelines above. At the anterior portion of the AMY, use the same boundaries as for the anterior-most slice; conversely, at the posterior portion of the AMY, use the same boundaries as for the posterior-most slice.
- Continue to employ the axial and sagittal views to help define and further refine the AMY borders.
2. Hippocampus
- Localizing the HC
- Begin tracing the HC when the temporal horn of the lateral ventricle appears along the inferolateral border of the AMY. If the temporal horn of the lateral ventricle is already present on previous slices, note that the onset of the HC is then indicated by the temporal horn of the lateral ventricle enlarging and stretching superolaterally.
- End the tracing of the HC with its last appearance inferomedial to the trigone of the lateral ventricle31. Always utilize the alternative views to help localize the HC and its borders.
- Border Definitions of the HC
- Delineate the lateral HC against the temporal horn. In cases where the temporal horn of the lateral ventricle is not perceivable enough, exclude one row of voxels from the segmentation to denote it.
- Inferiorly, use the angular bundle (or its imaginary extension) to the ventricular cavity to separate the HC from the PHG. Use the alveus along with the fimbria as the superior border. Trace the HC using the same definitions throughout.
- Additionally, include the subiculum into the segmentation such that it medially borders the white matter bundle of the PHG, superiorly aligns with the curve of the uncus, and extends primarily horizontally from the HC39. Tracing posteriorly, maintain these definitions until the calcarine sulcus intervenes.
- Noting Divisions of the HC
- Note that the HC can be divided into three segments: head, body, and tail.
- Use the appearance of the uncal apex to mark the transition from the HC head to the HC body, and the rapid ascending and expansion in size, which typically coincides with the appearance of the crus of the fornix, to signify the appearance of the HC tail23,30,40.
- Pay special attention when tracing the following structures.
- Include the posterior uncus in the segmentation.
- Omit the choroid plexus above the alveus from the segmentation on the coronal slices, although this may not be possible on lower-resolution images.
- Refer to the two alternative views to avoid the inclusion of the tail of the caudate and the pulvinar at the superior aspect of the HC tail.
- Avoid inclusion of the fascicular gyrus by noting its emergence at the level of the crus of the fornix, where initially it is separated from the hippocampal tail by the fasciola cinerea and more posteriorly becomes the grey matter superior to the calcarine sulcus32.

Figure 2. A representative sagittal slice of the MTL traced using the present protocol, showing its actual position in the brain, and the relative positions among its major structures, i.e., the AMY (red), the HC (blue), the PRC (yellow), the ERC (pink), and the PHC (green).
3. Parahippocampal Gyrus
- Noting Divisions of the PHG
- Note that the PHG can be divided into two main segments: the anterior PHG (i.e., the PRC and ERC), and the posterior PHG (i.e., the PHC).
- Note that in the anterior segment, the PRC appears earlier than the ERC, and flanks it laterally through its entire course.
- After the ERC disappears, note that the PRC subsumes its place on the PHG and continues on for 3 mm.
- Beyond this segment, trace the posterior PHG, where the PHC takes over the width of the PHG until its end30.
- Anterior Slices of the PHG
- Define the first slice of the PRC with the appearance of the CS25,34. Before the onset of the ERC, trace the PRC from the medial edge of the lateral bank of the CS to the lateral fundus of the gyrus of Schwalbe, or that of the medial one if two gyri of Schwalbe are present, or the midpoint of the dorsal temporopolar surface in the absence of this gyrus25,34.
- Start to trace the ERC 5 mm anterior to the limen insula35,36.
- Continue tracing the ERC using the fundus of the medial temporopolar sulcus as the superior end35, and the fundus of the semiannular sulcus after the AMY appears, or the point where the imaginary extension of the angular bundle meets the ventricular cavity if the semiannular sulcus is indistinguishable25. Note that it extends inferiorly to meet the ventricular cavity or the pial surface directly.
- The border between the PRC and the ERC may vary from slice to slice.
- When the CS is deep (≥ 1.5 cm), trace the PRC from the medial edge of the medial bank of this sulcus, to the midpoint of its lateral bank25 .
- In cases with a regular CS (depth of 1–1.5 cm), trace the PRC as the area from the midpoint of the medial bank of the collateral sulcus to the medial end of the lateral bank of the sulcus25.
- With a shallow CS (< 1 cm), trace the PRC from the fundus of this sulcus to the midpoint of the crown of the fusiform gyrus25 .
- When the CS is interrupted, usually at the level of the uncal apex, by a small gyrus emerging from its fundus, trace the PRC to the fundus of the lateral sulcus25. Include or exclude white matter according to the goal for the ROI.
- Trace the ERC until 1.5 mm posterior to the uncal apex, or the end of the gyrus intralimbicus37 .
- Extend the tracing of the PRC medially to occupy the place of the ERC after its termination, where the definitions for the latter continue to apply until 4.5 mm posterior to the uncal apex, or the end of the gyrus intralimbicus37. The PRC is then substituted by the PHC25,30.
- Posterior Slices of the PHG
- Start to trace the PHC on the slice posterior to the end of the PRC, until 4 mm posterior to the end of the HC tail32. Alternative definitions from the literature are described in the Discussion section. Again, include or exclude white matter depending on the goal.
- Delineate the PHC using the same method described in the posterior portion of the PRC after the disappearance of the ERC. Also use the white matter of the cingulum as the superior border once it appears. Continue tracing in this fashion until the appearance of the calcarine sulcus, which restricts the PHC superomedially to the inferior edge of the sulcus30.
- Should a mini-sulcus appear before the emergence of the calcarine sulcus, include it in the segmentation, but be cautious in differentiating it from the calcarine sulcus.
Illustration of Possible Differences between Manual and Automatic Segmentation
A 3D model of the manual segmentation for the AMY, HC, PRC, ERC, and PHC is shown in Figure 1, and a sagittal section of the segmentation is shown in Figure 2. For the purpose of illustrating extreme possible differences between manual and automatic tracings, slices of the AMY from a representative subject with erroneous automated segmentation were juxtaposed with manual tracing (see Figure 3 below). While automatic segmentation software was able to recognize the core body of the structures, its segmentation was rather rough, which resulted in underestimation of the AMY volume, compared to manual segmentation.
For illustration purposes, the results of manual tracing in one subject were compared with those obtained from automatic segmentation using an automatic segmentation program41-44; the focus was on the AMY and the HC. The AMY and HC volumes traced by the two methods were also corrected for the intracranial volume (ICV) of the subject (Table 1), using the following two steps: 1) The volumetric statistics of the AMY and HC segmentations: the manual segmentation software automatically calculated the volume statistics for labeled areas. This information was retrieved in “Volume and statistics” in the Segmentation menu when the to-be-examined segmentation along with its greyscale image was input into the software. 2) ICV Calculation: This was accomplished in three steps, using three programs in a standard automatic segmentation software42. An extraction process was used to extract the brain volume from the original image, stripping off non-brain tissue such as the skull. A partial volume extraction process was used to separate cerebrospinal fluid (CSF), the grey matter, and the white matter. Finally, a statistics process was used to sum up the partial volumes to obtain the ICV for the subject.

Figure 3. An extreme example of the possible differences between results of manual tracing (A) and automatic segmentation (B). Shown here is a coronal slice toward the anterior end of the AMY. As is evident from the comparison, automatic segmentation software has only recognized a small portion of the left AMY, while neglecting more than half of the tissue that is identifiable as part of the AMY to an expert human eye; similar underestimation, but to a lesser extent, also occurred in the right AMY.
Although Figure 3 shows an example of extreme mismatch between manual and automated tracing, the possibility for misestimation of volume by automated segmentation still exists45. Such differences are illustrated in Table 1 below, which compares the results of manual and automated tracing of the AMY and HC.
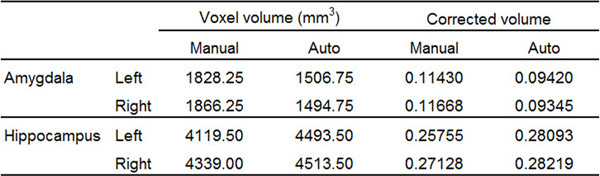
Table 1. Representative volumetric results of the bilateral AMY and the HC of a single subject, from manual tracing using the present protocol and automatic segmentation. Automatic segmentation has misestimated the volume of each of the four structures compared. Corrected volume was calculated as the ratio between Voxel volume and ICV. For this subject, ICV = 1599482.11 mm3.
From these results, it is clear that automatic segmentation software may be capable of providing a reasonable localization of the MTL structures, but that the outcome of its segmentation can be further modified and refined through manual adjustments to meet a higher level of precision.
