A methodology is described herein for representing anatomical imaging data within crystals. We create scaled three-dimensional models of biomedical imaging data for use in Sub-Surface Laser Engraving (SSLE) of crystal glass. This tool offers a useful complement to computational display or three-dimensionally printed models used within clinical or educational settings.
Method Article
Scaled Anatomical Model Creation of Biomedical Tomographic Imaging Data and Associated Labels for Subsequent Sub-surface Laser Engraving (SSLE) of Glass Crystals
* These authors contributed equally
In This Article
Summary
Abstract
Biomedical imaging modalities like computed tomography (CT) and magnetic resonance (MR) provide excellent platforms for collecting three-dimensional data sets of patient or specimen anatomy in clinical or preclinical settings. However, the use of a virtual, on-screen display limits the ability of these tomographic images to fully convey the anatomical information embedded within. One solution is to interface a biomedical imaging data set with 3D printing technology to generate a physical replica. Here we detail a complementary method to visualize tomographic imaging data with a hand-held model: Sub Surface Laser Engraving (SSLE) of crystal glass. SSLE offers several unique benefits including: the facile ability to include anatomical labels, as well as a scale bar; streamlined multipart assembly of complex structures in one medium; high resolution in the X, Y, and Z planes; and semi-transparent shells for visualization of internal anatomical substructures. Here we demonstrate the process of SSLE with CT data sets derived from pre-clinical and clinical sources. This protocol will serve as a powerful and inexpensive new tool with which to visualize complex anatomical structures for scientists and students in a number of educational and research settings.
Introduction
Biomedical imaging modalities like computed tomography (CT) or magnetic resonance imaging (MRI) are routinely used by the medical, research, and academic communities to non-invasively examine the internal structures of human or biological subjects1,2,3. In modern medicine, this technology enables more informed diagnoses and, consequently, improved patient treatment4. In particular, CT provides an excellent opportunity for 3-D reconstruction due to its high resolution and isotropic voxel properties (identical length of each cube edge).5 Further, software packages are available that render biomedical imaging data in three dimensions (3D) for higher-order functions like computer-aided surgery and virtual endoscopy6. Within pre-clinical research, non-destructive imaging provides a translational platform on which to study disease models in mice and rats7. Digital libraries, such as the biological database Digital Morphology (http://digimorph.org), have been populated with CT data derived from different specimens or clinical disease states for ready access by the broader scientific and medical communities8.
At present, biomedical imaging data has been visualized in virtual space on computer screens, or in physical space with hand-held models. While computer software allows users to dissect and manipulate data, physical replicas are a nice complement with excellent educational benefit9,10. Traditional models have been generated using a low-cost casting process in which basic molds are filled with resin that hardens into the desired structure11. Casted models are amenable to inexpensive mass manufacturing, but are limited to basic structures that are not derived from patient data sets. In the past five years, 3D printed replicas of human anatomy have become increasingly prevalent owing to the high complexity, and often times patient-specific, objects that may be generated and displayed. These models are created by machines that deposit liquid or molten plastics in additive layers, and have assisted doctors with diagnoses, complex surgeries, treatment of diseases, prosthetic design, and patient communication12,13. Further, the widespread availability of consumer-grade 3D printers within primary, secondary, and collegiate school settings serves to boost the pedagogical impact of shared anatomical model files14,15.
Overall, 3D printing has considerably advanced the development of anatomical models within medicine, yet it does have limitations. First, the creation of multi-part anatomical models may be challenging since additional work is often required to digitally bind separate pieces together that may otherwise fall apart16. Also, the opacity of many 3D printed materials, especially for consumer-grade machines, prevents the visualization of internal sub-structures that provide additional insight about a specimen's bone and soft tissue. Further, liquid or molten plastic extruders constrain the resolution of 3D prints. The extruders of professional printers are approximately 50 µm in diameter and allow for a layer thickness of 14 µm, with a resolution of up to 600 dots per inch (DPI) in the X and Y axes and 1,600 DPI in the Z axis17,18. In comparison, consumer-grade 3D printers have extruders that are around 400 µm in diameter and give a layer thickness of 100 µm and a resolution roughly equivalent to 42 DPI19,20. Price also varies substantially from consumer-grade to professional printers20,21. Additionally, high material costs prevent industrial mass production from achieving economies of scale22.
Sub Surface Laser Engraving (SSLE), or 3D crystal engraving, utilizes a laser beam to form small "bubbles" or dots with high precision at thousands of X, Y, Z coordinates within a rigid, high purity, cubic, glass matrix23. Each dot is 20-40 µm, which yields resolution between 800-1,200 DPI24. Further each dot is semitransparent, enabling the visualization of internal sub-structures. Multiple, disconnected parts are represented in the same crystal and additional material is not required for large, intricate structures. Since the matrix is solid, anatomical labels and size scale bars may be added to enhance the educational potential of the imaging data displayed within. Here we present a process in which X-ray computed tomography (CT) data are formatted for crystal SSLE. First, the data may be collected from commercial preclinical microCT systems, clinical scanners from radiology departments/unis, or sourced from online repositories like the National Biomedical Imaging Archive (https://imaging.nci.nih.gov/ncia/login.jsf)25 Here we demonstrate this approach with sheep bone core, fractured wrist, labeled foot, and labeled leg crystals to illustrate the capacity to incorporate both preclinical and clinical data, adjust the scale of anatomical structures, and coordinate a structure's geometry with crystal size. Given the facile nature of SSLE and already widespread use of STL files in 3D printing, the fabrication of labeled anatomical crystals provides an exciting, hand-hand held visualization tool for use within the academic and education communities.
Protocol
All human computed tomography data sets were anonymized according to approved SJRMC protocol.
1. CT Data Acquisition of Pre-clinical and Clinical Samples
- Conduct micro X-ray computed tomography to generate a pre-clinical data set. In the present case, use a microCT to image a bone core specimen with the following settings: 45 kV, 0.4 mA, and 1,000 projections.5
- Reconstruct raw data at high resolution (125 µm isotropic voxel). To further increase resolution, identify and reconstruct a 1 cm cube with a center at the volume's origin (10 µm isotropic voxel).
- Export the reconstructed data set in DICOM format for additional processing.
- Alternatively, acquire reconstructed CT data sets, such as those of the broken wrist and foot used in this study, from clinical collaborators (data shown here acquired from Saint Joseph Regional Medical Center) or open-source DICOM archives (http://www.osirix-viewer.com/datasets/).
- Import files into the DICOM imaging software and export as decompressed DICOM files if necessary.
2. Data Processing
- Open each DICOM data set (comprised of all image slices) using the 'Load DICOM' in the 'View' setting of the image processing software.
- Save each data set as a NIfTI analyze, an established imaging format for scientific analysis. Import the NIfTI files into a program with established use in medical imaging computed and automated segmentation for the generation of surface maps (e.g., 3DSlicer).
- Upload a given NIfTI file into the surface map generator program with the 'Add Data' tool.
- Select the 'Grayscale Model Maker' tool with the specification "Create and Rename new model". Set lower threshold values to approximately 300 HU for the segmentation of bone.
- Save grayscale models as STL files for further data processing.
- Import each surface map into the 3D data preparation software (e.g., Netfabb Studio Basic) and select 'Repair' mode.
- Use the 'Select Part' and 'Delete' tools to delete all surfaces that do not represent the structure of interest.
- Use the 'Add Triangle' tool to partially cover the holes in surfaces and the 'Automatic Repair' script to completely close remaining gaps.
- Select the 'Repair Degenerate Faces' script in the action menu to resolve edges without surface area and the 'Apply Repair' script to exit 'Repair' mode with the modified part.
- Use the 'Cut' tool to remove unwanted features or reduce the size of the model. Designate the location of each cut within the 'X', 'Y', or 'Z' plane in the 'Cut' menu of the context area.
- Use the 'Execute Cut' tool and choose 'Triangulate Cut' in the settings to automatically close all resulting holes.
- Use the 'Select Part' and 'Delete' tools simultaneously to delete all surfaces resulting from the cut that do not represent the structure of interest.
NOTE: If the surface map is going to be adjoined with a scale bar, skip the following step. The anatomical feature and scale bar will be scaled simultaneously after they are united in a single STL. - Select the 'Scale' option to modify the dimensions of each surface map. Models may be dilated (bone core) or reduced in dimension (foot), or maintained at original size (wrist) to fit within an 8 cm cube or 5 cm x 5 cm x 8 cm rectangular prism. Note that files at this stage may be sent for SSLE if no labels or scale bars are desired.
3. Anatomical Labeling
- Select the 'New' option in the menu of the CAD program (e.g., Autodesk Inventor Professional) to create a new workbook using the metric template for a 'Standard (mm).ipt' part.
- Select the 'Create 2D Sketch' option and choose any plane. Use the 'Text' tool in the 'Draw' menu of the toolbar to produce typed anatomical labels with the desired font and size (Times New Roman and 2.0 mm).
- When finished, select the 'Finish Sketch' option in the 'Exit' menu of the toolbar.
- Select the 'Extrude' tool from the 'Create' menu of the toolbar with the option '2D Text'. Designate an extrusion depth (2.0 mm) with the symmetric setting.
- Export text labels in CAD format with the 'Save As Type' STL setting.
- Open a new workbook for the production of a cylindrical label line. Select the 'File' option to create a new metric template with a 'Standard (mm).ipt' part.
- Select the 'Create 2D Sketch' tool and choose any plane. Use the 'Center Point Circle' tool in the 'Draw' menu of the toolbar to produce a circle with a center at the origin.
- Use the 'Dimension' tool in the 'Constraint' menu to set the diameter of the circle (1.0 mm).
- When finished, select the 'Finish Sketch' option in the 'Exit' menu of the toolbar.
- Select the 'Extrude' tool chosen from the 'Create' menu of the toolbar with the option '2D text'. Select an extrusion depth (10.00 mm) with the symmetric setting.
- Export text labels and cylinders in CAD format with the 'Save as Type' .stl setting.
4. Attachment of Labels
- Import models, text labels, and cylindrical label lines into the 3D data preparation software.
- Translate text labels to the left or right of the associated anatomy using the 'Move Part' tool. Use the 'Rotate Part' tool to orient labels such that they face the same direction.
- Translate and rotate cylindrical label lines using the 'Move Part' and 'Rotate Part' tools to connect labels to associated structures within the model.
- If necessary, enter 'Repair' mode and use the 'Select Triangles' and 'Remove Selected Triangles' to reduce the size of cylinders to the appropriate length.
- If using the basic version, select all parts and save as a project. Then reopen this project in the professional version.
- In the professional version, select all parts and export as a single STL.
5. Scale Bar Design
NOTE: Two types of scale bars are designed in the CAD program. The first is present in Figure 1 and involves three separate scale bars, with tick marks at distinct measurements, lying on each plane. The second, included in Figure 2, Figure 3, & Figure 4, is composed of perpendicular lines lying on the three axes and converging at a corner. Follow steps 5.1-5.2 to begin designing each scale bar.
- Create a new workbook in the CAD program by selecting 'New' and 'Standard (mm).ipt' part.
- Select 'Create 2D Sketch' and choose any of the three planes to begin working on.
NOTE: Continue with steps 5.3-5.16 to produce the first type of scale bar. The dimensions provided were implemented for the creation of a 1 cm scale bar with tick marks at 25 mm increments. - Use the 'Rectangle' and 'Dimension' tools to draw a rectangle (10 mm x 0.25 mm) with a width that corresponds to the desired length of the scale bar (10 mm) and a length of any reasonable value (0.25 mm). Place the lower left vertex on the origin so x-coordinates can be used for the spacing of tick marks.
- To create the tick marks, utilize the 'Rectangle' tool to draw a rectangle directly above the scale bar. Constrain the size (0.025 mm x 0.432 mm) with the 'Dimension' tool.
- Using the x-coordinates, translate the newly formed rectangle so it lies at the desired distance from the edge. This is the top of the tick mark.
- To create the bottom of the tick mark, draw another rectangle, with the same dimensions as the top half, directly below the scale bar. Use the 'Align' tool to align the two halves of the tick mark.
- Choose the 'Trim' tool in the 'Modify' menu and select the area where the scale bar and tick marks overlap. This will remove excess lines and allow the part to be interpreted as a single feature when extruded.
- Repeat steps 5.4-5.7 for the rest of the tick marks.
- When finished, select the 'Finish Sketch' option in the 'Exit' menu of the toolbar.
- Choose 'Extrude' under the 'Create' menu and select the scale bar. Determine an extrusion distance and direction (0.25 mm and into the screen).
- To design labels for the tick marks, choose 'Create 2D Sketch' and select the scale bar as the working plane.
- Under the 'Draw' menu, select the 'Text' tool to create text with a certain font and size (Times New Roman and 0.25 mm). Translate the text to its desired position next to the scale bar.
- When finished, select the 'Finish Sketch' option in the 'Exit' menu of the toolbar.
- Select the 'Extrude' tool from the 'Create' menu of the toolbar with the option '2D Text'. Designate an extrusion depth (0.25 mm) and direction (into the screen).
- Repeat steps 5.12-5.14 to create the other labels.
- Export the completed scale bar in CAD format with the 'Save As Type' .stl setting.
NOTE: After finishing steps 5.1-5.16, continue with steps 5.17-5.31 to create the second type of scale bar. The measurements provided were utilized to create a scale bar that was 2 cm on each axis and 2 mm thick. - Select the 'Rectangle' tool to create a square and constrain the length and width (2 mm x 2 mm) with the 'Dimension' tool. The dimensions selected in this step will determine the thickness of the part.
- Select 'Finish Sketch' to return to the 3D Model setting.
- Under 'Create', choose 'Extrude' and select the square drawn in 2D Sketch mode. Choose the desired extrusion depth and direction (20 mm and into the screen).
- Select 'Create 2D Sketch' and continue working on the same plane as the previous sketch.
- Use the 'Rectangle' and 'Dimension' tools to draw a rectangle (2 mm x 18 mm) directly above the square. Match the length of the rectangle to the length of the square (2 mm) and the width should be the desired size of the scale bar minus the width of the square (20 mm - 2 mm = 18 mm). Press 'Finish Sketch' when completed.
- Under 'Create', choose 'Extrude' and select the rectangle. Enter an extrusion depth, which should be the length of the square (2 mm), and select a direction (into the screen).
- Rotate the part so that it looks like the letter 'L'. Create a new 2D sketch and select the front of the 'L' as the working plane.
- Draw a square at the corner of the two rectangles using the 'Rectangle' tool. Constrain the dimensions (2 mm x 2 mm) so that it fits exactly in the corner. Exit the sketch with the 'Finish Sketch' tool.
- Under 'Create,', choose 'Extrude' and select the newly created square. Enter an extrusion distance, which should be the desired size of the scale bar minus the width of the square (20 mm - 2 mm = 18 mm). Choose a direction (out of the screen) and apply the extrusion.
- To add text indicating the dimensions of the scale bar, create a new 2D sketch off of any plane.
- Use the 'Text' tool in the 'Draw' menu of the toolbar to produce a label with the desired font and size (Times New Roman and 2.5 mm).
- Translate the text to its desired position next to the scale bar. Exit sketch mode by selecting 'Finish Sketch'.
- Utilize the 'Extrude' tool and enter an extrusion distance that matches the thickness of the scale bar (2 mm) and direction that aligns the label with the scale bar (into the screen).
- Repeat steps 5.26-5.30 using the other planes to create labels for all three axes.
- When finished, export the scale bar and its accompanying labels in CAD format with the 'Save as Type' .stl setting.
6. Addition of Scale Bars to Anatomical Models
- Open the anatomical model in the 3D data preparation software and import the scale bar.
- Use the 'Move Part' and 'Rotate Part' tools to orient the scale bar next to the anatomical model.
- If the first type of scale bar was created, import the part two more times. Translate and rotate the individual scale bars so one lies on each axis.
- If using the basic version, select all parts and save as a project.
- Open the file in the professional version. Select all parts and export as a single STL.
NOTE: Dimensions are retained when surface maps and scale bars are imported into the basic or professional version. Prior to engraving, surface maps, along with associated labels and scale bars, are scaled to fit inside the crystals. Since scale bars are scaled at the same rate as models, alterations in the sizes of scale bars are representative of dimension changes in the anatomical structures.
7. Reduction of Faces
- Utilize the 'Import Mesh' tool to add an .STL file in the 3D mesh-processing program. Adjustments will be applied to the surface model and all components, including text and scale bars, since the software interprets the mesh as one part.
- Under 'Filters' and 'Remeshing, Simplification and Reconstruction,' select the 'Quadratic Edge Collapse Decimation' tool to reduce the number of faces present within the mesh.
- Enter the desired number of faces (100,000) under the 'Target number of faces' and select 'Apply.' This operation is done to create a manageable file size for the SSLE software, and prevent excess engraving times.
- Export the finished product as an STL using the 'Export Mesh As…' setting.
8. Model Engraving in Crystal
NOTE: Completed STL files are forwarded to an industrial collaborator, where glass crystals are laser engraved to produce physical models of the anatomical data. For inquiries and further assistance, please contact the industry authors of this manuscript.
- Open the STL file into a laser engraving software program and convert to a SCAX file.
- Import the SCAX file in a software package connected to the 3D laser engraving machine.
- Define a crystal size appropriate for interfacing with the SCAX file.
- Set the power of the laser and enter a voltage and density. While 8.5 V and 0.2 are typically selected for voltage and density, other measurements can be determined by reducing the voltage and increasing the density, making sure that the crystal does not crack or break.
- Send the file to a 3D laser engraver for crystal production.
Results
Sub-surface laser engraving of glass crystals is a profound means to visualize numerous types of biomedical tomographic imaging data. Figure 1 incorporates preclinical CT data, while Figure 2, Figure 3, & Figure 4 demonstrate how clinical CT scans can also be utilized. Since dimensions are modified prior to engraving, structures of varying sizes can be represented through laser engraving. While Figure 2 exemplifies how anatomies can be printed to scale, most structures need to be scaled up or down. Two types of scale bars can be implemented to measure dimension changes: one that spans the sides of the structure and another with the three axes converging at a corner. The first type is ideal for dilated structures, such as the bone core, while the second type is best suited for to-scale or reduced structures. Further the size of the crystal is paired with the shape of the anatomical structure. As a result, the foot was placed in a cube while the leg was suspended in a rectangular prism.
A key feature of sub-surface engraving is the ability to attach text labels to anatomical features. The technique can be applied to various types of imaging data, with optimal label placement depending on the geometry of the structure. In Figure 2, the text was placed on two planes to space the labels out and avoid obstructing the view of the anatomy. For Figure 3 & Figure 4, bones could be clearly viewed from one side so the labels were placed on a single plane.
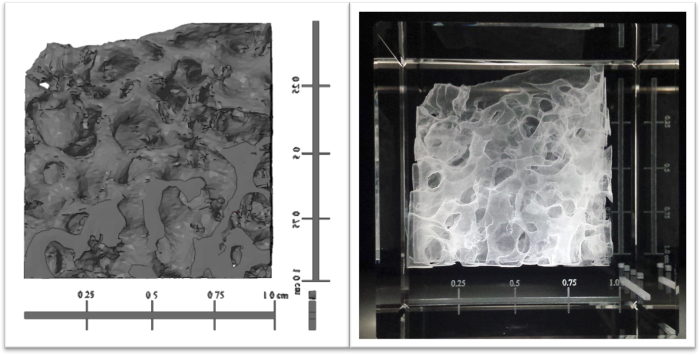
Figure 1. Pre-clinical CT data of a sheep bone core set, displayed virtually and suspended in a 3D engraved crystal. Imaging software was utilized to generate and attach scale bars to a surface map of a 1 cm isotopic sheep bone (left). The structure underwent a five-fold increase in dimension along each axis, as indicated by the scale bars, and was laser engraved in an 8 cm square crystal (right). Please click here to view a larger version of this figure.
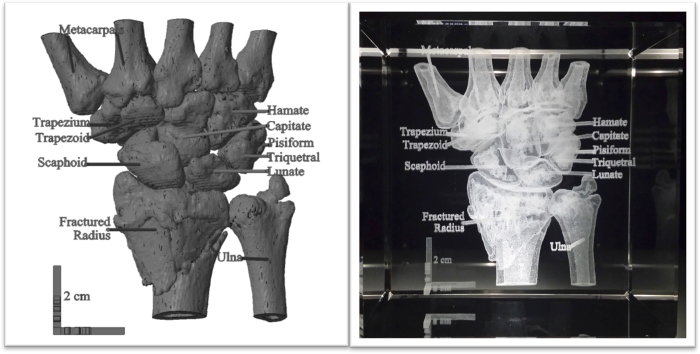
Figure 2. Clinical CT data of a broken wrist with anatomical labels, displayed virtually and engraved in crystal. A clinical CT data set of a human wrist with a broken radius was converted into a surface map through computer software. Anatomical labels and a 2 cm scale bar were generated using computer-aided design (CAD) and attached to the model (left). A 3D laser engraver inscribed the structure in an 8 cm cube crystal (right). The scale bar retained its size, demonstrating the wrist was produced to scale. Please click here to view a larger version of this figure.
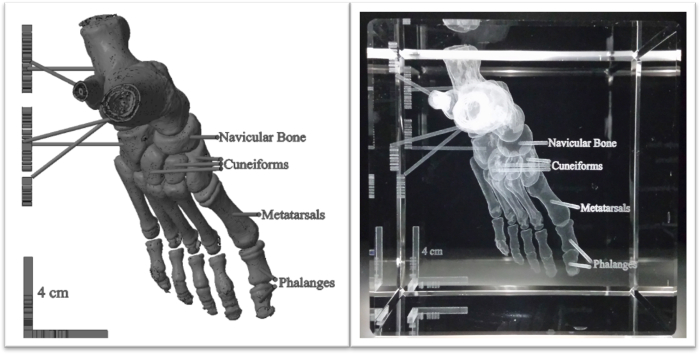
Figure 3. Anatomically labeled human foot with anatomical labels, displayed virtually and engraved in crystal. A CT data set of a human foot was converted into a grayscale model with imaging software. Text and a 4 cm scale bar were created using CAD and incorporated with the surface map (left). The model was reduced to half its size and laser engraved in an 8 cm crystal cube (right). Please click here to view a larger version of this figure.
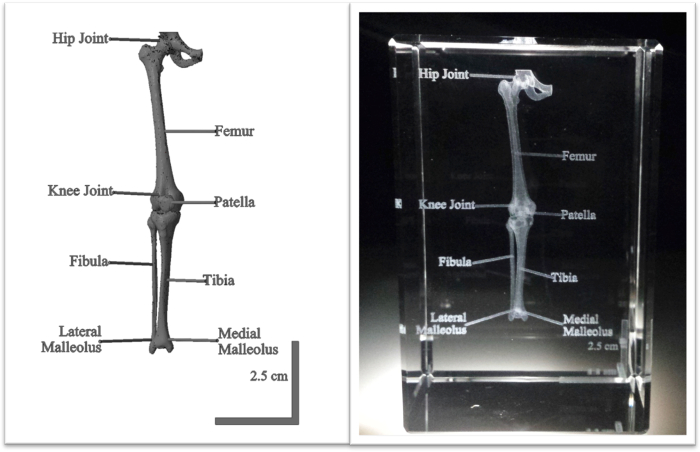
Figure 4. Clinical CT data set of a human leg anatomically labeled using computer software and engraved in crystal. Software packages were utilized to prepare a surface map from a full human CT scan and to section the leg from the rest of the body. Anatomical labels and a 2.5 cm scale bar designed with CAD were attached (left) and the structure was engraved in a 5 cm x 5 cm x 8 cm crystal (right). The scale bar in the crystal illustrates the leg was scaled down in a 5:3 ratio. Please click here to view a larger version of this figure.
| 3D Printing | Sub-Surface Laser Engraving (SSLE) of Crystals | |
| Advantages | Tactile experience | Creation of structures in free space |
| Full color models | Generation of multi-part models | |
| To-scale representation possible with larger variety of structures | Attachment of anatomical labels | |
| Solid plastic material resistant to drops | Scale bars suspended within model | |
| Inexpensive consumer-grade printers available | High resolution and accuracy | |
| High resolution of professional-grade printers | Short production time | |
| Easy to link separate anatomical subunits together in 3D space | ||
| Structures within crystal not susceptible to outside damage | ||
| Low material costs | ||
| Laser engravers moderately priced | ||
| Disadvantages | Difficult to link separate anatomical subunits in 3D space | No tactile experience |
| Cost and production time vary with complexity | Grayscale | |
| More susceptible to production errors | Size limited by crystal | |
| Post-production washes may be necessary | To-scale representation difficult | |
| Resolution limited by plastic extruders | Density constrained by laser | |
| Parts may chip off of model | Crystals may chip or break when dropped | |
| Costly professional grade printers | ||
| Prices of materials vary greatly |
Table 1. Advantages and disadvantages of 3D printing and SSLE for the production of anatomical models. 3D printing and SSLE are two means for visualizing biomedical tomographic imaging data, and each possesses a number of strengths and weaknesses in regards to the creation of physical models of the data.
Discussion
Preclinical and clinical data sets acquired through biomedical imaging modalities have been instrumental in modern research and medical advancements. Prior means of biomedical data visualization included computer display and physical models generated from traditional casting or modern 3D printing approaches. Here we describe a 3D crystal engraving method as an alternative means for visualizing tomographic biomedical data since it generates well-defined, labeled models in a straightforward fashion. These relatively inexpensive models may be widely used as educational tools. The utilization of crystal engraving to accurately represent anatomical data gives it high potential in clinical and educational settings. The ability to visualize data in a physical, three-dimensional format overcomes the limitations of traditional forms of education using flat images or virtual renderings9. High resolution of engraved structures and the attachment of labels to specific visible features facilitate the use of these models for patient or student education. In addition, this modality offers the ability to identify and observe causes and aspects of disease states within a specimen. For example, the classification and location of a bone fracture, like the fractured wrist noted in Figure 2, provides a more comprehensive understanding of the relation of disease states and other physically apparent signs and/or patient symptoms.
Through 3D crystal engraving, preclinical and clinical CT data sets were represented as physical structures inscribed within crystals. Preclinical CT data were acquired using a microCT scanner, while clinical CT images were gathered from clinical radiological sources. Before further processing, clinical imaging data is converted to decompressed DICOM files via imaging software. Subsequent software programs transform reconstructed DICOM files into surface maps. Modification of these surface maps and generation of anatomical labels and scale bars are accomplished with data preparation software and computer-aided design (CAD). Completed STL files are reduced and converted to SCAX files. After the crystal size and laser power are set, files are read by a 3D laser engraving machine that creates the free-form anatomical structures in crystal.
The process described above can be applied to various clinical and preclinical data sets. While CT datasets were implemented in this project, it is possible that data obtained from other imaging modalities can be visualized in crystal, including 3D ultrasound (US), Magnetic Resonance Imaging (MRI), and Positron Emission Tomography (PET). Also, other human anatomical structures and biological specimens may be imaged and represented in this medium. However, the crystals come in predetermined sizes and structures will need to be cut or scaled accordingly. It is advisable to match the geometry of the anatomical part with the size of the crystal. For example, a leg best fits in a 5 cm x 5 cm x 8 cm rectangular solid (Figure 4), while a foot is suited for an 8 cm cube (Figure 3). Changes to the size, font, and thickness of text can be carried out in CAD software. Additionally, it is best to place labels on one or two planes in order to clearly read labels without obstructing the view of the anatomy when rotating the crystal to other faces.
Two additional factors must be considered when performing SSLE of anatomical data: the number of faces within a surface map, and the size of each point that is laser engraved into the crystal. These factors affect the number and size of the points that will absorb incident light and thus potentially enhance or detract from a given SSLE visualization. First, the number of faces, which is directly proportional to the number of points in 3D space, will influence both the overall resolution and "brightness/contrast" of the displayed model. In each of the examples presented herein, the completed STL file was reduced to 100,000 faces without apparent degradation of the resulting crystal product, regardless of size or magnification. The overall brightness/contrast was also acceptable using this approach. The 100,000 value is the safe range for the engraver used as not to overtax the software and hardware. However, in some cases, additional faces may be needed to properly display a given data set, and these files may be considered experimental until successfully completed. In addition, the size of each point that is "burned" into the crystal may be tuned via the voltage and "density" input values of the engraver to enhance the output brightness contrast. In the present cases, default values of Voltage: 8.5 and Density: 0.2 were selected. While these values represent a starting point, they may be altered in a trial and error fashion to improve data visualization as needed.
There are a number of advantages of utilizing 3D crystal engraving for the display of preclinical and clinical imaging data. Crystals are typically produced in under 30 minutes, while 3D printed structures may require several hours, depending on their size and complexity16,20,22. Laser engraving may be used to represent suspended structures without the use of support, facilitating the production of intricate or hanging features of the anatomy without reducing accuracy with additional material16. With a resolution of 800-1,200 DPI and an accuracy of less than 10 µm, these models closely resemble medical data24. While professional-grade 3D printers have a similar resolution of roughly 600 DPI in the XY and 1,600 DPI in the Z, they are generally less accurate (20-200 µm)17,19,20 (Table 1).
3D crystal engraving possesses strong potential but is limited in a few areas. Since data is engraved inside crystal, users cannot have a tactile experience with the anatomical parts. To-scale representations are difficult to produce as data is typically scaled up or down to fit in the crystals. Furthermore, the laser can only engrave in grayscale with minimal contrast. The density of the structure is also constrained by the laser's ability to process the data. The overall stability of crystals is an advantage to potential use over several years, but the solid glass may not withstand dropping on hard surfaces (Table 1).
Despite these limitations, 3D crystal engraving holds significant value as a medium for the visualization of biomedical data. While starting material and support need to be taken into account with 3D printers, these aspects do not need to be considered for laser engraving. More complex parts, such as the human foot, can be represented as a result. While production time increases slightly with more intricate structures, no additional material is required and the cost of the model remains the same. The laser's ability to burn glass in a dot-by-dot fashion produces highly defined structures that display the fine details of biomedical data, as noted in the broken radius in Figure 2. Additionally, the placement of these structures inside crystals makes them resistant to outside damage. Unlike solid plastics utilized on many 3D printing platforms, the translucent glass surfaces allow internal structures to be visualized in a straightforward fashion. One of the most powerful tools of 3D crystal engraving is its capability to label individual parts, and also add a scale bar for size reference. This technique adds substantial educational value to the crystals as students of all levels can learn anatomy and interact with clinical data, two valuable components of biological and medical education, in one model. Combined with the ability to hold them in the palm of a hand and view structures at a variety of angles, labeling greatly enhances the educational value of these models. As a result, 3D engraved crystals have wide applicability for use in anatomy courses, clinical practice, and general education.
Disclosures
The authors have nothing to disclose.
Acknowledgements
We thank the College of Science Summer Undergraduate Research Fellowship (SURF) for their financial support of this project. The authors also thank Prof. Glen Niebur, University of Notre Dame, for providing bone samples (detailed above) used in this study.
Materials
| Name | Company | Catalog Number | Comments |
|---|---|---|---|
| 3D Laser Engraving Machine | Wuhan Synpny Laser Co., Ltd. | STNP-801AB4 | 3D Laser Engraver |
| 3D Slicer | Slicer | Version 4.3.1 | Surface Map Generator Program |
| Albira micro CT | Bruker Corporation | Alternatively, a PET/SPECT/CT scanner can be utilized | |
| Autodesk Inventor Professional 2013 | Autodesk, Inc. | 64bit edition, 2013 RTM, Build 138 | CAD program |
| Clinical CT data sets | Saint Joseph Regional Medical Center | ||
| MeshLab | Institute of the National Research Council of Italy (ISTI-CNR) | Volume 1.3.4 BETA | 3D Mesh Processing Program |
| Netfabb Studio Basic | netfabb GmbH | Version 4.9.0 | 3D Data Prepartion Software |
| Netfabb Studio Professional | netfabb GmbH | Version 5.2.1 64bit | 3D Data Prepartion Software-Professional |
| OsiriX Lite Imaging Software | Pixmeo | Version 7.0.3 | DICOM Imaging Software |
| PMOD | PMOD Technologies LLC | Version 3.306 | Image Processing Software |
References
- Edelman, R., Warach, S. Magnetic Resonance Imaging. N. Engl. J. Med. 328 (10), 708-716 (1993).
- Momose, A., Takeda, T., Itai, Y., Hirano, K. Phase-contrast X-ray computed tomography for observing biological soft tissues. Nat. Med. 2 (4), 473-475 (1996).
- Paulus, M., Gleason, S., Kennel, S., Hunsicker, P., Johnson, D. High Resolution X-ray Computed Tomography: An Emerging Tool for Small Animal Cancer Research. Neoplasia. 2 (1), 62-70 (2000).
- Robb, R. 3D visualization in biomedical applications. Annu. Rev. Biomed. Eng. 1 (1), 377-399 (1999).
- Hsieh, J. Chapter 12, Section 1, Advanced CT Applications. Computed Tomography: Principles, Design, Artifacts, and Recent Advances. , 2nd ed, (2009).
- Robb, R. The biomedical imaging resource at Mayo Clinic. IEEE Trans. Med. Imaging. 20 (9), 854-867 (2001).
- Davison, C., et al. Multimodal Optical, X-Ray CT, and SPECT Imaging of a Mouse Model of Breast Cancer Lung Metastasis. Curr. Mol. Med. 13 (3), 368-376 (2013).
- Digital Morphology. , Available from: http://www.digimorph.org (2016).
- Preece, D., Williams, S., Lam, R., Weller, R. "Let's Get Physical": Advantages of a physical model over 3D computer models and textbooks in learning imaging anatomy. Anat. Sci. Educ. 6 (4), 216-224 (2013).
- Torres, K., Staskiewicz, G., Sniezynski, M., Drop, A., Maciejewski, R. Application of rapid prototyping techniques for modelling of anatomical structures in medical training and education. Folia Morphol. 70 (1), 1-4 (2011).
- Camaros, E., Sanchez-Hernandez, C., Rivals, F. Make it clear: molds, transparent casts and lightning techniques for stereomicroscopic analysis of taphonomic modifications on bone surfaces. J. Anthropol. Sci. 94, 223-230 (2016).
- Rengier, F., et al. 3D Printing based on imaging data: review of medical applications. Int. J. Comput. Assist. Radiol. Surg. 5 (4), 335-341 (2010).
- Esses, S., Berman, P., Bloom, A., Sosna, J. Clinical Applications of Physical 3D Models Derived From MDCT Data and Created by Rapid Prototyping. AJR Am. J. Roentgenol. 196 (6), W683-W688 (2011).
- Canessa, E., Fonda, C., Zennaro, M. Low-cost 3D Printing for Science, Education and Sustainable Development. Low-Cost 3D Printing. , (2013).
- Schelly, C., Anzalone, G., Wijnen, B., Pearce, J. Open-source 3-D printing technologies for education: Bringing additive manufacturing to the classroom. J. Vis. Lang. Comput. 28, 226-237 (2015).
- Bourke, P. Scientific Data Visualization Using Techniques Normally Reserved for more Frivolous Activities. GTSF Int. J. Comput. 4 (3), 35-41 (2015).
- Hardware Highlight: Stratasys Objet500 Connex. Intellectual Ventures Laboratory. , Available from: http://www.intellectualventureslab.com/invent/hardware-highlight-3d-printer (2016).
- Stratasys Production Series. Stratays. , Available from: http://www.stratasys.com/3d-printers/production-series (2016).
- Products Overview. MakerBot. , Available from: http://store.makerbot.com/printers (2016).
- Evans, B. A World of 3D Printers. Practical 3D Printers: The Science and Art of 3D Printing. , Apress. New York, NY. (2012).
- J750 Stratasys-3D printer. Aniwaa. , Available from: http://www.aniwaa.com/product/3d-printers/stratasys-j750 (2016).
- Berman, B. 3-D printing: The new industrial revolution. Bus. Horizons. 55, 155-162 (2012).
- Image Transfer Laser Engraving. United States Patent. , 4,156,124 (1979).
- 3D Laser Engraving Machine STNDP-801AB4 . STN. , Available from: http://www.stnlaser.com/products/3d-laser-engraving-machine-stndp-801ab4.html (2016).
- National Biomedical Imaging Archive. , Available from: https://imaging.nci.nih.gov/ncia/login.jsf (2016).
Reprints and Permissions
