The development of new ultrasound (US) probes based on Capacitive Micromachined Ultrasonic Transducer (CMUT) technology requires an early realistic assessment of imaging capabilities. We describe a repeatable experimental protocol for US image acquisition and comparison with magnetic resonance images, using an ex vivo bovine brain as an imaging target.
A subscription to JoVE is required to view this content. Sign in or start your free trial.
Method Article
An Experimental Protocol for Assessing the Performance of New Ultrasound Probes Based on CMUT Technology in Application to Brain Imaging
In This Article
Summary
Abstract
The possibility to perform an early and repeatable assessment of imaging performance is fundamental in the design and development process of new ultrasound (US) probes. Particularly, a more realistic analysis with application-specific imaging targets can be extremely valuable to assess the expected performance of US probes in their potential clinical field of application.
The experimental protocol presented in this work was purposely designed to provide an application-specific assessment procedure for newly-developed US probe prototypes based on Capacitive Micromachined Ultrasonic Transducer (CMUT) technology in relation to brain imaging.
The protocol combines the use of a bovine brain fixed in formalin as the imaging target, which ensures both realism and repeatability of the described procedures, and of neuronavigation techniques borrowed from neurosurgery. The US probe is in fact connected to a motion tracking system which acquires position data and enables the superposition of US images to reference Magnetic Resonance (MR) images of the brain. This provides a means for human experts to perform a visual qualitative assessment of the US probe imaging performance and to compare acquisitions made with different probes. Moreover, the protocol relies on the use of a complete and open research and development system for US image acquisition, i.e. the Ultrasound Advanced Open Platform (ULA-OP) scanner.
The manuscript describes in detail the instruments and procedures involved in the protocol, in particular for the calibration, image acquisition and registration of US and MR images. The obtained results prove the effectiveness of the overall protocol presented, which is entirely open (within the limits of the instrumentation involved), repeatable, and covers the entire set of acquisition and processing activities for US images.
Introduction
The increasing market for small and portable ultrasound (US) scanners is leading to the development of new echographic probes in which part of the signal-conditioning and beamforming electronics is integrated into the probe handle, especially for 3D/4D imaging1. Emerging technologies particularly suited to achieve this high level of integration include Micromachined Ultrasonic Transducers (MUTs)2, a class of Micro Electro-Mechanical System (MEMS) transducers fabricated on silicon. In particular, Capacitive MUTs (CMUTs) have finally reached a technological maturity that makes them a valid alternative to piezoelectric transducers for next generation ultrasound imaging systems3. CMUTs are very appealing due to their compatibility with microelectronics technologies, wide bandwidth - which yields a higher image resolution - high thermal efficiency and, above all, high sensitivity4. In the context of the ENIAC JU project DeNeCoR (Devices for NeuroControl and NeuroRehabilitation)5, CMUT probes are being developed6 for US brain imaging applications (e.g. neurosurgery), where high-quality 2D/3D/4D images and accurate representation of brain structures are required.
In the development process of new US probes, the possibility of performing early assessments of imaging performance is fundamental. Typical assessment techniques involve measuring specific parameters like resolution and contrast, based on images of tissue-mimicking phantoms with embedded targets of known geometry and echogenicity. More realistic analysis with application-specific imaging targets can be extremely valuable for an early assessment of the expected performance of US probes in their potential application to a specific clinical field. On the other hand, the complete repeatability of acquisitions is fundamental for comparative testing of different configurations over time, and this requirement rules out in vivo experiments altogether.
Several works in the literature on diagnostic imaging techniques proposed the use of ex vivo animal specimens7, cadaver brains8, or tissue mimicking phantoms9 for different purposes10, which include the testing of imaging methods, registration algorithms, Magnetic Resonance (MR) sequences, or the US beam-pattern and resulting image quality. For example, in the context of brain imaging, Lazebnik et al.7 used a formalin-fixed sheep brain to evaluate a new 3D MR registration method; similarly, Choe et al.11 investigated a procedure for the registration of MR and light microscopy images of a fixed owl monkey brain. A polyvinyl alcohol (PVA) brain phantom was developed in9 and used to perform multimodal image acquisitions (i.e. MR, US, and Computed Tomography) to generate a shared image dataset12 for the testing of registration and imaging algorithms.
Overall, these studies confirm that the use of a realistic target for image acquisitions is indeed an essential step during the development of a new imaging technique. This represents an even more critical stage when designing a new imaging device, like the CMUT US probe presented in this paper, which is still in a prototyping phase and needs extensive and reproducible testing over time, for an accurate tuning of all design parameters before its final realization and possible validation in in vivo applications (as in13,14,15).
The experimental protocol described in this work has been thus designed to provide a robust, application-specific imaging assessment procedure for newly-developed US probes based on CMUT technology. To ensure both realism and repeatability, bovine brains (obtained through the standard food-supply commercial chain) fixed in formalin were chosen as imaging targets. The fixation procedure guarantees long-term preservation of tissue characteristics while retaining satisfactory morphological qualities and visibility properties in both US and MR imaging16,17.
The protocol for the assessment of US image quality described here also implements a feature borrowed from neuronavigation techniques used for neurosurgery15. In such approaches, US probes are connected to a motion tracking system that provides spatial position and orientation data in real-time. In this way, US images acquired during surgical activities can be automatically registered and visualized, for guidance, in superposition to pre-operatory MR images of the patient's brain. For the purposes of the presented protocol, the superposition with MR images (which are considered as the gold standard in brain imaging) is of great value, since it allows human experts to visually assess which morphological and tissue features are recognizable in the US images and, vice versa, to recognize the presence of imaging artifacts.
The possibility to compare images acquired with different US probes becomes even more interesting. The experimental protocol presented includes the possibility to define a set of spatial reference poses for US acquisitions, focused on the most feature-rich volume regions identified in a preliminary visual inspection of MR images. An integrated visual tool, developed for the Paraview open source software system18, provides guidance to operators for matching such predefined poses during US image acquisition phases. For the calibration procedures required by the protocol, it is fundamental to equip all target specimens - either biological or synthetic - with predefined position landmarks that provide unambiguous spatial references. Such landmarks must be visible in both US and MR images and physically accessible to measurements made with the motion tracking system. The chosen landmark elements for the experiment are small spheres of Flint glass, whose visibility in both US and MR images was demonstrated in the literature19 and confirmed by preliminary US and MR scans performed before the presented experiments.
The protocol presented relies on the Ultrasound Advanced Open Platform (ULA-OP)20, a complete and open research and development system for US image acquisition, which offers much wider experimental possibilities than commercially available scanners and serves as a common basis for the evaluation of different US probes.
First, the instruments used in this work are described, with particular reference to the newly designed CMUT probe. The experimental protocol is introduced in detail, with a thorough description of all the procedures involved, from initial design to system calibration, to image acquisition and post-processing. Finally, the obtained images are presented and the results are discussed, together with hints to future developments of this work.
Instrumentation
CMUT probe prototype
The experiments were carried out using a newly developed 256-element CMUT linear array prototype, designed, fabricated, and packed at the Acoustoelectronics Laboratory (ACULAB) of Roma Tre University (Rome, Italy), using the CMUT Reverse Fabrication Process (RFP)4. RFP is a microfabrication and packaging technology, specifically conceived for the realization of MEMS transducers for US imaging applications, whereby the CMUT microstructure is fabricated on silicon following an "upside-down" approach21. As compared to other CMUT fabrication technologies, RFP yields to improved imaging performance due to the high uniformity of the CMUT cells' geometry over the entire array, and to the use of acoustically engineered materials in the probe head package. An important feature of RFP is that the electrical interconnection pads are located on the rear part of the CMUT die, which eases the 3D-integration of 2D arrays and front-end multi-channel electronics.
The 256-element CMUT array was designed to operate in a frequency band centered at 7.5 MHz. An element pitch of 200 µm was chosen for the array resulting in a maximum field-of-view width of 51.2 mm. The height of the single CMUT array elements was defined to achieve suitable performance in terms of lateral resolution and penetration capability. A 5 mm array element height was chosen in order to obtain a -3 dB beam width of 0.1 mm and a -3 dB depth of focus of 1.8 mm at 7.5 MHz, when fixing the elevation focus at a depth of 18 mm by means of an acoustic lens. 195 µm-wide array elements were obtained by arranging and electrically connecting in parallel 344 circular CMUT cells, following a hexagonal layout. Consequently, the resulting 5 µm element-to-element distance, i.e. the kerf, matches the membrane-to-membrane separation. A schematic representation of the structure of a CMUT array is reported in Figure 1.

Figure 1: CMUT array structure. Schematic representation of the structure of a CMUT array: array elements composed of several cells connected in parallel (a), layout of the CMUT microstructure (b); cross-section of a CMUT cell (c). Please click here to view a larger version of this figure.
The CMUT microfabrication parameters, i.e. the lateral and vertical dimensions of the plate and electrodes, were defined using Finite Element Modeling (FEM) simulations with the aim of achieving a broadband immersion operation, characterized by a frequency response centered at 7.5 MHz and a 100% -6 dB two-way fractional bandwidth. The height of the cavity, i.e. the gap, was defined to achieve a collapse voltage of 260 V to maximize the two-way sensitivity, by biasing the CMUT at 70% of the collapse voltage4, considering an 80 V maximum excitation signal voltage. Table 1 summarizes the main geometrical parameters of the microfabricated CMUT.
| CMUT Array Design Parameters | |
| Parameter | Value |
| Array | |
| Number of elements | 256 |
| Element pitch | 200 µm |
| Element length (elevation) | 5 mm |
| Fixed elevation focus | 15 mm |
| CMUT Microstructure | |
| Cell diameter | 50 µm |
| Electrode diameter | 34 µm |
| Cell-to-cell lateral distance | 7.5 µm |
| Plate thickness | 2.5 µm |
| Gap height | 0.25 µm |
Table 1. CMUT probe parameters. Geometrical parameters of the CMUT linear-array probe and CMUT cell microstructure.
The packaging process used to integrate the CMUT array in a probe head is described in reference4. The acoustic lens was fabricated using a room temperature vulcanized (RTV) silicone rubber doped with metal-oxide nanopowders to match the acoustic impedance of water and avoid spurious reflections at the interface22. The resulting compound was characterized by a density of 1280 kg/m3 and a speed of sound of 1100 m/s. A 7 mm curvature radius was chosen for the cylindrical lens, leading to a geometrical focus of 18 mm and a maximum thickness of approximately 0.5 mm above the transducer surface. A picture of the CMUT probe head is shown in Figure 2(a).
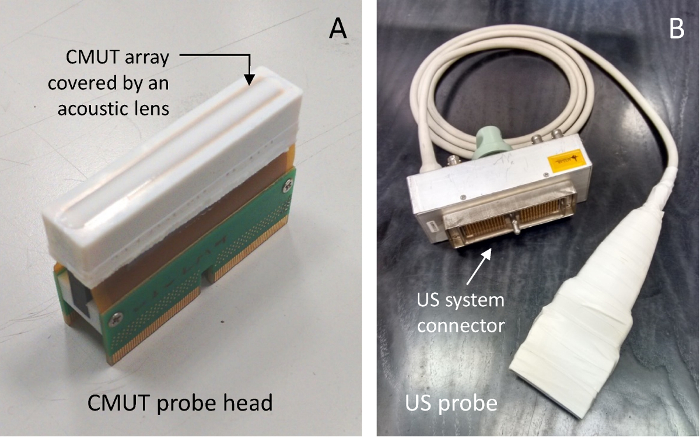
Figure 2: CMUT probe. Head of the developed CMUT probe, including the linear array of transducers and acoustic lens (a), and the full CMUT probe with connector (b). Please click here to view a larger version of this figure.
The CMUT probe head was coupled to the probe handle containing multichannel reception analog front-end electronics and a multipolar cable for the connection to the US scanner. The single channel electronic circuit is a high input-impedance 9 dB-gain voltage amplifier that provides electrical current necessary to drive the cable impedance. The multichannel electronics, described in reference 4, is based on a circuit topology including an ultra-low-power low-noise receiver and an integrated switch for the transmit/receive signal duplexing. The front-end electronics power supply and the CMUT bias voltage are generated by a custom power supply unit and fed to the probe through the multipolar cable. The complete probe is shown in Figure 2(b).
Piezoelectric US probes
For qualitative comparison of the images obtained with the CMUT probe above, two commercially-available piezoelectric US probes were included in the experiments. The first one is a linear-array probe with 192 transducing elements, a 245 µm pitch, and a 110% fractional bandwidth centered at 8 MHz. This probe was used to acquire 2D B-mode images. The second probe is a probe for 3D imaging with a mechanically swept linear array of 180 transducing elements, with a 245 µm pitch and a 100% fractional bandwidth centered at 8.5 MHz. A stepper motor placed inside the probe housing enables sweeping the linear array to acquire multiple planes, which can be used to reconstruct a 3D image of the scanned volume23.
ULA-OP System
The acquisition of US images was carried out by employing the ULA-OP system20, which is a complete and open US research and development system, designed and realized at the Microelectronics Systems Design Laboratory of the University of Florence, Italy. The ULA-OP system can control, both in transmission (TX) and reception (RX), up to 64 independent channels connected through a switch matrix to an US probe with up to 192 piezoelectric or CMUT transducers. The system architecture features two main processing boards, an Analog Board (AB) and a Digital Board (DB), both contained in a rack, which are completed by a power-supply board and a back-plane board that contains the probe connector and all internal routing components. The AB contains the front-end to the probe transducers, in particular the electronic components for analog conditioning of the 64 channels and the programmable switch matrix that maps dynamically the TX-RX channels to the transducers. The DB is in charge of real-time beamforming, synthesizing the TX signals and processing the RX echoes to produce the desired output (for instance B-mode images or Doppler sonograms). It is worth highlighting that the ULA-OP system is fully configurable, hence the signal in TX can be any arbitrary waveform within the system bandwidth (e.g. three-level pulses, sine-bursts, chirps, Huffman codes, etc.) with a maximum amplitude of 180 Vpp; in addition, the beamforming strategy can be programmed according to the latest focusing patterns (e.g. focused wave, multi-line-transmission, plane wave, diverging waves, limited diffraction beams, etc.)24,25. At the hardware level, these tasks are shared among five Field Programmable Gate Arrays (FPGAs) and one Digital Signal Processor (DSP). With mechanically-swept 3D imaging probes, such as the one described above, the ULA-OP system also controls the stepper motor inside the probe, for the synchronized acquisition of individual 2D frames at each position of the transducer array.
The ULA-OP system can be re-configured at run time and adapted to different US probes. It communicates through a USB 2.0 channel with a host computer, equipped with a specific software tool. The latter has a configurable graphical interface that provides real-time visualization of US images, reconstructed in various modes; with volumetric probes, for instance, two B-mode images of perpendicular planes in the scanned volume can be displayed in real-time.
The main advantage of the ULA-OP system for the purposes of the described protocol is that it allows an easy tuning of the TX-RX parameters and it offers full access to the signal data collected at each step in the processing chain26, also making it possible to test new imaging modalities and beamforming techniques27,28,29,30,31,32,33.
Motion tracking system
To record the US probe position during image acquisition, an optical motion tracking system was employed34. The system is based on a sensor unit that emits infrared light via two illuminators (light emitting diodes (LEDs)) and uses two receivers (i.e. a lens and a charge-coupled device (CCD)) to detect the light reflected by multiple purpose-specific passive markers arranged in predefined rigid shapes. Information about reflected light is then processed by an on-board CPU to compute both position and orientation data, which can be transferred to a host computer connected via USB 2.0. The same link can be used to control the configuration of the sensor unit.
The sensor unit ships together with a set of tools, each endowed with four reflective markers arranged in a rigid geometrical configuration. The motion tracking system can track up to six distinct rigid tools simultaneously, at a working frequency of approximately 20 Hz. Two such tools were used for these experiments: a pointer tool, that allows acquiring the 3D position touched by its tip, and a clamp-equipped tool, that can be attached to the US probe under test (see Figure 14).
On the software side, the motion tracker features a low-level serial application programming interface (API) for both unit control and data acquisition, that can be accessed via USB. By default, position and orientations are returned as multi-entry items, i.e. one entry per each tool being tracked. Each entry contains a 3D position (x, y, z) expressed in mm and an orientation (q0, qx, qy, qz) expressed as a quaternion. The system also comes with a toolbox of higher-level software instruments, which includes a graphical tracking tool for visualizing and measuring in real-time the positions/orientations of multiple tools within the field of view of the sensor unit.
System overview, integration, and software components
The diagram in Figure 3 summarizes the instrumentation adopted for the protocol, also describing the data stream that flows across the systems.
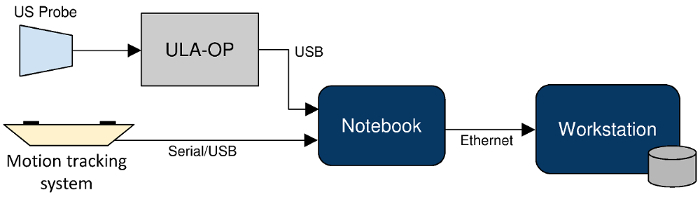
Figure 3: Block diagram of the whole hardware setup and system integration. The US probe is connected to the ULA-OP system which communicates via USB with the notebook for US image acquisition. At the same time, the notebook is also connected via USB to the motion tracking system, for position data acquisition, and via Ethernet to the workstation, for data processing. Please click here to view a larger version of this figure.
Apart from the US probes, the motion tracker, and the ULA-OP system, which have been described above, the setup also includes two computers, namely a notebook and a workstation. The former is the main front-end to instrumentation, receiving and synchronizing the two main incoming data streams: the US images coming from the ULA-OP system and the 3D positioning data from the motion tracker. It also provides a visual feedback to the operator for the images being acquired. The workstation has substantially higher computational power and storage capacity. It provides back-end support for image post-processing and a repository for the combined imaging datasets. The workstation is also used for the visualization of US and MR images, including the possibility of simultaneous 3D visualization of registered multi-modal images.
A critical requirement for the image acquisition experiments is the synchronization of the two main data streams. The motion tracking and ULA-OP systems are independent instruments that do not yet support an explicit synchronization of activities. Due to this, US image data and position information need to be properly combined to detect the correct 3D position of the US probe at the time each image slice was acquired. For this purpose, a specific logging application has been developed for recording and timestamping in real-time the data supplied by the motion tracking system, by modifying a C++ software component that is included, in this case, in the motion tracker itself. Typically, motion tracking systems feature a low-level API that allows capturing data in real-time and transcribing them to a file.
The adopted synchronization method works as follows. Each entry in the file produced by the logging application is augmented with a timestamp in the format "yyyy-MM-ddThh:mm:ss.kkk", where: y=year, M=month, d=day, h=hour, m=minute, s=second, k=millisecond. The ULA-OP PC-based software (C++ and MATLAB programming languages) computes the starting and ending time of each image acquisition sequence and stores this information in each image in .vtk format. To provide a common temporal reference during the experiments, both the above software procedures are executed on the front-end computer in Figure 3. Timestamps produced in this way are then used by the post-processing software procedures that produce the final dataset (see Protocol, Section 8).
Another specific software component was realized and run on the workstation to provide real-time feedback to the operator, by relating the current US probe position to MR images and, in particular, to the set of predefined poses. A server-side software routine in Python processes the motion tracker log file, translates the current US probe position into a geometric shape, and sends the data to a Paraview server. A Paraview client connects to the same Paraview server and in real-time displays the position of the geometric shape, superimposed on a MR image and to further geometric shapes describing the predefined poses. An example of the resulting real-time visualization is shown in Figure 17.
Access restricted. Please log in or start a trial to view this content.
Protocol
All biological specimens shown in this video have been acquired through the standard food supply chain. These specimens have been treated in accordance with the ethical and safety regulations of the institutions involved.
NOTE: The diagram in Figure 4 summarizes the 8 main stages of this protocol. Stages 1 to 4 involve initial activities, to be carried out just once before the beginning of US image acquisition and processing stages. These initial stages are as follows: 1. preliminary design of the experimental setup and an agar phantom (to be used in calibration procedures); 2) preparation of the ex vivo bovine brain; 3. acquisition of MR images of the brain; 4. definition of qualitative poses to be used as target for US image acquisition. Stages 5 to 8 relate to the acquisition and processing of US images. These stages are: 5. experimental setup, in which all instruments are connected and integrated, and all targets are positioned and verified; 6. calibration of the US probe equipped with passive markers for navigation; 7. acquisition of US images of the bovine brain immersed in water, both in predefined poses and in "freehand mode"; 8. post-processing and visualization of the combined MR/US image dataset. While stage 5 can be performed just once, at the beginning of experimental activities, stages 6 and 7 must be repeated per each US probe involved. Step 8 can be performed just once on the entire combined dataset, when all acquisitions are completed.
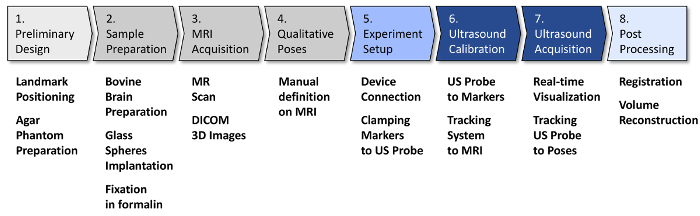
Figure 4: Experimental protocol workflow. The block diagram illustrates the main steps of the protocol, including a list of the main operations in each step. Steps 1-5 involve initial activities and setup preparation for US acquisitions; thus, they are to be carried out just once. Stages 6 and 7 involve US acquisitions and must be repeated for each probe. Step 8, which is image post-processing, can be performed just once at the end. Please click here to view a larger version of this figure.
1. Preliminary design
- Design and validation of landmark positioning
NOTE: The following procedure defines a consistent strategy for the positioning of landmarks, to be used for the calibration of the motion tracking system described in Section 6.- Prepare a polystyrene head mannequin by cutting out a shape approximately similar to that of the bovine brain (height = 180 mm, width = 144 mm, length = 84 mm) using a knife.
- Insert 6 patterns of 3 Flint glass spheres (3 mm diameter) into the polystyrene brain, arranged at the vertices of an equilateral triangle with side of approximately 15 mm, and not farther than 1 mm from the external surface (see Figure 5).
- Connect the motion tracking system to the notebook via USB. Open the tracking tool, start motion tracking and check that when touching the glass spheres in the polystyrene brain, the pointer tool remains within the tracking field of view, to verify visibility and effective accessibility during the experiments.
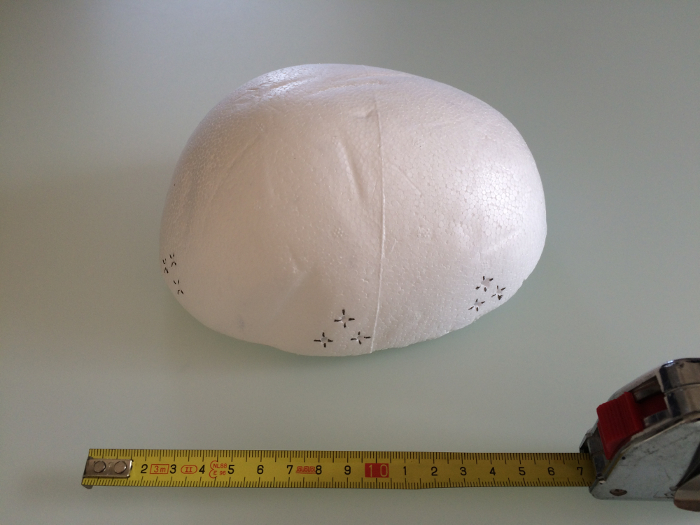
Figure 5: Polystyrene model of the brain used during the preliminary design stage. The polystyrene mannequin head, properly cut to mimic the bovine brain dimensions, was used to choose the positioning of the glass sphere patterns in the brain. Six triangular patterns of spheres, with a 3-mm diameter, have been implanted in the polystyrene model as shown in the picture, i.e. three patterns on the right and three on the left brain hemispheres. Please click here to view a larger version of this figure.
- Agar phantom preparation
NOTE: These steps allow to prepare a laboratory-made agar phantom to be used for calibration procedures (Section 6.1).- In a beaker, dilute 100 g of glycerine and 30 g of agar in 870 g of distilled water. Stir the mixture, while increasing its temperature up to 90 °C, for 10-15 min. Pour the mixture to fill a 13x10x10 cm food container and keep it in the refrigerator for at least one day.
- Remove the agar phantom from the refrigerator. Color 6 glass spheres with a yellow enamel (for better visibility) and insert 2 patterns of 3 glass spheres each in the agar phantom (i.e. one per major side of the block), not farther from the surface than 1 mm (Figure 6).
- For preservation when not in use, immerse the agar phantom in a solution of water and benzalkonium chloride, using a sealed plastic food container, and keep it in the refrigerator.
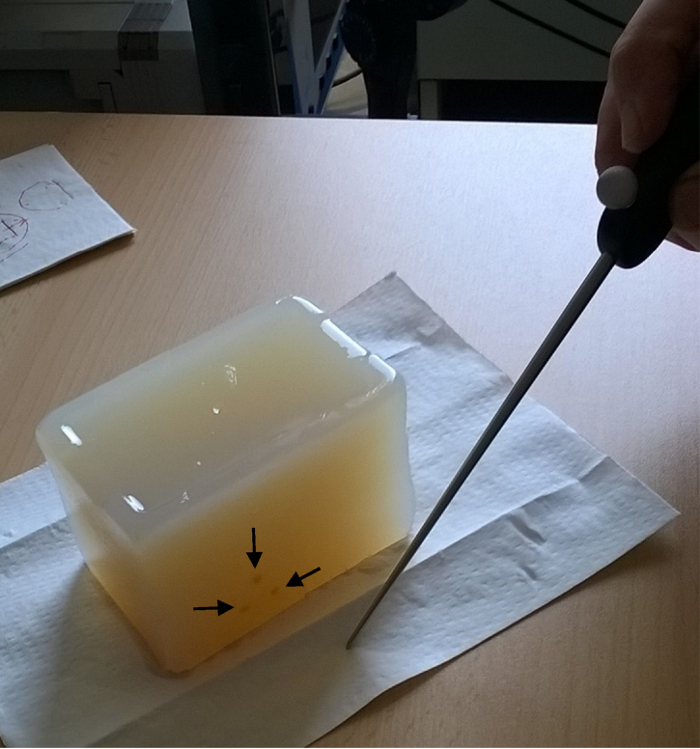
Figure 6: Agar phantom. The figure shows the agar phantom, in which an implanted pattern of three yellow-painted glass spheres (indicated by the black arrows) is clearly visible in the lower edge. The pointer tool tip, used to measure the sphere positions during the calibration phase, is also shown near the phantom. Please click here to view a larger version of this figure.
2. Bovine brain preparation and fixation
- Acquire the ex vivo bovine brain from the standard food supply chain. Transport it on ice (for preservation). Typically, as in this case, the ex vivo brain is made available after having been removed from the animal.
- Remove the brain from ice and place it in an aspirating hood. Keep it in the hood for the subsequent preparation steps. Isolate the cerebral hemispheres, by separating cerebellum, mesencephalon, pons, and brainstem with a surgical blade, cutting through the structures on the ventral surface of the brain.
- Using the polystyrene mannequin as a reference for positioning, implant 6 triangular patterns of 3 spheres each in the cortex of frontal, temporal and occipital lobes. Ensure that the predefined conditions (i.e. distances from the surface and among spheres) are met. For visibility, mark the positions of all the spheres on brain surface with a green tissue marking dye for histology (Figure 7).
- Immerse the brain in 10% buffered formalin solution. Use a plastic container for anatomical parts (Figure 8). Leave the brain in the container with formalin for at least 3 weeks, until the fixation process is complete.
CAUTION: formalin is a toxic chemical substance and must be handled with care; specific regulations may also apply, for instance US OSHA Standard 1910.1048 App. A.
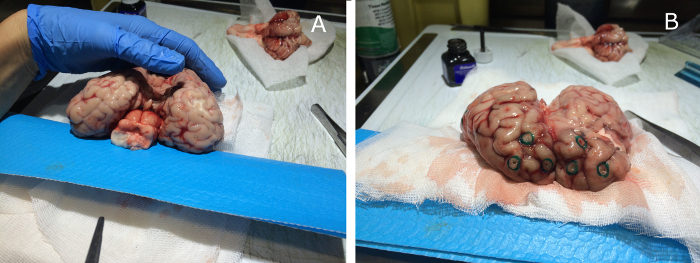
Figure 7: Bovine brain preparation and implantation of the glass spheres. The bovine brain is prepared by an expert pathologist by removing the anatomical parts in excess and then implanting the glass sphere patterns, according to the previously designed configuration (a). The sphere positions are then marked with a green dye on the brain surface (b). Please click here to view a larger version of this figure.
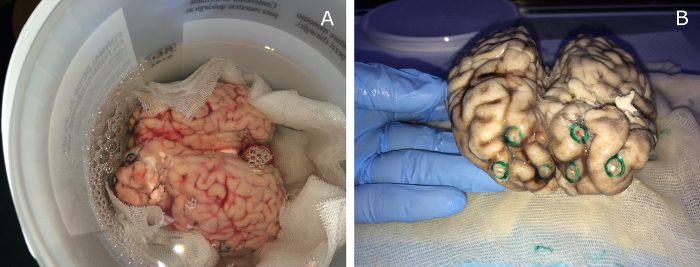
Figure 8: Bovine brain fixation in formalin. The bovine brain with the implanted glass spheres is immersed in 10% buffered formalin solution inside a plastic container for anatomical parts (a). After a period of at least 3-weeks, the fixation process is complete (b) and the brain can be used for image acquisitions. Please click here to view a larger version of this figure.
3. MR image acquisition
- Extract the brain from formalin solution, wash it in water overnight, place it in a clean plastic container, and seal it.
- Put the container into the MR head coil and place it into the MR scanner.
- Perform MR scans employing a 3 T MR scanner endowed with a 32-channel head coil (Figure 9). Acquire three sets of images using T1, T2 and CISS sequences with a resolution of 0.7x07x1 mm3 and 0.5x0.5x1 mm3 for T1/T2 and CISS sequences, respectively. Save the MR images in DICOM format using the software tools of the MR scanner.
- After usage, immerse the brain in 10% buffered formalin. Transfer the acquired MR images from the MR scanner to a processing workstation.
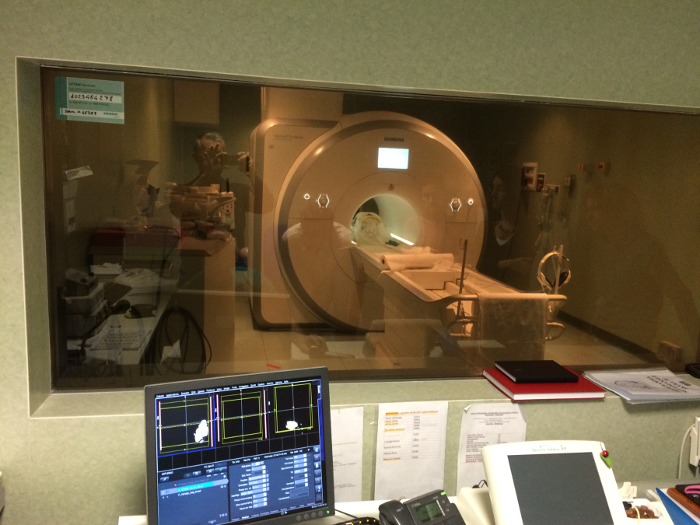
Figure 9: MR image acquisition. The bovine brain, sealed in a clean plastic container, is put into the 3 T MR scanner for MR image acquisitions. Please click here to view a larger version of this figure.
4. Definition of qualitative poses for US image acquisitions
NOTE: This procedure defines a set of qualitative poses, with respect to MR images, in which the visibility of brain regions that contain clearly recognizable anatomical structures and well-differentiated tissues (particularly white and grey matter) is maximized in US images.
- Open the MR images in DICOM format with Paraview software tool (henceforth, visualization software). Have an expert visualize the images both as slices and 3D volume, as required.
- Inspect each MR image in the dataset to assess the visibility of anatomical structures and tissues (e.g. lateral ventricles, corpus callosum, gray matter of basal ganglia).
- Select 3D spatial subregions from the reference MR image containing the best recognizable visual features and approximately define the cutting planes of maximal visibility. Identify 12 predefined poses for US image acquisition, each involving a significant set of visual features.
- For each virtual pose, use "Sources > Cone" to create a 3D Cone as a visual landmark. Adapt each cone height to 40 mm and radius to 2 mm and manually position the cone in the 3D visual field (Figure 10). Save the complex of MR image, 3D regions, planes, and landmarks as a Paraview state file.
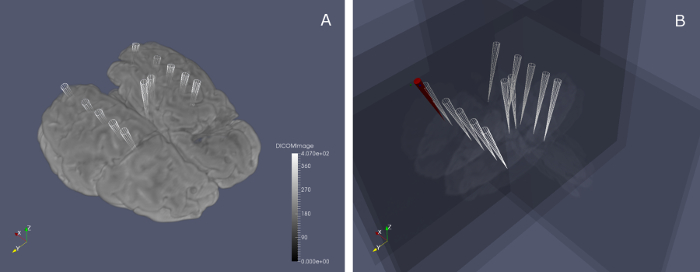
Figure 10: Predefined poses for US image acquisition. The markers in (a) show the positions of the 12 selected poses in the 3D MR image frame to be reached by the operator for US image acquisition. In (b) the MR planes corresponding to the selected poses are shown; the red marker represents the US probe position (represented in the MR image space) moving in real-time, until one of the white markers is reached and the desired US image can be acquired by the system. Please click here to view a larger version of this figure.
5. Experimental setup
- Environment and targets
NOTE: This step describes the preparation of the setup and instruments for US acquisition experiments.- Position a 50x50x30 cm plastic tank on a table and fill it with degassed water up to a height of 15 cm. Position the motion tracking system so that the water tank is visible from above and entirely within its field of view (Figure 11) and connect the motion tracker to the notebook via USB.
- Perform the pivoting procedure to calibrate the pointer using the tracking tool of the motion tracking system34.
- Position the ULA-OP system on the table and connect it to the notebook via USB, making sure that the computer screen is clearly visible to the US probe operator. Position the workstation on the table and make sure that its screen is clearly visible to the operator.
- Extract the brain from formalin solution and wash it in water. Immobilize it onto a plate of synthetic resin, using segments of sewing thread and adhesive stripes (Figure 12).
- Immerse the plate with the brain into the tank and verify that the entire working space around the brain fits within the field of view of the motion tracker, using the pointer and the software tracking tool.
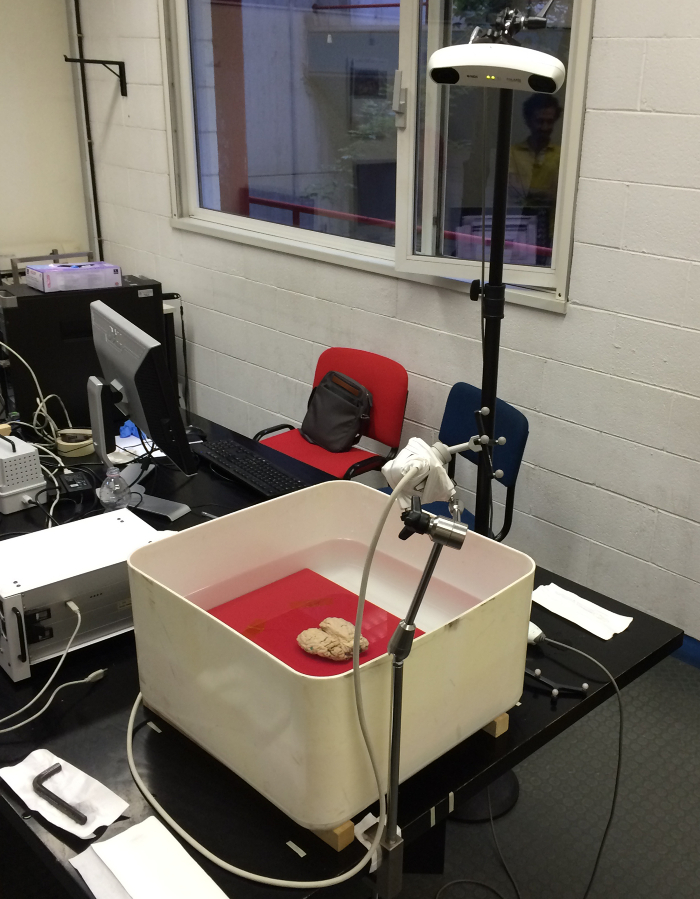
Figure 11: Setup of the experimental acquisitions with the motion tracking system. The motion tracking sensor is placed above the water tank in which the bovine brain is immersed, so that the target and the probe with the clamped reflecting markers entirely fit within its measurement field of view. Please click here to view a larger version of this figure.
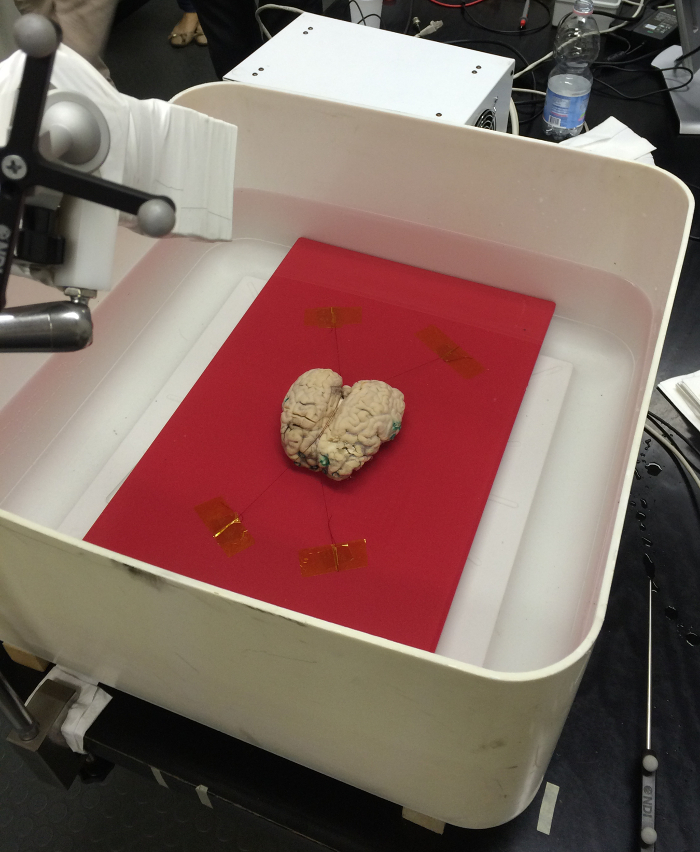
Figure 12: Positioning of the bovine brain in the water tank. The bovine brain is immobilized on a synthetic resin plate by means of two sewing threads (placed along the longitudinal fissure) and fixed on the plate with adhesive stripes. The plate and the bovine brain are then immersed in the water tank. Please click here to view a larger version of this figure.
- Connecting the US probe and configuring ULA-OP to perform the scans.
- Connect the US probe to the ULA-OP system.
- Configure the ULA-OP system through its configuration files and its software interface from the computer (Figure 13).
- Define a duplex-mode consisting of two interleaved B-modes employing two different operating frequencies (7 MHz and 9 MHz). Set a 1-cycle bipolar burst for each mode. Set the transmission focus at 25 mm depth and dynamic focusing in reception with F#=2 sinc apodization function.
- Configure the system to record beamformed and in-phase and quadrature (I/Q) demodulated data.
- Perform a few acquisition tests to ensure full operativity.
- Freeze the system, by clicking on the "Freeze" toggle button in the ULA-OP software. Enable the autosave mode by clicking on the toggle button that appears as three floppy disks. On the popup window, that appears at the end of the acquisition, write the filename and click "Save".
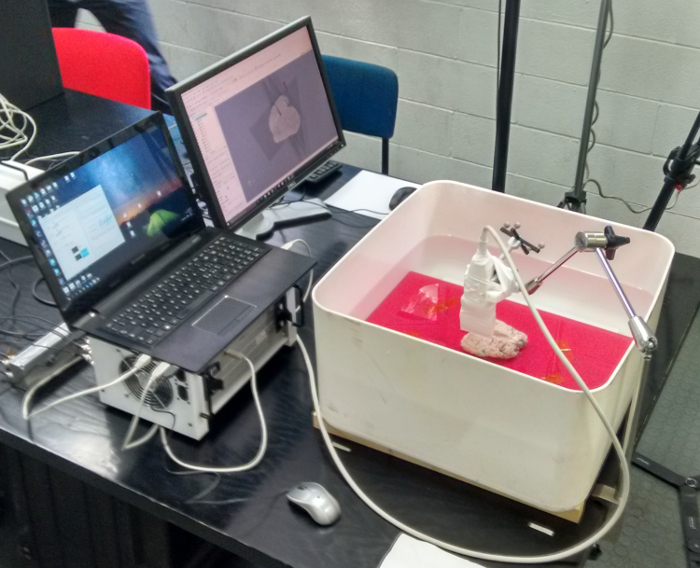
Figure 13: Experimental setup for US image acquisition. The ULA-OP system is connected to the notebook placed near the water tank, so that its display is clearly visible to the US probe operator during acquisitions. Please click here to view a larger version of this figure.
- Clamping the passive reflective markers onto the US probe
NOTE: Following this procedure, a solid assembly of the US probe and the passive reflective markers is created for subsequent acquisitions of image and position data.- Find a suitable position for the clamp on the US probe handle. Clamp the passive reflective markers on the US probe handle (Figure 14).
- Perform a few acquisition tests (see step 5.2.3) to ensure that the clamp is stable, the markers are clearly visible by the motion tracking system, while the US probe is being held in the expected working postures.
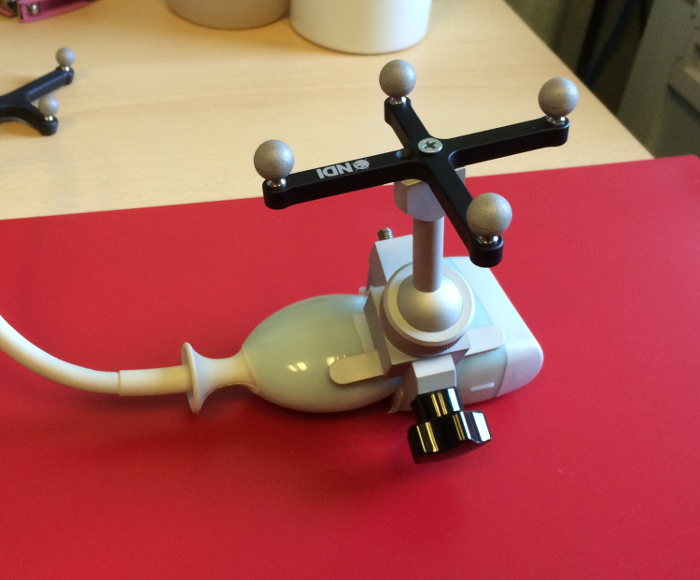
Figure 14: Passive tool with reflecting markers clamped on the 3D-imaging piezoelectric probe. The tool with markers is properly clamped and fixed on the 3D-imaging piezoelectric probe handle, so that they form a united assembly to be used for US image and position data acquisition at the same time. Please click here to view a larger version of this figure.
6. Calibration
NOTE: This section describes the experimental part of the protocol that gathers the information to compute the required transformations among the different spatial reference frames involved. See Section 9 for mathematical details about the computation method. The software routines in the MATLAB programming language for calibration are available as open-source at https://bitbucket.org/unipv/denecor-transformations.
- From US image frame to the passive tool frame clamped onto the US probe
NOTE: The following calibration procedure is used to compute the rigid transformation that allows to assign spatial positions to US image voxels in the local frame of reference of the passive tool clamped on the probe. It must be repeated for each mounting of a passive tool onto an US probe.- Position the agar phantom in full immersion inside the water tank. Start the logging application that records position data and collect the positions of each of the 6 glass spheres in the agar phantom with the pointer tool, while tracking its motion.
- Acquire one US image per each pattern of 3 spheres in the agar phantom (Figure 15) (step 5.2.3). Position the US probe via the mechanical arm using the pre-visualization function of the ULA-OP system, so that a complete pattern of three spheres is within the field of view. Acquire and save the corresponding US image.
- Transfer all US images in ULA-OP format, together with the motion tracker log-files, to the workstation.
- Open each US image in the visualization software, manually mark the position of the 3 glass spheres in each of them, and transcribe the 3D positions into a .csv file.
- Compute the US-to-marker rigid transformation between the two reference frames (see the open-source code provided and Section 9).
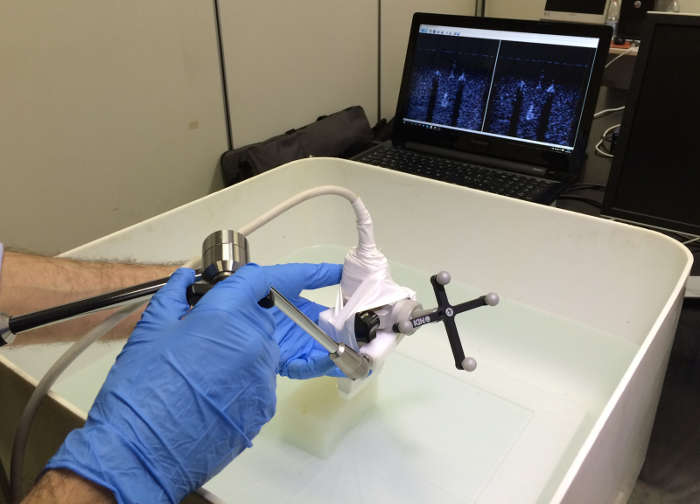
Figure 15: Acquisition of US images of the agar phantom for calibration. The operator moves the US probe (the CMUT probe) over the agar phantom to acquire two US images containing the two embedded sphere patterns, as shown in real-time by the ULA-OP software on the computer display. The acquired images are then used to compute the transformation from the US image space to the space of the passive tool with markers clamped on the probe. Please click here to view a larger version of this figure.
- From the motion tracker space to the MR image space
NOTE: The following calibration operations are used to compute the rigid transformation from the motion tracking system reference frame to the MR image reference frame and must be repeated for each placement of the brain inside the operational range of the motion tracker. The last two steps in this procedure must be repeated for each distinct MR image.- Position the brain in full immersion inside the water tank. Start the logging application and collect the positions of each of the 18 glass spheres with the pointer tool (Figure 16). Transfer the motion tracker log files onto the workstation.
- Open each MR image of the brain in the visualization software, manually mark the position of each of the 18 glass spheres, and save the corresponding 3D coordinates as .csv files.
- Compute the motion tracker-to-MR rigid transformation between the two reference frames (see the open-source code and Section 9).
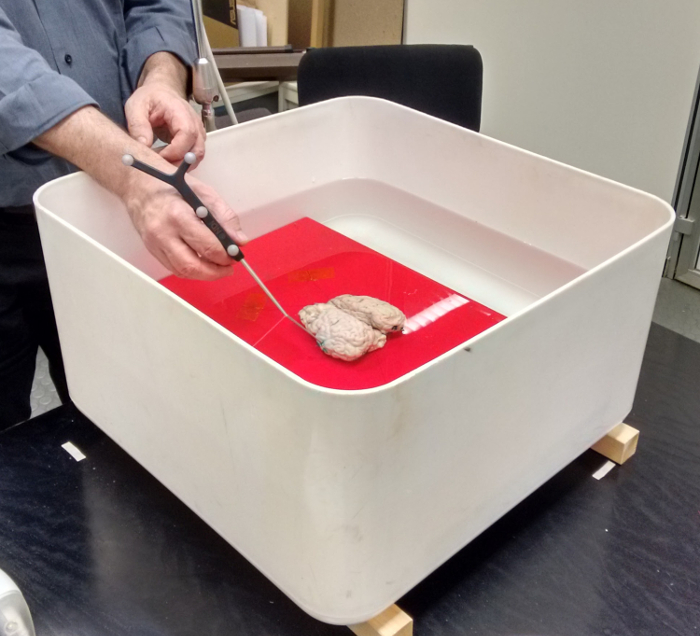
Figure 16: Acquisition of the positions of the glass spheres implanted in the bovine brain for calibration. The pointer tool tip is used to acquire, one by one, the positions of the 18 glass spheres implanted into the bovine brain immersed in water. These positions are used to compute the transformation from the motion tracking system space to the MR image space. Please click here to view a larger version of this figure.
7. Ultrasound acquisition
NOTE: The software routines in Python for Paraview, for the real-time visualization procedure, are available as open-source at https://bitbucket.org/unipv/denecor-tracking.
- Acquisition of US images of the predefined poses
- Clamp the markers onto the US probe and execute the calibration procedure (Sections 5.3 and 6.1). Position the brain and execute the calibration procedure (Sections 5.1 and 6.2).
- Collect the two rigid transformation parameters (US-to-marker and motion tracker-to-MR) computed in steps 6.1.5 and 6.2.3 and transfer these files into the folder of the real-time visualization procedure implemented in Python and the visualization software (Figure 10b).
- Start the real-time visualization procedure using the visualization software (see the open-source code) and verify that the actual position of the US probe is displayed correctly (Figure 17).
- Start the logging application for recording the position of the probe. Manually match each qualitatively predefined position, as displayed in the visualization software, with the US probe and acquire the corresponding image with the ULA-OP system (step 5.2.3). Stop the two applications and transfer all US images in ULA-OP format and motion tracker log files to the workstation.
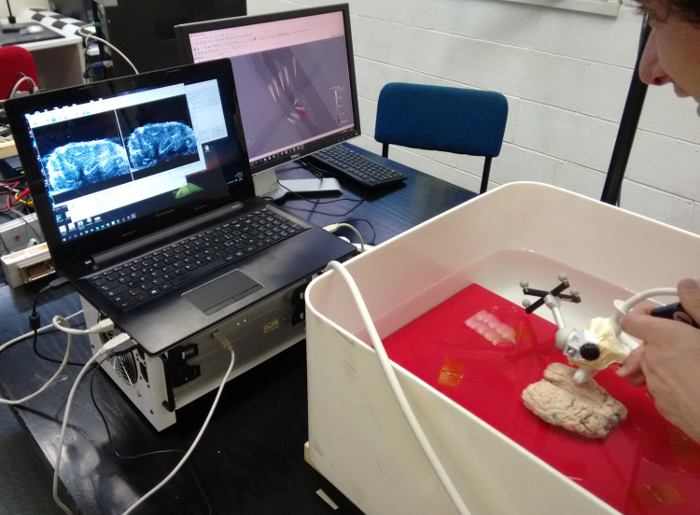
Figure 17: Acquisition of US images of the predefined poses. The operator moves the US probe to reach the predefined poses; the procedure is supported in real-time by a Python routine, which shows the probe position over the 3D MR image of the brain on the workstation display, using the visualization software. Please click here to view a larger version of this figure.
- Acquisition of freehand, moving poses with linear US probes for 3D image reconstruction
NOTE: The following steps are intended for linear US probes only and allow the acquisition of sequences of 2D planar US images which, together with positioning data from the motion tracking system, are needed for 3D volume reconstruction.- Clamp the markers onto the US probe and execute the calibration procedure (Sections 5.3 and 6.1). Position the brain and execute the calibration procedure (Sections 5.1 and 6.2).
- Manually position the US probe at the intended initial pose (e.g. the frontal end of each hemisphere). Start the acquisition of each US image sequence with the ULA-OP system (step 5.2.3) and the logging application for probe position recording.
- Apply a slow, freehand motion to the US probe towards the intended final pose (e.g. the distal end of each hemisphere of the brain). Stop the acquisition of US images with the ULA-OP system and stop the probe tracking. Transfer all US images in ULA-OP format and motion tracker log files to the workstation.
8. Post-processing and visualization
- Post-processing of freehand sequences of US image
NOTE: This procedure is implemented in MATLAB programming language and is applied to each freehand sequence of 2D US images in the ULA-OP format, to produce complete 3D images.- Load the sequence of US images in the ULA-OP format. Match the sequence of US images with the motion tracker log files. Extract a sequence of timed positions from the log files that are included in the temporal interval going from the start to the end of the acquisition process, as recorded by the ULA-OP system.
- Compute the exact timing of each US image in the sequence using the parameters recorded by the ULA-OP system.
- Compute the position associated to each US image in the sequence, by interpolating between the two closest timed positions recorded by the motion tracking system. Use linear interpolation between translation vectors and spherical linear interpolation (SLERP) between rotations, expressed as quaternions.
NOTE: Assume the median US image in the sequence - i.e. the image at the position that best partitions the sequence in two halves of (approximately) equal length - as a reference for defining the 3D US image frame. - Apply a logarithmic compression, normalize the image to its maximum, and apply a threshold (typically -60 dB) to each plane in the US image.
- With respect to the reference frame, compute and apply a relative spatial transform to each of the other US images in the sequence to obtain a bundle of spatially-located planes.
- Apply a linear interpolation routine to the structure of spatially-located planes to produce a Cartesian 3D array of voxels. Save the Cartesian 3D array of voxels as a .vtk file and record the interval timestamps that correspond to acquisition timing.
- Post-processing of other US images (not freehand sequences)
NOTE: The following procedure is applied to each US image in the ULA-OP format except to freehand sequences (Section 8.1).- Load the US image in the ULA-OP format. Apply a logarithmic compression, normalize the image to its maximum, and apply a threshold (typically -60 dB) to each plane in the US image.
- For 3D US images only, apply a linear interpolation routine (i.e. scan conversion) to the structure of spatially-located planes to produce a Cartesian 3D array of voxels.
- Save the image plane or the Cartesian 3D array of voxels as a .vtk file, recording the interval timestamps that correspond to acquisition timing.
- Registration of US images
NOTE: This section describes the procedures to perform the final registration of US and MR images, using the two transformations computed during previous calibration steps, and the position data of the US probe recorded during acquisitions. The software routines in the MATLAB programming language for registration of US images are available as open-source at https://bitbucket.org/unipv/denecor-transformations.- Load the US image in .vtk format.
- Match the timing of the US image with motion tracker log files. Extract a sequence of timed positions from the log files that are included in the temporal interval going from the start to the end of the acquisition process, as recorded in the .vtk image.
- Compute an average position for the US image. Use linear averaging for translation vectors and apply the algorithm described in reference35 for rotations, expressed as quaternions.
- Load the US-to-marker transformation that corresponds to the specific US image. Load the motion tracker-to-MR transformation which corresponds to the specific US image and the MR image of choice.
- Use the average position together with the above two transformations to compute the US-to-MR rigid registration transformation, and save the latter in different formats, including the translation and Euler angles that allow visualizing the US image in the MR image frame of choice.
- Visualization of registered US images
NOTE: These are the final steps to visualize the acquired US and MR images and to show them after superposition in the visualization software, using the previously computed transformations.- Start the visualization software and load the MR image of choice. Load all relevant US images. For each US image, create a Paraview Transform and apply the computed US-to-MR registration transformation (Figure 18) to the image data.
9. Calibration Models and Transformations
NOTE: This section describes the mathematical details of the calibration and transformation techniques used in the protocol presented. The experimental protocol involves four different frames of reference that have to be properly combined: 1) the US image frame, which depends on both the physical characteristics of the US probe and the scanner configuration, that associates spatial coordinates (x, y, z) to each voxel in an US image (for uniformity, all 2D planar images are assumed to have y=0); 2) the Marker (M) frame, which is inherent to the passive marker tool that is clamped to the US probe (Section 6.1); 3) the motion Tracking System (TS) frame, which is inherent to the tracking instrument; 4) the MR image (MRI) frame, which is defined by the scanner, that associates spatial coordinates (x, y, z) to each voxel in an MR image. For convenience and simplicity of notation, the procedures in this section are described using rotation matrices (i.e. direction cosine matrices) and not quaternions36.
- From US to M frame
NOTE: The experimental calibration procedure in Section 6.1 produces the following information: 1) 3D positions (p1, … , p6)TS of the 2 patterns of 3 spheres each, included in the agar phantom and measured in the motion tracker frame; 2) 3D positions of each of the same two patterns (p1, … , p3)US and (p4, … , p6)US measured in each of the two US images acquired; 3) one transformation (RM>TS, tM>TS), where R is a rotation matrix and t is a translation vector, measured by the positioning instrument, which describes the relative position of the passive marker tool (all rotations measured by the motion tracking system are reported as quaternions, which have to be translated into rotation matrices).- Apply the algorithm in reference37 to each of the two pairs of lists (p1, … , p3)US, (p1, … , p3) TS and (p4, … , p6)US, (p4, … , p6)TS, to obtain two transformations of the type (RUS>TS, tUS>TS), each corresponding to one specific US image space.
- Compute an estimate of the desired transformation (RUS>M, tUS>M) from each of the above transformations in the following way:
RUS>M = RTM>TS RUS>TS
tUS>M = RTM>TS (tUS>TS - tM>TS)
NOTE: The two estimates are combined by arithmetic averaging of the vectors tUS>M and averaging the rotation matrices RUS>M using the method in reference35, after having first translated matrices into quaternions and the resulting quaternions back into a rotation matrix.
- Compute an estimate of the desired transformation (RUS>M, tUS>M) from each of the above transformations in the following way:
- Apply the algorithm in reference37 to each of the two pairs of lists (p1, … , p3)US, (p1, … , p3) TS and (p4, … , p6)US, (p4, … , p6)TS, to obtain two transformations of the type (RUS>TS, tUS>TS), each corresponding to one specific US image space.
- From motion tracking system to MRI frame
NOTE: The procedure in Section 6.2 produces the following information: 1) 3D positions (p1, … , p18)TS of the 6 patterns of 3 spheres each included in the bovine brain, measured in the motion tracking system frame; 2) 3D positions of the same 18 spheres (p1, … , p18)MRI measured in the target MR image.- Directly compute the desired transformation (RTS>MRI, tTS>MRI) by applying the algorithm in37 to the two lists of positions.
- From US to MRI frame
NOTE: The US image acquisition procedure described in Section 7 produces images for which, after resolving the timestamps associated against the motion tracker log-files, the transformation (RM>TS, tM>TS) is computed directly.- Compute the desired transformation in the following way:
RUS>MRI = RTS>MRI RM>TS RUS>M
tUS>MRI = RTS>MRI (RM>TS tUS>M + tM>TS) + tTS>MRI
- Compute the desired transformation in the following way:
Access restricted. Please log in or start a trial to view this content.
Results
The main result achieved via the described protocol is the experimental validation of an effective and repeatable assessment procedure for the 2D and 3D imaging capabilities of US probe prototypes based on CMUT technology, in the prospective application to brain imaging. After implementing all the described protocol steps, an expert can then apply the visualization software functions (e.g. free orientation slicing, subset extraction, volume interpolation, etc.) to compar...
Access restricted. Please log in or start a trial to view this content.
Discussion
Several works have been presented in the literature describing techniques that are similar or related to the protocol presented. These techniques are also based on the use of realistic targets, including fixed animal or cadaver brains, but they are mainly conceived for testing of digital registration methods of various sorts.
The protocol described here, however, has the specific purpose of testing US probes in different configurations in the early stages of development and, due to this, it fu...
Access restricted. Please log in or start a trial to view this content.
Disclosures
The authors declare they have no competing financial interests.
Acknowledgements
This work has been partially supported by the National governments and the European Union through the ENIAC JU project DeNeCoR under grant agreement number 324257. The authors would like to thank Prof. Giovanni Magenes, Prof. Piero Tortoli and Dr. Giosuè Caliano for their precious support, supervision, and insightful comments that made this work possible. We are also grateful to Prof. Egidio D'Angelo and his group (BCC Lab.), together with Fondazione Istituto Neurologico C. Mondino, for providing the motion tracking and MR instrumentation, and to Giancarlo Germani for MR acquisitions. Finally, we'd like to thank Dr. Nicoletta Caramia, Dr. Alessandro Dallai and Ms. Barbara Mauti for their valuable technical support and Mr. Walter Volpi for providing the bovine brain.
Access restricted. Please log in or start a trial to view this content.
Materials
| Name | Company | Catalog Number | Comments |
|---|---|---|---|
| ULA-OP | University of Florence | N/A | Ultrasound imaging research system |
| 3D imaging piezeoelectric probe | Esaote s.p.a. | 9600195000 | Mechanically-swept 3D ultrasound probe, model BL-433 |
| Linear-array piezoelectric probe | Esaote s.p.a. | 122001100 | Ultrasound linear array probe, model LA-533 |
| CMUT probe | University Roma Tre | N/A | Ultrasound linear array probe based on CMUT technology |
| MAGNETOM Skyra 3T MR scanner | Siemens Healthcare | N/A | MR scanner |
| Head coil | Siemens Healthcare | N/A | 32-channel head coil for MR imaging |
| NDI Polaris Vicra | NDI Medical | 8700335001 | Optical motion tracking system |
| Pointer tool | NDI Medical | 8700340 | Passive pointer tool with 4 reflecting markers |
| Clamp-equipped tool | NDI Medical | 8700399 | Rigid body with 4 reflecting markers and a clamp to be connected to the US probe handle |
| Bovine brain | N/A | N/A | Brain of an adult bovine, from food suppliers |
| Formalin solution | N/A | N/A | 10% buffered formalin solution for bovine brain fixation - CAUTION, formalin is a toxic chemical substance and must be handled with care; specific regulations may also apply (see for instance US OSHA Standard 1910.1048 App A) |
| Plastic container for anatomical parts | N/A | N/A | Cilindrical plastic container with lid |
| Glass spheres | N/A | N/A | 3 mm diameter spheres of Flint glass |
| Agar | N/A | N/A | 30 g, for phantom preparation |
| Glycerine | AEFFE Farmaceutici | A908005248 | 100 g, for phantom preparation |
| Distilled water | Solbat Gaysol | 8027391000015 | 870 g, for phantom preparation |
| Beaker | N/A | N/A | Beaker used for the diluition of glycerine and agar in distilled water |
| Lysoform | Lever | 8000680500014 | A benzalkonium chloride and water solution was used for the agar phantom preservation |
| Polystyrene mannequin head | N/A | N/A | Polyestirene model which was cutted and used to design the configuration of spheres'patterns |
| Green tissue marking dye for histology | N/A | N/A | Colour used to mark the glass spheres' positions on the bovine brain surface |
| Yellow enamel | N/A | N/A | Enamel used to colour the glass spheres implanted in the agar phantom |
| Water tank | N/A | N/A | 50x50x30 cm plastic tank filled with degassed water up to a 15 cm height |
| Mechanical arm | Esaote s.p.a. | N/A | Mechanical arm clamped to the water tank border and used to held the probe in fixed positions |
| Plate of synthetic resin | N/A | N/A | Plate used as a support for the bovine brain positioning in the water tank |
| Sewing threads | N/A | N/A | Sewing thread segments used to immobilize the brain on the resin plate |
| Adhesive tape | N/A | N/A | Adhesive tape used to fix the sewing thread extremities onto the resin plate |
| Plastic food container | N/A | N/A | Sealed food container used for the agar phantom |
| Notebook | Lenovo | Z50-70 | Lenovo Z50-70, Intel(R) Core i7-4510U @ 2.0 GHz, 8 GB RAM |
| Workstation | Dell Inc. | T5810 | Intel(R) Xeon(R) CPU E3-1240v3 @ 3.40 GHz, 16 GB RAM |
| Matlab | The MathWorks | R2013a | Software tool, used for space transformation computation and 3D reconstruction from image planes |
| Paraview | Kitware Inc. | v. 4.4.1 | Open-source software for 3D image processing and visualization |
| NDI Toolbox - ToolTracker Utility | NDI Medical | v. 4.007.007 | Software for marker position visualization and tracking in the NDI Polaris Vicra measurement volume |
| C++ data-logging software | NDI Medical | v. 4.007.007 | Software for marker position recording on a text log file |
| ULA-OP software | University of Florence | N/A | Software for real-time display and control of the ULA-OP system |
References
- Matrone, G., Savoia, A. S., Terenzi, M., Caliano, G., Quaglia, F., Magenes, G. A Volumetric CMUT-Based Ultrasound Imaging System Simulator With Integrated Reception and µ-Beamforming Electronics Models. IEEE Trans. Ultrason. Ferroelectr. Freq. Control. 61 (5), 792-804 (2014).
- Pappalardo, M., Caliano, G., Savoia, A. S., Caronti, A. Micromachined ultrasonic transducers. Piezoelectric and Acoustic Materials for Transducer Applications. , Springer. 453-478 (2008).
- Oralkan, O. Capacitive micromachined ultrasonic transducers: Next-generation arrays for acoustic imaging? IEEE Trans. Ultrason. Ferroelectr. Freq. Control. 49 (11), 1596-1610 (2002).
- Savoia, A., Caliano, G., Pappalardo, M. A CMUT probe for medical ultrasonography: From microfabrication to system integration. IEEE Trans. Ultrason. Ferroelectr. Freq. Control. 59 (6), 1127-1138 (2012).
- ENIAC JU project DeNeCoR website. , http://www.denecor.info (2017).
- Ramalli, A., Boni, E., Savoia, A. S., Tortoli, P. Density-tapered spiral arrays for ultrasound 3-D imaging. IEEE Trans. Ultrason. Ferroelectr. Freq. Control. 62 (8), 1580-1588 (2015).
- Lazebnik, R. S., Lancaster, T. L., Breen, M. S., Lewin, J. S., Wilson, D. L. Volume registration using needle paths and point landmarks for evaluation of interventional MRI treatments. IEEE Trans. Med. Imag. 22 (5), 653-660 (2003).
- Dawe, R. J., Bennett, D. A., Schneider, J. A., Vasireddi, S. K., Arfanakis, K. Postmortem MRI of human brain hemispheres: T2 relaxation times during formaldehyde fixation. Magn. Reson. Med. 61 (4), 810-818 (2009).
- Chen, S. J., et al. An anthropomorphic polyvinyl alcohol brain phantom based on Colin27 for use in multimodal imaging. Mag. Res. Phys. 39 (1), 554-561 (2012).
- Farrer, A. I. Characterization and evaluation of tissue-mimicking gelatin phantoms for use with MRgFUS. J. Ther. Ultrasound. 3 (9), (2015).
- Choe, A. S., Gao, Y., Li, X., Compton, K. B., Stepniewska, I., Anderson, A. W. Accuracy of image registration between MRI and light microscopy in the ex vivo brain. Magn. Reson. Imaging. 29 (5), 683-692 (2011).
- PVA brain phantom images website. , http://pvabrain.inria.fr (2017).
- Gobbi, D. G., Comeau, R. M., Peters, T. M. Ultrasound probe tracking for real-time ultrasound/MRI overlay and visualization of brain shift. Int. Conf. Med. Image Comput. Comput. Assist. Interv (MICCAI) n. 920, 927(1999).
- Ternifi, R. Ultrasound measurements of brain tissue pulsatility correlate with the volume of MRI white-matter hyperintensity. J. Cereb. Blood Flow. Metab. 34 (6), 942-944 (2014).
- Unsgaard, G. Neuronavigation by Intraoperative Three-dimensional Ultrasound: Initial Experience during Brain Tumor Resection. Neurosurgery. 50 (4), 804-812 (2002).
- Pfefferbaum, A. Postmortem MR imaging of formalin-fixed human brain. NeuroImage. 21 (4), 1585-1595 (2004).
- Schulz, G. Three-dimensional strain fields in human brain resulting from formalin fixation. J. Neurosci. Meth. 202 (1), 17-27 (2011).
- Ahrens, J., Geveci, B., Law, C. ParaView: An End-User Tool for Large Data Visualization. Visualization Handbook. , Elsevier. (2005).
- Cloutier, G. A multimodality vascular imaging phantom with fiducial markers visible in DSA, CTA, MRA, and ultrasound. Med. Phys. 31 (6), 1424-1433 (2004).
- Boni, E. A reconfigurable and programmable FPGA-based system for nonstandard ultrasound methods. IEEE Trans. Ultrason. Ferroelectr. Freq. Control. 59 (7), 1378-1385 (2012).
- Bagolini, A. PECVD low stress silicon nitride analysis and optimization for the fabrication of CMUT devices. J. Micromech. Microeng. 25 (1), (2015).
- Savoia, A. Design and fabrication of a cMUT probe for ultrasound imaging of fingerprints. Proc. IEEE Int. Ultrasonics Symp. , 1877-1880 (2010).
- Fenster, A., Downey, D. B. Three-dimensional ultrasound imaging. Annu. Rev. Biomed. Eng. 2, 457-475 (2000).
- Matrone, G., Ramalli, A., Savoia, A. S., Tortoli, P., Magenes, G. High Frame-Rate, High Resolution Ultrasound Imaging with Multi-Line Transmission and Filtered-Delay Multiply And Sum Beamforming. IEEE Trans. Med. Imag. 36 (2), 478-486 (2017).
- Matrone, G., Savoia, A. S., Caliano, G., Magenes, G. Depth-of-field enhancement in Filtered-Delay Multiply and Sum beamformed images using Synthetic Aperture Focusing. Ultrasonics. 75, 216-225 (2017).
- Boni, E., Cellai, A., Ramalli, A., Tortoli, P. A high performance board for acquisition of 64-channel ultrasound RF data. Proc. IEEE Int. Ultrasonics Symp. , 2067-2070 (2012).
- Matrone, G., Savoia, A. S., Caliano, G., Magenes, G. The Delay Multiply and Sum beamforming algorithm in medical ultrasound imaging. IEEE Trans. Med. Imag. 34, 940-949 (2015).
- Savoia, A. S. Improved lateral resolution and contrast in ultrasound imaging using a sidelobe masking technique. Proc. IEEE Int. Ultrasonics Symp. , 1682-1685 (2014).
- Gyöngy, G., Makra, A. Experimental validation of a convolution- based ultrasound image formation model using a planar arrangement of micrometer-scale scatterers. IEEE Trans. Ultrason. Ferroelectr. Freq. Control. 62 (6), 1211-1219 (2015).
- Shapoori, K., Sadler, J., Wydra, A., Malyarenko, E. V., Sinclair, A. N., Maev, R. G. An Ultrasonic-Adaptive Beamforming Method and Its Application for Trans-skull Imaging of Certain Types of Head Injuries; Part I: Transmission Mode. IEEE Trans. Biomed. Eng. 62 (5), 1253-1264 (2015).
- Salles, S., Liebgott, H., Basset, O., Cachard, C., Vray, D., Lavarello, R. Experimental evaluation of spectral-based quantitative ultrasound imaging using plane wave compounding. IEEE Trans. Ultrason. Ferroelectr. Freq. Control. 61 (11), 1824-1834 (2014).
- Alessandrini, M. A New Technique for the Estimation of Cardiac Motion in Echocardiography Based on Transverse Oscillations: A Preliminary Evaluation In Silico and a Feasibility Demonstration In Vivo. IEEE Trans. Med. Imag. 33 (5), 1148-1162 (2014).
- Ramalli, A., Basset, O., Cachard, C., Boni, E., Tortoli, P. Frequency-domain-based strain estimation and high-frame-rate imaging for quasi-static elastography. IEEE Trans. Ultrason. Ferroelectr. Freq. Control. 59 (4), 817-824 (2012).
- NDI Polaris Vicra optical tracking system website. , http://www.ndigital.com/medical/polaris-family (2017).
- Markley, F. L., Cheng, Y., Crassidis, J. L., Oshman, Y. Averaging quaternions. J. Guid. Cont. Dyn. 30 (4), 1193-1197 (2007).
- Dorst, L., Fontijne, D., Mann, S. Geometric Algebra for Computer Science. An Object-oriented Approach to Geometry. , A Volume in the Morgan Kaufmann Series in Computer Graphics (2007).
- Horn, B. K. P. Closed-form solution of absolute orientation using unit quaternions. J. Opt. Soc. Am. A. 4 (4), 629-642 (1987).
Access restricted. Please log in or start a trial to view this content.
Reprints and Permissions
