Bacterial cells are spatially highly organized. To follow this organization over time in slow growing Myxococcus xanthus cells, a set-up for fluorescence live-cell imaging with high spatiotemporal resolution over several generations was developed. Using this method, spatiotemporal dynamics of important proteins for chromosome segregation and cell division could be determined.
Method Article
Fluorescence Live-cell Imaging of the Complete Vegetative Cell Cycle of the Slow-growing Social Bacterium Myxococcus xanthus
In This Article
Summary
Abstract
Fluorescence live-cell imaging of bacterial cells is a key method in the analysis of the spatial and temporal dynamics of proteins and chromosomes underlying central cell cycle events. However, imaging of these molecules in slow-growing bacteria represents a challenge due to photobleaching of fluorophores and phototoxicity during image acquisition. Here, we describe a simple protocol to circumvent these limitations in the case of Myxococcus xanthus (which has a generation time of 4 - 6 h). To this end, M. xanthus cells are grown on a thick nutrient-containing agar pad in a temperature-controlled humid environment. Under these conditions, we determine the doubling time of individual cells by following the growth of single cells. Moreover, key cellular processes such as chromosome segregation and cell division can be imaged by fluorescence live-cell imaging of cells containing relevant fluorescently labeled marker proteins such as ParB-YFP, FtsZ-GFP, and mCherry-PomX over multiple cell cycles. Subsequently, the acquired images are processed to generate montages and/or movies.
Introduction
Bacterial cells are spatially highly organized with many proteins localizing asymmetrically within cellular compartments1,2,3,4. This localization is often highly dynamic and changes over time in response to cell cycle cues or external signals. Equally, the bacterial chromosome is spatially highly organized with individual loci being positioned to specific subcellular locations before and during the segregation process5. This dynamic spatial organization is important for growth, division, cell cycle regulation, differentiation, motility, signal transduction as well as chromosome organization and segregation; thus, it affects essentially all aspects of bacterial function.
The spatiotemporal dynamics of these cellular processes are being analyzed in a variety of different bacterial species with Escherichia coli, Bacillus subtilis, Vibrio cholerae, and Caulobacter crescentus serving as important model organisms. However, these four species cover only a small spectrum of the enormous bacterial diversity and, perhaps unsurprisingly given the large phylogenetic distance between these species, cellular organization and polarization mechanisms are different in these bacteria. This raises the need for studying additional bacterial species to be able to eventually extract general principles underlying the spatiotemporal dynamics of bacterial cells.
The Gram-negative delta-proteobacterium M. xanthus is a model organism in the study of social behaviors and cooperation in bacteria6. M. xanthus is a strict aerobe and in the presence of nutrients, it forms colonies in which cells spread outwards in a highly coordinated, swarming fashion and preys on other microorganisms7. In response to nutrient starvation, cells initiate a developmental program that results in the formation of fruiting bodies that consists of thousands of cells, and inside which, the rod-shaped motile cells differentiate to spherical diploid spores8. Both types of behaviors, i.e., swarming and fruiting body formation, are only executed by cells that are placed on a solid surface. Moreover, under both nutrient conditions, cells engage in processes that involve direct cell-cell contacts including the exchange of outer membrane lipoproteins that may stimulate motility or function as toxins in the recipient9,10, the exchange of LPS11, stimulation of motility by exopolysaccharides on neighboring cells12, and intercellular signaling by a cell surface-anchored signaling protein13,14.
Recently, M. xanthus has also become a model organism for studying the mechanisms underlying motility and its regulation15, cell division16,17,18, and chromosome organization19,20,21. Critical steps in the M. xanthus cell cycle have been analyzed in detail by fluorescence microscopy using snap-shot images or short time-lapse recordings on strains carrying relevant fluorescently labeled proteins16,17,18,19,20. Ideally, many cells should be followed with single-cell resolution by fluorescence live cell imaging for at least one full cell cycle to obtain robust quantitative data on cell cycle parameters. However, this is a challenge in the case of M. xanthus due to its relatively long generation time of 4 - 6 h under standard laboratory conditions and due to photobleaching of fluorophores and phototoxicity during image acquisition.
Here, we describe a protocol to follow M. xanthus cells with single cell resolution by fluorescence live-cell imaging for at least 24 h and covering several cell cycles. Importantly, during the entire protocol, cells are maintained on an agar pad and in close contact allowing for the contact-dependent activities essential for the social life style of M. xanthus. The protocol also allows users to monitor shape, size, divisions, and fluorescent probes at a high temporal resolution and with single cell resolution, and thus, enables the quantification of cell-to-cell variability and correlations of cell cycle events.
Protocol
1. Preparation and Growth of M. xanthus Strains
Note: See Table 1 and Table 2.
- Prepare 1% casitone broth (CTT) growth medium 1% (w/v) pancreatic digest of casein (e.g., Bacto casitone), 10 mM Tris-HCl pH 8.0, 1 mM KH2PO4 pH 7.6, 8 mM MgSO422, supplemented with kanamycin (50 µg/mL) or oxytetracycline (10 µg/mL). Add gentamycin (10 µg/mL) to all media to reduce the risk of contamination with other bacteria, since M. xanthus cells are naturally resistant to it.
- Inoculate 5 mL of 1% CTT containing the relevant antibiotic(s) with a single freshly grown colony of wild type (WT) DK1622 23, SA4420 (ΔmglA)24, SA4797 (ΔmglA, ΔpomX/PpomZ mCherry-pomX)16, SA8241 (ΔmglA, ftsZ+/PnatftsZ-gfp), or SA4749 (ΔmglA, parB+/PnatparB-yfp) in the morning of day 1.
- Resuspend a single M. xanthus colony in 500 µL of 1% CTT supplemented with antibiotics in a sterile tube and transfer the entire suspension to a 50 mL Erlenmeyer flask containing 5 mL of 1% CTT.
NOTE: Use an Erlenmeyer flask with 10 times the volume of the culture to guarantee sufficient aeriation and optimal growth.
- Resuspend a single M. xanthus colony in 500 µL of 1% CTT supplemented with antibiotics in a sterile tube and transfer the entire suspension to a 50 mL Erlenmeyer flask containing 5 mL of 1% CTT.
- Grow the cells for eight generations (approximately 40 - 48 h with a generation time of 4 - 6 h) at 32 °C, shaking at 220 rpm, in the dark. Maintain cells in the exponential growth phase (OD550 <1.2) and prevent them from reaching the stationary phase. If needed, dilute the cells into fresh 1% CTT medium containing the relevant antibiotic(s) to an OD550 of 0.1 - 0.2.
NOTE: An optimal OD550 for a single cell microscopy is 0.5 - 0.7. At this OD550, a sufficient number of cells is present per image to allow quantification as well as statistical analysis of cellular parameters.
2. Preparation of Microscopy Samples
Note: Cells to be viewed by microscopy are placed on a microscope coverslip and then covered by an agarose pad containing nutrients. The coverslip is glued to a plastic or metal frame to provide mechanical support. In preparation for the microscopy, a large pad of 1% agarose/TPM/0.2% CTT should be prepared in advance as described in steps 2.1 - 2.3. Please also refer to the Table of Materials for specific products used here.
- Prepare 500 mL of TPM buffer (10 mM Tris-HCl pH 7.6, 1 mM KH2PO4 pH 7.6, 8 mM MgSO4) and autoclave or filter sterilize using a bottle top filter.
NOTE: The sterile buffer can be stored for several months at room temperature. - Prepare 1% agarose microscopy solution containing 0.2% CTT (mix 1 g of agarose with 80 mL of TPM buffer and 20 mL of 1% CTT medium). Heat in a microwave oven until the agarose is molten.
NOTE: The 0.2% CTT is sufficient to allow cells to grow and prevent starvation. Higher concentrations of CTT in the microscopy medium will result in high background fluorescence. - Fill a Petri dish with the molten agarose to a thickness of 0.5 cm (for an 11.5 cm x 11.5 cm square Petri dish, approximately 60 mL of molten agarose is required) and let it cool down to room temperature.
NOTE: The agarose pad can be stored at 4 °C in a humid environment for up to 2 days.- Pre-warm the 1% agarose/TPM/0.2% CTT pad at 32 °C for at least 15 min prior to use.
NOTE: To prepare the cells for microscopy, follow steps 2.4 - 2.8.
- Pre-warm the 1% agarose/TPM/0.2% CTT pad at 32 °C for at least 15 min prior to use.
- Place a sterile glass coverslip (60 mm x 22 mm, thickness: 0.7 mm) on a plastic or metal frame that has a hole in the middle (Figure 1A); this frame serves as a mechanical support for the thin coverslip and helps to reduce drift during microscopy. Fix the coverslip to the frame with tape.
- To prepare the frame, cut out a 75 mm × 25 mm frame from a 1 mm thick metal plate, then cut out an appropriately sized hole (20 mm × 30 mm in this experiment) in the middle.
- Add 10 - 20 µL of exponentially grown M. xanthus cells on the coverslip.
- Add fluorescent 0.5 µm microspheres as fiducial markers to the cells to simplify tracking of cells or proteins in time-lapse recordings.
- Dilute the microspheres 1:100 in TPM buffer and store at 4 °C for up to several months. Shake thoroughly before use and add 5 - 10 µL of the diluted microspheres to the cells.
NOTE: Here microspheres that are fluorescent in all common blue, green, yellow, and red fluorescent channels were used.
- Dilute the microspheres 1:100 in TPM buffer and store at 4 °C for up to several months. Shake thoroughly before use and add 5 - 10 µL of the diluted microspheres to the cells.
- Cut out a small pad approximately the size of the coverslip of the large pre-warmed 1% agarose/TPM/0.2% CTT pad and place it on top of the cells (Figure 1B). Place a coverslip on top of the 1% agarose/TPM/0.2% CTT agarose pad to prevent evaporation and to maintain cells in a humid environment.
NOTE: The coverslip alone will prevent significant evaporation for at least 2 h. For longer time-lapse recordings, the 1% agarose/TPM/0.2% CTT pad and coverslip sandwich should be sealed with paraffin film to prevent evaporation. - Incubate the microscopy sample at 32 °C for 15 - 20 min to let the cells attach to the bottom of the agarose pad. Then start the time-lapse microscopy recordings.
3. Microscope Set-up and Time-lapse Acquisition
Note: The protocol described here was developed for an inverted widefield microscope with autofocus, a 100X/1.30 NA oil PH3 objective, an X, Y motorized stage, a sCMOS camera, a light source, filters for green-fluorescent, red-fluorescent, or yellow-fluorescent proteins, and a temperature controlled incubation chamber. This chamber keeps cells protected from light and at constant temperature.
- Pre-heat the incubation chamber and the microscope to 32 °C for ~1 - 2 h before starting microscopy.
NOTE: Depending on the microscope set-up, heating may take longer. Pre-heating is essential to reduce drift and stabilizes the autofocus control system. - Switch on the microscope and start the microscope control software. Select the correct objective and the correct mirrors and filters to acquire phase contrast images as well as images of green-fluorescent, red-fluorescent, or yellow-fluorescent proteins.
NOTE: A microscope is typically supplied with a preferred software for microscope control and image acquisition. Here a commercially available software (see the Table of Materials) was used to control the microscope and image acquisition. - Add a drop of high quality immersion oil onto the lens of the objective and to the bottom of the sample pre-incubated at 32 °C. Place the objective at the lowest possible Z-position to avoid damaging the objective lens when the sample is placed on the microscope stage. Place the metal-frame with the sample onto the microscope stage and with the "hole-side" towards the objective. Fasten the sample securely in the stage holder.
- Focus on the cells by moving the stage in the Z-direction closer to the objective. Move the stage slower when the oil drops on the sample bottom side and the objective lens make contact. Move the stage in the X/Y direction until multiple single cells are visible in the region of view, when cells are in the focal plane. Make sure that at least one fluorescent microsphere is in the region of view in order to later align the acquired images.
NOTE: Under optimal conditions, a cell density of 15 - 30 cells per region of view (2,048 x 2,048 pixel or 133.1 x 133.1 µm) should be reached. - Open the Multi-Dimensional Acquisition wizard of the microscope control software to set up a time lapse experiment that allows the microscope to acquire images at multiple wavelengths and stage positions if required.
- In the Main tab activate Timelapse and Multiple Wavelengths. Additional tabs will appear on the left side of the window.
- Click on the Saving tab and Select Directory to select an empty folder on the computer hard drive to save the acquired images. Activate Increment base name if file exists to make sure that consecutive datasets do not overwrite earlier ones. Then give the experiment a name with date and the strain name or title of the experiment.
- Click on the Timelapse tab to adjust the time-lapse parameters. Set Duration to 24 h and set Time Interval to 20 min. The Number of Time Points will change automatically.
NOTE: The optimal time-interval depends on the experiment and the cellular function to be analyzed. Frequent image acquisitions may cause photobleaching. Thus, a trade-off between temporal resolution and photobleaching must be empirically found. At a doubling time of 4 - 6 h, images can be easily acquired at an interval of 5 min (or even smaller intervals if desired) for phase contrast microscopy. If fluorescence microscopy over a time-course of 24 h is desired images should be recorded at an interval of approximately 15 - 30 min. - Click on the Wavelengths tab. Select the number of wavelengths to acquire for each image at each time point by changing the number.
NOTE: For each wavelength, a new tab will appear on the left side of the Multi-Dimensional Acquisition" wizard and wavelengths will be acquired in the order from top to bottom. For each wavelength, the acquisition settings can be modified separately. - Click the first wavelength tab from the top. Select Phase contrast in the Illumination drop-down list. Select 100 ms for Exposure and select Every Time Point in the Acquire drop-down list. Deactivate Auto Expose by selecting Never in the drop-down list.
- Repeat step 3.5.5 for each wavelength that needs to be acquired at each time point. For the experimental set-up and fluorescently labeled proteins described here, use the following parameters for Exposure: 250 ms for mCherry fusion proteins, 200 ms for YFP fusion proteins, and 1,000 ms for GFP fusion proteins.
NOTE: The optimal illumination settings for each strain and fluorescent protein should be determined in advance by changing the lamp intensity and the image acquisition time for each wavelength. Too long image acquisition times will increase the phototoxic effect and ultimately lead to growth arrest and cell death. Therefore, a trade-off between image quality and cell viability should be achieved. - Acquire images from multiple stage positions to increase the number of cells recorded in the same experiment.
- To acquire images from multiple stage positions, activate Multiple Stage Positions in the Main tab. Then click on the Stage tab and click the Live button to look at the field of view.
- Move the stage in the X/Y-direction until a region of interest (ROI) is in the field of view. Save the X- and Y-coordinates by clicking the "+" in the Stage tab. Move the stage again in the X/Y-direction until a new ROI is found and save the coordinates again by clicking the "+". Go on until the desired number of regions is saved.
NOTE: In case of fluorescence image acquisition, make sure that regions of interest (ROIs) are not too close to each other to minimize phototoxicity.
- Check once more that the cells are in focus by clicking on the different saved X- and Y-positions and start the hardware autofocus by clicking AFC hold to keep the saved Z-position constant over the course of the experiment.
- Start the time-lapse recordings in the microscope control software by clicking Acquire in the Multi-Dimensional Acquisition wizard.
NOTE: One window will appear for each wavelength that is acquired and an additional window will appear that shows the number of acquired time points and the time until the next picture acquisition. - Check that the cells are still in focus after the first few time-points in the time-lapse recordings to maximize the quality of the images and refocus if required.
4. Generation of Time-lapse Movies and Image Alignment
Note: Several commercial and free software packages are available for image acquisition and image analysis. We use a commercially available software (see the Table of Materials) with multiple pre-installed plugins and additional tools.
- Save the individual images from time-lapse recordings on a computer that has the image analysis/processing software installed.
- Start the software and open images as a stack by clicking Review Multi-Dimensional Data | Select Base File | Select Directory. Open the folder with the multi-dimensional data. Check the dataset and click View; the dataset will be shown as single images from time point one until the end. Activate the wavelength (for creating a stack), select all images that should be in the stack and click Load Image(s). Repeat this step for all wavelengths and save completed stacks.
- (Optional) Open all images required for the movie using File | Open.
NOTE: It is recommended to open images by one acquired wavelength at a time to not slow down the computer if computational power is limited. If certain parts of the time-lapse recordings, e.g., the start, the end, or several time points should be skipped, then this can be adjusted in the completed movie. - Activate the stack of images that needs to be corrected for drift. Open the alignment tool by Apps | Auto Align…. Check Stack as the source for the images and first plane/time point as the reference plane. Select the stack with the Source stack button and click Apply.
NOTE: The automatic alignment will take some time and computational power but is a good way to correct big stacks for drift of the microscope set-up. This automatic alignment works well if microspheres are included but might also work without them. - Save the aligned stack.
- Use ROIs.
NOTE: Fluorescent time-lapse microscopy easily creates large sets of data files that take up a lot of computational power and slow down the downstream processing of these movies. We therefore strongly recommend to identify ROIs and isolate cells to work with smaller files.- Select the Rectangular Region tool. Create an ROI around the cells of interest by manually drawing an ROI on the phase contrast image. Make sure that the cells of interest are visible and in focus throughout the whole time-lapse movie.
- Open the time-lapse movie of the second wavelength of the same dataset. To transfer the ROI from the phase contrast pictures to the fluorescence images of the second wavelength use the Transfer Regions tool with Regions | Transfer Regions. Select the phase contrast dataset as Source Image and the second wavelength dataset as Destination Image. Select All Regions and press OK.
- Repeat step 4.6.2 for each wavelength acquired for the same dataset.
- Select the ROI and duplicate it as a stack with Edit | Duplicate | Stack… or press Shift + Ctrl + D keys. Then save the duplicated stack with File | Save into the same folder as the original data.
- Repeat step 4.6.4 for each ROI of every wavelength acquired for the same dataset
- To generate a movie in MOV or AVI formats, open the Make Movie function via Stack | Make Movie. Select the time-lapse recordings with the Source Stack button. Select the output format, the frame rate, the number of frames, and click Save.
Results
M. xanthus is a slow growing bacterium that moves on solid surfaces. To test our experimental set-up, we performed a time-lapse experiment with motile DK1622 WT cells. Phase contrast images were acquired at intervals of 5 min for 24 h (Figure 2A, B). The majority of cells aligned in groups. As expected, cells displayed motility and predominantly moved in groups. We further observed that cells occasionally reversed direction of movement. These findings suggest that WT cells under the tested conditions behave normally in terms of cell motility. However, even when cells are recorded every 5 min, the identification of individual cells is difficult. Moreover, because cells are motile, many cells escape or enter the field of view making it difficult to follow cells for extended periods.
In order to trace the same M. xanthus cells for several rounds of the cell cycle by live-cell imaging, individual strains can be deleted for the mglA gene, which is essential for motility25. This prevents cells from moving out of the field of view during the imaging protocol. In-frame deletions are generated as described by Shi et al.26
As expected, in phase contrast live-cell imaging with non-motile ΔmglA cells (Figure 3), cells did not display active movement. We were able to follow the growth and division of individual cells during microcolony formation. Based on the time-lapse recordings in which images were acquired at intervals of 5 min for 24 h, it was possible to quantify the interdivision time (the time between two cell division events) with single cell resolution. Cells of the ΔmglA mutant had an inter-division time of 235 ± 50 min (n = 97 cells). With approximately 4 h, the interdivision time is similar to the doubling time measured in suspension cultures for WT cells. This provides evidence that M. xanthus cells grow optimally under these experimental conditions.
To investigate whether our set-up allows cells to grow normally while tracking YFP-labeled proteins over long periods, we performed fluorescence time-lapse imaging with M. xanthus cells that express a YFP-tagged protein. To this end, we followed ParB-YFP as a marker for the origin of replication (ori). ParB is as component of the ParABS system in M. xanthus and binds to the parS sites proximal to the ori; therefore, the origin duplication and chromosome segregation can be followed19,20,21. With image acquisition (phase contrast and fluorescence, 200 ms acquisition time in YFP channel) every 20 min, cells grew, divided, and displayed growth even at 24 h (Figure 4A). At the start of the recordings, ParB-YFP formed two clusters in the subpolar regions in the majority of cells (Figure 4A). Shortly before or after cell division, the subpolar ParB-YFP cluster at the old cell pole duplicated. One of the two clusters remained at the old cell pole while the second copy translocated to the new cell pole, reaching its final subpolar position after approximately 40 - 60 min (Figure 4A, B). These observations are in agreement with previous data generated from short time-lapse recordings using thin agar pads19. We conclude that this experimental set-up allows fluorescence time-lapse microscopy to track chromosome segregation over several cell cycles in slow growing M. xanthus cells, without perturbing cell growth or the chromosome segregation machinery.
In a similar experiment, we sought to follow markers for cell division by time-lapse fluorescence microscopy. Similar to nearly all other bacteria, M. xanthus requires FtsZ, a bacterial tubulin-like GTPase, for cell division16,17,18. FtsZ forms a ring-like structure at midcell, the so-called Z-ring, that helps to recruit all other proteins required for cell division27,28. In M. xanthus, the formation of the Z-ring and its positioning at midcell is stimulated by the three PomXYZ proteins16,17. These three proteins form a chromosome-associated complex that transfers across the nucleoid from the site of cell division in the "mother" cell to the middle of the nucleoid in the two daughter cells. The middle of the nucleoid coincides with midcell, before chromosome segregation, and here the PomXYZ complex recruits FtsZ and stimulates Z-ring formation.
Here, we first followed non-motile cells expressing ftsZ-gfp. Because FtsZ-GFP overall shows a weaker fluorescence signal than ParB-YFP, we increased the exposure time 5-fold to 1 s in the GFP channel. As expected, strong accumulation of FtsZ-GFP was only observed at midcell and this localization dictated the position of cell division constriction (Figure 5A). FtsZ-GFP predominantly formed a cluster at midcell in longer cell. It was also evident that this cluster increased in intensity over time. After cell division, we observed that FtsZ-GFP re-accumulated at midcell in the two daughter cells approximately 2 h later (Figure 5B). This is consistent with the finding that approximately 50% of cells in a population display FtsZ localization at midcell based on snap-shot analysis16,17.
In a second experiment, we followed non-motile ΔmglA cells for 24 h that express mCherry-pomX. As part of the PomXYZ system, PomX helps to guide Z-ring formation and positioning, thereby stimulating cell division at midcell16. The fluorescence signal of mCherry-PomX is strong and allows an exposure time in the fluorescence channel of 250 ms. Importantly, all cells grew in size and displayed a cell division event over the course of the experiment, forming microcolonies after 24 h (Figure 6A). As previously reported16, almost all cells contained an mCherry-PomX cluster. The majority of these localized at midcell and clusters away from midcell translocated to midcell during the course of the experiment. During cell divisions, mCherry-PomX clusters were split, with each daughter cell receiving a cluster. As opposed to FtsZ-GFP, mCherry-PomX localized at midcell 80 - 90% of the cell cycle and reached this position soon after cell division (Figure 6B).
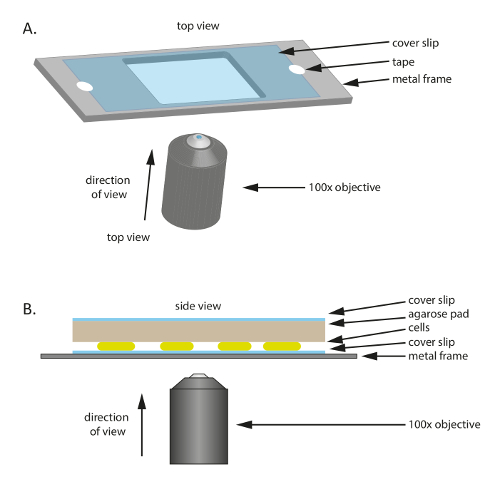
Figure 1: Schematic of the experimental set-up used throughout this study. (A) A metal or plastic frame serves as a support for the sample. A coverslip is fixed to the metal frame with tape to reduce motion of the sample. (B) Side view of the experimental sample set-up. Cells are mounted onto the coverslip shown in (A). The agarose pad that supplies nutrients and humidity to the cells is placed on top of the cells. The agarose pad is covered by an additional coverslip to reduce evaporation. For high quality images, a 100X oil immersion phase contrast objective is used. Please click here to view a larger version of this figure.
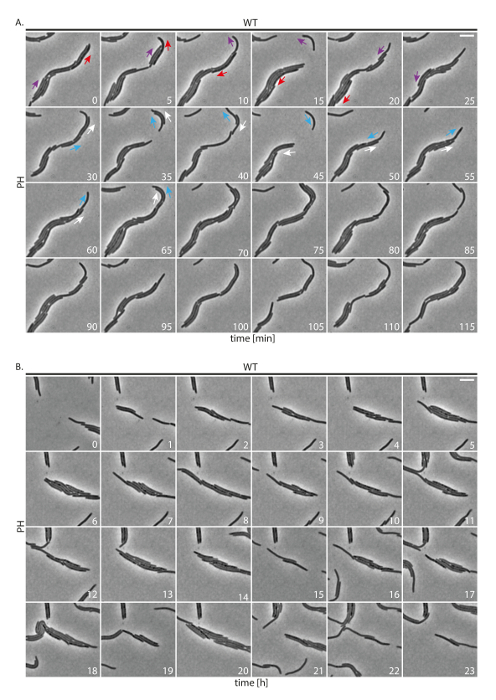
Figure 2: Phase contrast time-lapse microscopy of WT M. xanthus cells. Cells were followed for 24 h and images were acquired every 5 min. (A) Representative images of the same field of view every 5 min are shown. Colored arrows indicate directionality of movement of individual cells. The same color marks the same cell over time. Numbers indicate time in minutes. Scale bar: 5 µm. (B) Images of the same field of view after every hour are shown. Note that the same field of view is shown but because cells are moving, cells are constantly entering and leaving the field of view. Numbers indicate time in hours. Scale bar: 5 µm. PH: phase contrast. Please click here to view a larger version of this figure.
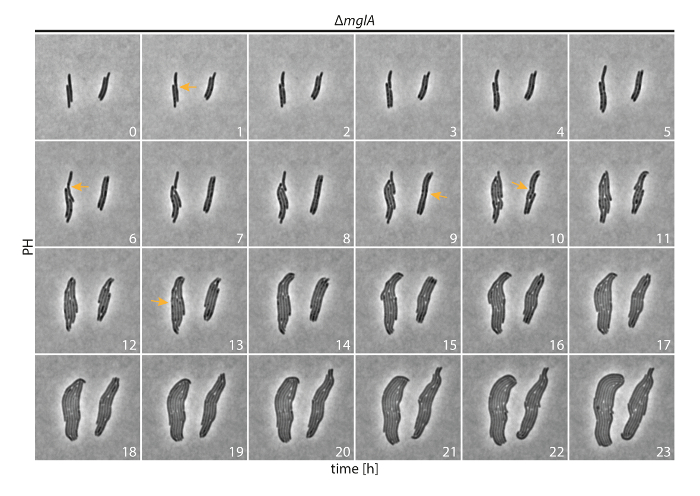
Figure 3: Phase contrast time-lapse microscopy of non-motile M. xanthus cells. ΔmglA cells were followed for 24 h. Images were acquired every 5 min and representative images after every hour are shown. Selected cell division constrictions are marked with orange arrows. Numbers indicate time in hours. PH: phase contrast. Please click here to view a larger version of this figure.
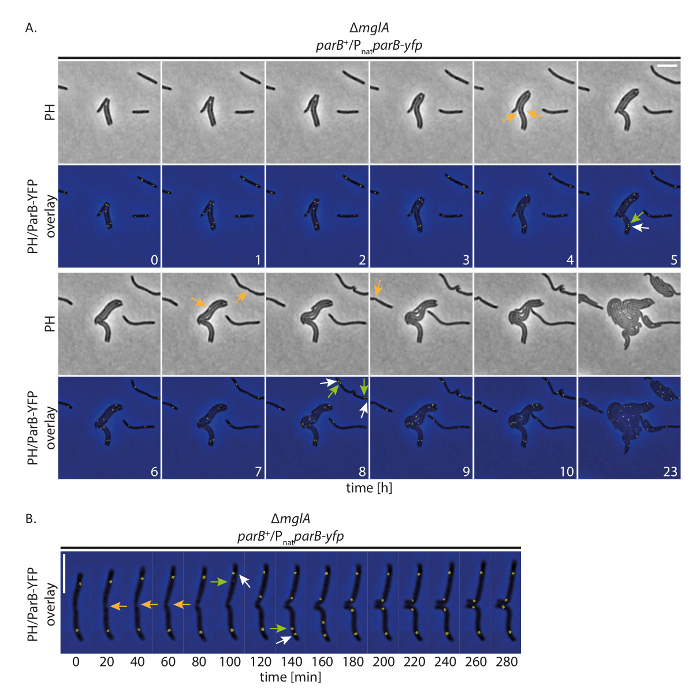
Figure 4: Fluorescence time-lapse microscopy of ParB-YFP in non-motile M. xanthus cells. Cells of a ΔmglA mutantexpressing parB-yfp in the presence of native parB (SA4749; ΔmglA; parB+/PnatparB-yfp) were followed for 24 h by phase contrast and fluorescence microscopy. (A) Images were acquired every 20 min and representative images every hour until 10 h are shown, together with the same cells after 24 h. Images are shown in phase contrast (PH) and as overlay of phase contrast and the YFP signal. Selected cell divisions are marked with orange arrows. White and green arrows indicate ParB-YFP cluster duplication events, with the green arrows marking the translocating cluster. Numbers indicate time in hours. Scale bar: 5 µm. (B) Images were acquired as in (A) but are shown at higher temporal resolution. Numbers indicate time in minutes. Arrows are as in (A). Scale bar: 5 µm. Please click here to view a larger version of this figure.
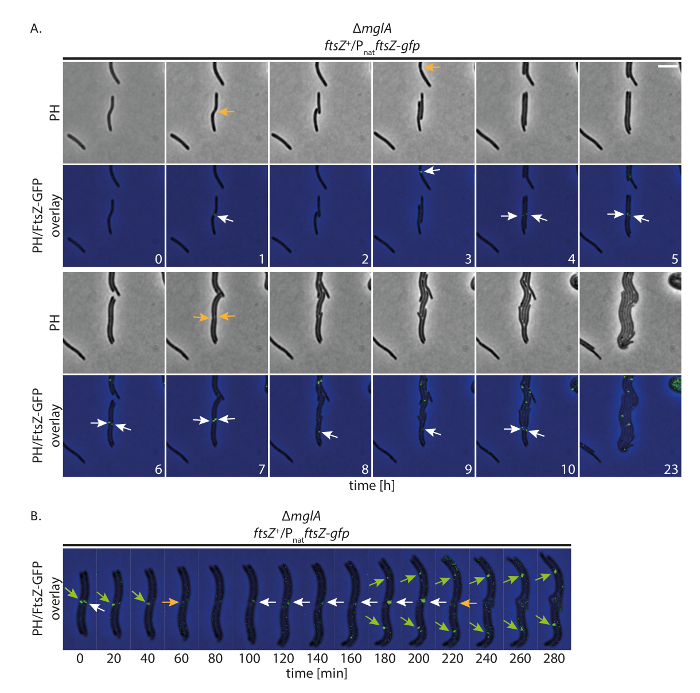
Figure 5: Fluorescence time-lapse microscopy of FtsZ-GFP in non-motile M. xanthus cells. Cells of a ΔmglA mutant expressing ftsZ-gfp in presence of native ftsZ (SA8241; ΔmglA; ftsZ+/PnatftsZ-gfp) were followed for 24 h by phase contrast and fluorescence microscopy. (A) Images were acquired every 20 min and representative images every hour until 10 h are shown, together with the same cells after 24 h. Images are shown in phase contrast (PH) and as overlay of phase contrast and GFP signal. Selected cell divisions are marked with orange arrows. White arrows indicate FtsZ-GFP clusters at midcell. Numbers indicate time in hours. Scale bar: 5 µm. (B) Images were acquired as in (A) but are shown at higher temporal resolution. Numbers indicate time in minutes. Green and white arrows mark FtsZ-GFP clusters in the left and right cells, respectively. Orange arrows indicate cell divisions. Scale bar: 5 µm. Please click here to view a larger version of this figure.
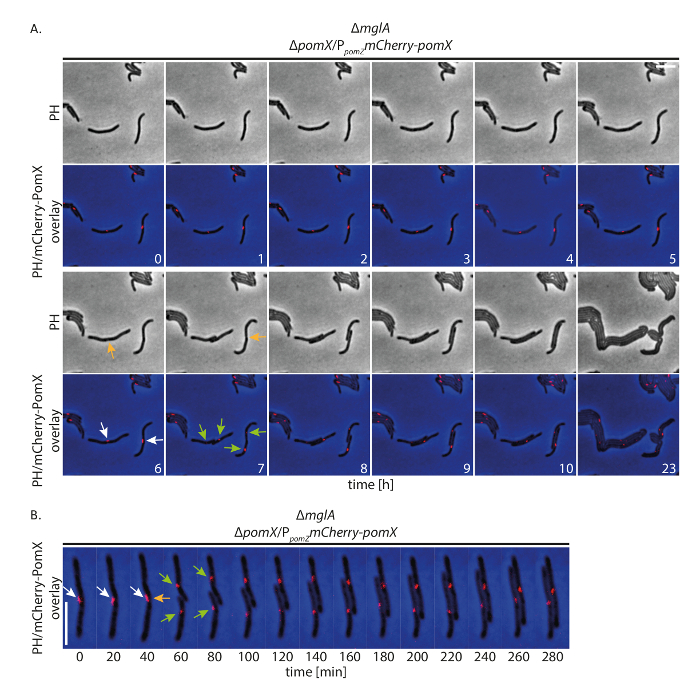
Figure 6: Fluorescence time-lapse microscopy of mCherry-PomX in non-motile M. xanthus cells. Non-motile ΔpomX cells accumulating mCherry-PomX (SA4797; ΔmglA; ΔpomX/PpomZ mCherry-pomX) were followed for 24 h by phase contrast and fluorescence microscopy every 20 min. (A) Representative images every hour until 10 h are shown, together with the same cells after 24 h. Images are shown in phase contrast (PH) and as overlay of phase contrast and mCherry signal. Selected cell divisions are marked with orange arrows. White and green arrows indicate mCherry-PomX clusters before and after splitting events, respectively. Numbers indicate time in hours. Scale bar: 5 µm. (B) Images were acquired as in (A) and are shown at higher temporal resolution. Arrows are as in (A). Scale bar: 5 µm. Please click here to view a larger version of this figure.
| Bacterial strain | Relevant genotype1 | Reference |
| DK1622 | Wildtype | 23 |
| SA4420 | ΔmglA | 24 |
| SA4749 | ΔmglA; parB+/attB::PnatparB-yfp (pAH7) | This study |
| SA4797 | ΔmglA; ΔpomX/ attB::PpomZ mCherry-pomX (pAH53) | 16 |
| SA8241 | ΔmglA;ftsZ+/ mxan18-19::PnatftsZ-gfp (pDS150) | This study |
| Plasmids in brackets contain indicated gene fusions and were intergated at the indicated sites on the genome. Plasmids integrated at the attB site or the mxan18-19 intergenic region were expressed from their native promoter (Pnat) or the native promoter of pomZ (PpomZ). | ||
Table 1: List of bacterial strains used in this study.
| Plasmids | Relevant characteristics | Reference |
| pAH7 | Pnat parB-yfp;Mx8 attP; TetR | 19 |
| pAH53 | PpomZ mCherry-pomX; Mx8 attP ; KmR | 16 |
| pDS150 1 | Pnat ftsZ-gfp ; mxan18-19 ; TetR | This study |
| pMR3691 | Plasmid for vanillate inducible gene expression | 18 |
| pKA51 | Pnat ftsZ-gfp ; Mx8 attP; TetR | 17 |
| 1 pDS150: pDS150 is a derivative of pKA51 in which the Mx8 attP site was replaced with the mxan18-19 intergenic region. For this the mxan18-19 intergenic region was amplified from pMR3691 with primers Mxan18-19 fwd BsdRI (GCGATCATTGCGCGCCAGACGATAACAGGC) and Mxan18-19 rev BlpI (GCGGCTGAGCCCGCGCCGACAACCGCAACC) and cloned into pKA51. | ||
Table 2: List of plasmids used in this study.
Discussion
Fluorescence live-cell imaging has become a powerful tool to study the spatiotemporal dynamics of bacterial cells. Time-lapse fluorescence microscopy of motile and slow growing bacteria such as M. xanthus, however, has been challenging and was only performed for short time durations. Here, we present an easy-to-use and robust method for live-cell imaging of M. xanthus by time-lapse fluorescence microscopy. This method allows the user to follow cells and fluorescently labeled proteins for several rounds of the cell cycle with single cell resolution.
There are several prerequisites that influence the success of live-cell imaging of slow growing M. xanthus cells including: 1) a solid surface for cell attachment; 2) the availability of nutrients and oxygen; 3) constant humidity and temperature; and 4) the optimization of experimental conditions such as exposure time and image acquisition frequency.
In our experimental set-up, we use thick agarose pads supplemented with nutrients. Using thick agarose pads as opposed to microfluidic devices to follow single cells has some fundamental benefits but also some drawbacks. First, the agarose pad not only provides a surface for M. xanthus cell attachment and movement but also sufficient nutrients for growth for at least 24 h. Second, snap shot analyses commonly used to study intracellular localization of fluorescently labeled proteins was previously done on the same type of agarose pads16,17,29. Therefore, data from snap shot analyses can be directly compared to data obtained with the method described here. Thirdly, agarose pads can be easily modified and supplemented with antibiotics or other supplements such as CuSO4 and vanillate that are commonly used for gene expression induction18,30. Finally, because cells are allowed to form microcolonies during the course of an experiment, this set-up also allows studying the effect of direct cell-cell interactions on the particular parameter being analyzed. This aspect is particularly important in the case of M. xanthus because this bacterium displays several contact-dependent interactions. The main drawback of this method is that the experimental conditions are preset for the duration of an experiment. By contrast, microfluidic devices generally allow changing the experimental conditions during the course of an experiment by adding for instance antibiotics31.
Free software packages (e.g., MicrobeJ, Oufti) are available to automatically analyze the growth of single cells and protein localization within individual cells. However, these software are only well-suited for the analysis of single cells or small groups of cells. Thus, it remains a challenge to automatically analyze the data generated for the 24 h recordings described here.
In summary, we described an easy-to-use and reproducible protocol to perform live-cell imaging with slow growing M. xanthus bacteria. We show that simple nutrient-supplemented agarose pads are sufficient to sustain growth for at least 24 h and allow for observing and analyzing protein localization and growth with single cell resolution over several generations.
Disclosures
The authors declare that they have no competing financial interests.
Acknowledgements
This work was supported by the German Research Council (DFG) within the framework of the Transregio 174 "Spatiotemporal dynamics of bacterial cells" and the Max Planck Society.
Materials
| Name | Company | Catalog Number | Comments |
|---|---|---|---|
| DMI6000B with AFC | Leica microsystems | 11888945 | Automated inverted widefield fluorescence microscope with adaptive focus control |
| Universal mounting frame | Leica microsystems | 11532338 | Stage holder for different sample sizes |
| HCX PL FLUOTAR 100x/1.30 oil PH3 | Leica microsystems | 11506197 | Phase contrast objective |
| Orca Flash 4.0 camera | Hamamatsu | 11532952 | 4.0 megapixel sCMOS camera for picture aquisition |
| Filter set TXR ET, k | Leica microsystems | 11504170 | Fluorescence filter set, Ex: 560/40 Em: 645/75 |
| Filter set L5 ET, k | Leica microsystems | 11504166 | Fluorescence filter set, Ex: 480/40 Em: 527/30 |
| Filter set YFP ET, k | Leica microsystems | 11504165 | Fluorescence filter set, Ex: 500/20 Em: 535/30 |
| ProScan III | Prior | H117N1, V31XYZEF, PS3J100 | Microscope automation controller with interactive control center |
| EL 6000 light source | Leica microsystems | 11504115 | External fluorescence light source |
| Incubator BLX Black | Pecon | 11532830 | Black incubation chamber surrounding the microscope |
| Tempcontrol 37-2 digital | Leica microsystems | 11521719 | Automated temperature control for incubation chamber |
| Gentmycin sulphate | Carl Roth | 0233.4 | Gentamycin |
| Oxytetracylin dihydrate | Sigma Aldrich | 201-212-8 | Oxytetracyclin |
| Kanamycin sulphate | Carl Roth | T832.3 | Kanamycin |
| Filtropur BT25 0.2 bottle top filter | Sarstedt | 831,822,101 | Bottle top filter for sterilization of buffers |
| Deckgläser | VWR | 630-1592 | Glass cover slip (60 x 22 mm, thickness: 0.7 mm) |
| Seakem LE agarose | Lonza | 50004 | Agarose for microscopy slides |
| Leica Metamorph AF | Leica microsystems | 11640901 | Microscope control software and software for picture analysis |
| Tetraspeck Microsperes, 0.5 µm | ThermoFisher | T7281 | Fluorescent microspheres |
| petri dish | Greiner Bio-one | 688102 | 120 mm x 120 mm x 17 mm squared petri dish for agarose pads |
| BD Bacto Casitone | Becton Dickinson | 225930 | Casitone |
| Parafilm M | VWR | 291-1213 | Parafilm |
| Tris(hydroxymethyl)-aminomethane | Carl Roth | AE15.2 | Tris |
| Magnesium sulphate heptahydrate | Carl Roth | P027.2 | Magnesium sulphate |
| Potassium dihydrogen phosphate p.a. | Carl Roth | 3904.1 | Potassium dihydrogen phosphate |
| 1% CTT medium: 1 % (w/v) BD Bacto™ casitone, 10 mM Tris-HCl ph 8.0, 1 mM potassium phosphate buffer pH 7.6, 8 mM MgSO4 | Cultivation medium for M.xanthus | ||
| TPM buffer: 10 mM Tris-HCl ph 8.0, 1 mM potassium phosphate buffer pH 7.6, 8 mM MgSO4 | Buffer for preparation of microscopy slides for M.xanthus |
References
- Shapiro, L., McAdams, H. H., Losick, R. Why and how bacteria localize proteins. Science. 326 (5957), 1225-1228 (2009).
- Treuner-Lange, A., Søgaard-Andersen, L. Regulation of cell polarity in bacteria. J Cell Biol. 206 (1), 7-17 (2014).
- Laloux, G., Jacobs-Wagner, C. Spatiotemporal control of PopZ localization through cell cycle-coupled multimerization. J Cell Biol. 201, 827-841 (2013).
- Rudner, D. Z., Losick, R. Protein subcellular localization in bacteria. Cold Spring Harb. Perspect. Biol. 2 (4), 000307(2010).
- Badrinarayanan, A., Le, T. B. K., Laub, M. T. Bacterial chromosome organization and segregation. Annu Rev Cell Dev Biol. 31 (1), 171-199 (2015).
- Munoz-Dorado, J., Marcos-Torres, F. J., Garcia-Bravo, E., Moraleda-Munoz, A., Perez, J. Myxobacteria: Moving, Killing, Feeding, and Surviving Together. Front Microbiol. 7, 781(2016).
- Berleman, J. E., Kirby, J. R. Deciphering the hunting strategy of a bacterial wolfpack. FEMS Microbiol Rev. 33 (5), 942-957 (2009).
- Konovalova, A., Petters, T., Søgaard-Andersen, L. Extracellular biology of Myxococcus xanthus. FEMS Microbiol. Rev. 34, 89-106 (2010).
- Nudleman, E., Wall, D., Kaiser, D. Cell-to-cell transfer of bacterial outer membrane lipoproteins. Science. 309, 125-127 (2005).
- Vassallo, C. N., et al. Infectious polymorphic toxins delivered by outer membrane exchange discriminate kin in myxobacteria. eLife. 6, 29397(2017).
- Vassallo, C., et al. Cell rejuvenation and social behaviors promoted by LPS exchange in myxobacteria. Proc Natl Acad Sci USA. 112 (22), 2939-2946 (2015).
- Li, Y., et al. Extracellular polysaccharides mediate pilus retraction during social motility of Myxococcus xanthus. Proc. Natl. Acad. Sci. USA. 100, 5443-5448 (2003).
- Kim, S. K., Kaiser, D. Cell alignment required in differentiation of Myxococcus xanthus. Science. 249, 926-928 (1990).
- Lobedanz, S., Søgaard-Andersen, L. Identification of the C-signal, a contact dependent morphogen coordinating multiple developmental responses in Myxococcus xanthus. Genes Dev. 17, 2151-2161 (2003).
- Schumacher, D., Søgaard-Andersen, L. Regulation of cell polarity in motility and cell division in Myxococcus xanthus. Annu Rev Microbiol. 71 (1), 61-78 (2017).
- Schumacher, D., et al. The PomXYZ proteins self-organize on the bacterial nucleoid to stimulate cell division. Dev Cell. 41 (3), 299-314 (2017).
- Treuner-Lange, A., et al. PomZ, a ParA-like protein, regulates Z-ring formation and cell division in Myxococcus xanthus. Mol Microbiol. 87 (2), 235-253 (2013).
- Iniesta, A. A., Garcia-Heras, F., Abellon-Ruiz, J., Gallego-Garcia, A., Elias-Arnanz, M. Two systems for conditional gene expression in Myxococcus xanthus inducible by isopropyl-beta-D-thiogalactopyranoside or vanillate. J Bacteriol. 194 (21), 5875-5885 (2012).
- Harms, A., Treuner-Lange, A., Schumacher, D., Søgaard-Andersen, L. Tracking of chromosome and replisome dynamics in Myxococcus xanthus. reveals a novel chromosome arrangement. PLoS Genet. 9 (9), 1003802(2013).
- Iniesta, A. A. ParABS system in chromosome partitioning in the bacterium Myxococcus xanthus. PLoS One. 9 (1), 86897(2014).
- Lin, L., Osorio Valeriano, M., Harms, A., Søgaard-Andersen, L., Thanbichler, M. Bactofilin-mediated organization of the ParABS chromosome segregation system in Myxococcus xanthus. Nat Commun. 8 (1), 1817(2017).
- Hodgkin, J., Kaiser, D. Cell-to-cell stimulation of movement in nonmotile mutants of Myxococcus. Proc Natl Acad Sci U S A. 74 (7), 2938-2942 (1977).
- Kaiser, D. Social gliding is correlated with the presence of pili in Myxococcus xanthus. Proc Natl Acad Sci USA. 76 (11), 5952-5956 (1979).
- Miertzschke, M., et al. Structural analysis of the Ras-like G protein MglA and its cognate GAP MglB and implications for bacterial polarity. EMBO J. 30 (20), 4185-4197 (2011).
- Hodgkin, J., Kaiser, D. Genetics of gliding motility in Myxococcus xanthus. (Myxobacterales): Two gene systems control movement. Mol Gen Genet. 171, 177-191 (1979).
- Shi, X., et al. Bioinformatics and experimental analysis of proteins of two-component systems in Myxococcus xanthus. J Bacteriol. 190 (2), 613-624 (2008).
- Bi, E. F., Lutkenhaus, J. FtsZ ring structure associated with division in Escherichia coli. Nature. 354 (6349), 161-164 (1991).
- Lutkenhaus, J., Pichoff, S., Du, S. Bacterial cytokinesis: From Z ring to divisome. Cytoskeleton. 69 (10), 778-790 (2012).
- McLoon, A. L., et al. MglC, a Paralog of Myxococcus xanthus GTPase-Activating Protein MglB, Plays a Divergent Role in Motility Regulation. J Bacteriol. 198 (3), 510-520 (2015).
- Gomez-Santos, N., et al. Comprehensive set of integrative plasmid vectors for copper-inducible gene expression in Myxococcus xanthus. Appl Environ Microbiol. 78 (8), 2515-2521 (2012).
- Treuner-Lange, A., et al. The small G-protein MglA connects to the MreB actin cytoskeleton at bacterial focal adhesions. J Cell Biol. 210 (2), 243-256 (2015).
Reprints and Permissions
