The safe application of newly developed surgical energy devices in thyroid/parathyroid surgery attracts the attention of surgeons. Animal experimental models can avoid unnecessary trials and errors in human surgery. This report aims to demonstrate electrophysiological and thermographic methods to evaluate the safety parameters of SEDs in thyroid/parathyroid surgery.
Method Article
Investigation of the Electrophysiological and Thermographic Safety Parameters of Surgical Energy Devices During Thyroid and Parathyroid Surgery in a Porcine Model
In This Article
Summary
Abstract
In thyroid and parathyroid surgery, surgical energy devices (SEDs) provide more efficient hemostasis than conventional clamp-and-tie hemostasis in areas with rich blood supply. However, when a SED is activated near the recurrent laryngeal nerve (RLN), the heat generated by the SED may injure the nerve irreversibly. To safely apply SEDs in thyroid/parathyroid surgery, this article introduces experimental porcine model studies to investigate the activation and cooling safety parameters of SEDs in standardized electrophysiological (EP) and thermographic (TG) procedures, respectively. In the EP safety parameter experiments, continuous intraoperative neuromonitoring (C-IONM) is applied to demonstrate the RLN function in real-time. The EP activation study evaluates the safe activation distance of SEDs; the EP cooling study evaluates the safe cooling time of SEDs. In the TG safety parameter experiment, a thermal imaging camera is used to record the temperature change after activating the SED. The TG activation study evaluates the lateral thermal spread distance after SED activation in a dry or humid environment and whether smoke and splashing are generated; the TG cooling study evaluates the cooling time. This will help establish the safety parameters of newly developed SEDs used in thyroid/parathyroid surgery and provide safety guidelines to avoid RLN injury and related complications.
Introduction
Efficient hemostasis is a very important issue in thyroid and parathyroid surgery. In recent decades, one of the most major advances in thyroid and parathyroid surgery has been the development of surgical energy devices (SEDs)1. SEDs provide more efficient hemostasis than the conventional clamp-and-tie technique in areas with rich blood supply, which reduces intraoperative blood loss and operation time2, postoperative hypocalcemia3, and life-threatening postoperative hematoma4. SEDs are reported to be used in 65.7% of thyroidectomy patients in recent studies5, and the annual use of SED increases each year.
However, SEDs have not been proven superior to conventional techniques in terms of recurrent laryngeal nerve (RLN) injury in thyroid and parathyroid surgery4,6,7. Thermal injury and lateral thermal spread to the RLN often occur unexpectedly when a SED is activated near the nerve, and this type of injury is usually severe and irreversible. Compared to mechanical traction or compression nerve injury, thermally nerve injury has less distortion of the outer structure but more severe damage to the inner endoneurium, including the myelin sheath and the axon8,9,10,11. This kind of injury not only experiences difficulty in regaining normal function but also is less reversible in clinical sequence than traction injury10,12. In addition, thermal injury is often invisible to the surgeon and may be unrecognized in the course of surgery13,14. Thus, surgeons should consider the thermal effects of SED to avoid RLN thermal injury during thyroid and parathyroid surgery.
Porcine models are most commonly used for RLN research because the anatomy and physiology of pigs are very similar to those of humans15,16,17,18,19,20. The experimental porcine model enables easy handling, is widely available, and is cost-effective9. For electrophysiological (EP) information, intraoperative neuromonitoring (IONM) is helpful for detecting mechanisms of nerve injury and predicting postoperative vocal cord function21,22,23,24,25,26,27. Addirionally, continuous IONM (CIONM) enables early detection of nerve injury after high-risk procedures because it can immediately feedback for the nerve function by using repetitive vagal stimulation28,29,30. Studies on EP activation and cooling can determine the safe SED activation distance from the RLN and the safe cooling time after SED activation before contacting the RLN. For thermographic information, a thermal imaging camera is helpful to evaluate the temperature change (activation and cooling), and the hyperthermal region can be visualized after SED activations31,32,33,34,35. In a previous study, RLN thermal injury occurred when the tissue temperature reached the critical temperature of 60 °C in the porcine CIONM model36. Studies on TG activation and cooling can determine the lateral thermal spread distance, the occurrence of smoke and splashing, and the temperature change during cooling with or without the muscle touch maneuver (MTM). To safely apply SED in thyroid/parathyroid surgery, this article introduces an experimental porcine model study to investigate EP and TG safety parameters of SEDs under standardized procedures.
Protocol
The animal experiments were approved by the Institutional Animal Care and Use Committee (IACUC) of Kaohsiung Medical University, Taiwan (protocol no: IACUC-110082).
1. Animal preparation and anesthesia
- Conditions for porcine selection: Select Duroc-Landrace pigs at age of 3 to 4 months old and weighing 18 to 30 kg.
- Preparation before the experiment: Fast the pigs for 8 h without food and 2 h without water before anesthesia.
- Anesthesia induction: Administer 2 mg/kg Tiletamine/Zolazepam via intramuscular route 30 min before surgery
NOTE: Neuromuscular block agents were not used during anesthesia induction. - Endotracheal tube selection: Use a 6.0 mm commercial electromyography (EMG) endotracheal tube (the recording electrodes) in the manner routinely used clinically.
- Intubation: Let the anesthesiologist intubate the recording electrodes with the assistance of direct laryngoscopy in the prone position. In this study, the endotracheal tube was fixed at 24 cm through end-tidal carbon dioxide (etCO2) monitoring and chest auscultation to ensure the appropriate tube location.
- Anesthesia maintenance: Position the pig on its back, extend the neck, and fix the endotracheal tube. Set the tidal volume to 8 to 12 mL/kg and a 15 to 20 breaths per minute respiratory rate. Use 1% to 2% sevoflurane for general anesthesia maintenance.
NOTE: Neuromuscular block agents were not used during anesthesia maintenance. - During the experiment, in addition to continuous monitoring of the animal's core body temperature, it is important to ensure that the experimental temperature is within an appropriate range. If the animal experiences a drop in body temperature, immediate thermal support such as a warm blanket should be provided.
2. Animal operation (Figure 1 and Figure 2)
- Verify a surgical plane of anesthesia.
- Skin incision: Make a 15 cm transverse cervical incision on the skin 1 cm above the sternum (Figure 1A).
- Raise the subplastysmal flap to the hyoid bone level.
- Separate the strap muscles via the midline approach, and retract laterally to visualize the thyroid cartilage, cricoid cartilage, tracheal rings, and thyroid gland.
NOTE: The edges of the strap muscles need to be dissected carefully and neatly for TG studies. - After exposure, dissect the sternocleidomastoid muscles (SCMs) bilaterally (Figure 1B).
NOTE: The edges of the SCMs need to be dissected carefully and neatly for EP studies. - Identify, expose, and dissect along the recurrent laryngeal nerves (RLNs) and vagus nerves (VNs) bilaterally (Figure 2).
NOTE: IONM can assist with this step. - Perform the experiments of EP and TG studies following step 4 and step 5.
- After completing the whole experiment, keep the piglets under 4%-6% sevoflurane and humanely euthanize them by an overdose of Tiletamine/Zolazepam (6 mg/kg).
3. Surgical energy devices (SEDs) information and settings
- For the details regarding SEDs refer to the Table of Materials.
NOTE: This study uses Advanced bipolar SEDs (referenced as Device A) to demonstrate the EP and TG studies.
4. Electrophysiological (EP) study
- Continuous IONM setting (Figure 3)
NOTE: Ensure that the recording electrodes are intubated as mentioned in step 1.5.- Install the ground electrodes outside the surgical incision wound.
- Install the stimulating electrodes: Install a 2.0 mm automatic periodic stimulation (APS) electrode on one side of the VN.
- Connect all electrodes on the interconnection box, and check that the interconnection box is connected to the monitoring system (Nerve Integrity Monitoring system) and that the power of the monitoring system is on (Figure 3A).
- Confirm that the monitoring system shows that the electrodes are connected correctly.
- Select the Monitoring page, and click on Advanced Settings.
- Click APS to set APS Stimulation to 1/min for slow rate, 1/s for fast rate, and Alarm Limits to 50% and 2000 µV for amplitudes, 10% for latency. Then click on OK to finish the settings.
NOTE: The setting of other columns depends on the experimenter. - Click on Events Capture in the Events column, and set the event threshold at 100 µV.
NOTE: Figure 3B demonstrates the protocol steps 4.1.5-4.1.7. - Find the Vagus APS Stim column, and set the current of stimulation at 1.0 mA. Click on Baseline; a new window, Establishing APS Baseline, will appear on the right side of the screen.
- Input the Session Title and Session Comments. Select the channel to be tested, and the system will automatically start to measure 20 times. The baseline amplitude and latency will be automatically calculated and shown. Click on Accept if the baseline is correct.
NOTE: Figure 3C demonstrates the protocol steps 4.1.8-4.1.9. - Click on the Fast Forward icon in Vagus APS Stim column to start a test. After each EP experiment, click on the Pulse icon to stop recordings.
- Select the Reports page and set the report output format to save the file to USB.
NOTE: The sample C-IONM report is shown in Figure 3D.
- EP activation study (Figure 4)
- Develop experimental guidelines before starting an experiment.
NOTE: Figure 4A shows a common EP activation study protocol example, which can be adjusted according to SED characteristics. For some instruments with activation cycles, the single activation time is a single activation cycle, mostly ranging from 2-4 s. Most SEDs do not have an activation cycle, and the single activation time is 3 s. - Activation distance tests at 5 mm:
- Apply the SED on the soft tissue at a distance of 5 mm from the RLN and activate SED (single activation).
- Observe the EMG change. Operate at the same activation distance three times unless a substantial EMG amplitude change occurs.
NOTE: Figure 4B shows the activation distance test at 5 mm.
- Activation distance tests at 2 mm:
- Apply the SED on the soft tissue close to the RLN at 1 mm distance and activate SED (single activation).
- Observe the EMG change. Operate at the same activation distance three times unless a substantial EMG amplitude change occurs.
- Activation distance tests at 1 mm:
- Apply the SED on the soft tissue at a distance of 1 mm from the RLN, and activate SED (single activation).
- Observe the EMG change. Operate at the same activation distance three times unless a substantial EMG amplitude change occurs
- If a substantial decrease of EMG amplitude is observed during steps 4.2.2-4.2.4, stop the RLN experiment. Record the real-time EMG continuously for 20-60 min to determine whether the injury is reversible. (Figure 4C)
- Manually record the experimental results as a table (Table 1).
- Develop experimental guidelines before starting an experiment.
- EP cooling study (Figure 5)
- Develop experimental guidelines before starting an experiment.
NOTE: Figure 5A shows a common EP cooling study protocol example, which can be adjusted according to SED characteristics. - Cooling time tests of 5 s:
- Apply SED single activation to the SCM muscle. Touch the RLN with the tip of the SED after 5 s of waiting and cooling.
- Observe the EMG change. Operate at the same cooling time three times unless a substantial EMG amplitude change occurs.
- Cooling time tests of 2 s:
- Apply SED single activation to the SCM muscle. Touch the RLN with the tip of the SED after 2 s of waiting and cooling.
- Observe the EMG change. Operate at the same cooling time three times unless a substantial EMG amplitude change occurs.
NOTE: Figure 5B shows the cooling time test of 2 s.
- Proceed immediately with muscle touch maneuver (MTM) tests:
- Apply SED single activation to the SCM muscle. Quickly touch (approximately 1 s) the activated surface of the SED with another position of the SCM (MTM, Figure 5C).
- Touch the RLN with the tip of the SED immediately after MTM and observe the EMG change. Operate at the same cooling time three times unless a substantial EMG amplitude change occurs.
- Proceed immediately without muscle touch maneuver (MTM) tests:
- Apply SED single activation to the SCM muscle. Touch the RLN with the tip of the SED immediately without MTM.
- Observe the EMG change. Operate the same cooling time three times unless a substantial EMG amplitude change occurs. If a substantial decrease of EMG amplitude is observed, follow step 4.3.6.
- If a substantial decrease of EMG amplitude is observed, stop the RLN experiment. Then, continuously monitor the real-time EMG response for at least 20 min to determine whether the RLN injury is reversible or not. (Figure 5D)
- Manually record the experimental results as a table (Table 2).
- Develop experimental guidelines before starting an experiment.
5. Thermographic (TG) study
- Set up the thermal imaging system (Figure 6).
NOTE: Thermal imaging camera with temperature sensitivity up to a temperature range of -20 °C to 650 °C. The image is updated every second.- Place the camera 50 cm from the target tissue at an angle of 60° from the experimental table (Figure 6A).
NOTE: In the operating field, measured by a thermal imaging camera, the temperature is displayed according to the color scale. The location with the highest temperature on the screen is marked with a "+" sign, and its corresponding temperature is displayed (Figure 6B) - Select Video Mode, and press the capture button.
NOTE: The procedures monitored by the thermal camera are continuously recorded in video form.
- Place the camera 50 cm from the target tissue at an angle of 60° from the experimental table (Figure 6A).
- Conduct the animal preparation for the TG study:
- Record the background temperature of the experimental area using the thermal imaging camera. The background temperature should be in the range of 25 ± 2 °C (Figure 6C). If the background temperature exceeds this range, adjust the temperature of the laboratory air conditioner and test again.
- Standard strap muscle thickness for SED activation: Prepare the strap muscles for the TG study as described in step 2.3. The standard strap muscle thickness for SED activation is 5 mm (Figure 6D).
- TG activation study (Figure 6 and Figure 7)
- Dry environment tests: Wipe the surface of porcine strap muscles with dry gauze.
- Whole blade tests in a dry environment (Figure 7A):
- Grasp the strap muscle at the full length of the blade using SED (Figure 6E).
- Evaluate maximum activation temperature: After a single activation, the maximum temperature is shown on the screen during the measurement (Figure 7B).
- Evaluate lateral thermal spread: Measure the diameter of the 60 °C isothermal line after a single activation.
- Evaluate smoke and splashing: After a single activation, when the highest temperature on the screen exceeds 60 °C, record any smoke and splash on the screen. Repeat five measurements in different areas.
NOTE: Maximum activation temperature was evaluated with whole blade tests in a dry environment only.
- One-third (1/3) of blade tests in a dry environment (Figure 7C):
- Grasp the strap muscle with an anterior 1/3-length blade using SED (Figure 6F). Evaluate the lateral thermal spread, smoke, and splashing (Figure 7D) as described in step 5.3.1.1. Repeat five measurements in different areas.
- Whole blade tests in a dry environment (Figure 7A):
- Wet environment tests: Soak the porcine strap muscles in sterile water for 3 s just before SED activation.
- Whole blade tests in a wet environment (Figure 7E): Grasp the strap muscle at full length of the blade using SED and evaluate the lateral thermal spread (Figure 7F), smoke, and splashing as described in step 5.3.1.1. Repeat five measurements in different areas.
- One-third (1/3) tests in a wet environment (Figure 7G): Grasp the strap muscle with an anterior 1/3-length blade using SED and evaluate the lateral thermal spread, smoke (Figure 7H), and splashing as described in step 5.3.1.1. Repeat five measurements at different areas.
- Manually record the experimental results as a table (Table 3).
- Dry environment tests: Wipe the surface of porcine strap muscles with dry gauze.
- TG cooling study (Figure 8)
- Dry environment: Wipe the surface of porcine strap muscles with dry gauze as in step 5.3.1.
NOTE: In the TG cooling study, all activations were performed in a dry environment with whole blade activation. - Evaluate minimum cooling time without MTM: After SED single activation with the whole blade on strap muscle, start recording the cooling time until the highest temperature on the screen was less than 60 °C. Repeat five measurements in different areas.
NOTE: When measuring the cooling time and temperature of the SED blade after single activation and MTM, cover the SED-activated muscle area and the MTM-contacting muscle area with gauze, as the high temperature in these areas will be detected up on the TG screen and interfere with the temperature that is to be actually measured. - Evaluate the blade temperature after MTM: After a single activation of the SED with the whole blade on the strap muscle, quickly touch (~1 s) the activated surface of the SED with another position of the strap muscle (Figure 8A). Then record its temperature immediately after leaving the SED from the strap muscle with the blade open (Figure 8B).
- Evaluate the minimum cooling time with MTM: After step 5.4.3, when the temperature is more than 60 °C, start recording the cooling time until the highest temperature on the screen is less than 60 °C. Repeat five measurements in different areas.
- Manually record the experimental results as a table (Table 4).
- Dry environment: Wipe the surface of porcine strap muscles with dry gauze as in step 5.3.1.
6. Data interpretations
- Present the EP and TG safety parameters in table form with smoke and splashing marked.
NOTE: Here, the EP and TG safety parameters of SED are presented in table form, and smoke and splashing are marked with * and # symbols, respectively. In EP and TG studies, the final result lists the maximum data as in Table 5.
Results
The animal operation was performed on each piglet, and the anatomic structures were identified, as shown in Figure 1 and Figure 2. Several structures were neatly dissected (SCM muscles and strap muscles) and carefully prepared (RLNs and VNs) according to the standardized procedure shown in Figure 1 and Figure 2. The tested SEDs in this study are shown in supplemental tables. Applying the standard procedures described in the Protocol section, the safety parameters of SEDs can be established in animal experiments.
Electrophysiological (EP) study
CIONM consists of three major parts: the stimulating electrode, the recording electrode, and the monitoring system (Figure 3A). After the CIONM system is ensured to be available, the signal change during the EP study can be well documented. (Figure 3D).
EP activation study: The EP activation study protocols are shown in Figure 4A. The safe activation distance is defined as single activation of the SED at a position greater than this distance without causing substantial EMG amplitude change. The APS EMG signal recordings of EP activation study are shown in Figure 4C. An example of demonstrating experimental results of EP activation study is shown in Table 1. The final interpretations are shown in Table 5.
EP cooling study: The EP cooling study protocols are shown in Figure 5A. The safe cooling time is defined as cooling for more than this time after a single activation of the SED that will not cause substantial EMG amplitude change. MTM of 1 s was performed immediately after a single activation of the SED, which determined whether the SED was safe or unsafe according to the occurrence of substantial EMG amplitude change. The APS EMG signal recordings of EP activation study are shown in Figure 5D. An example of demonstrating the experimental results of EP cooling study is shown in Table 2. The final interpretations are shown in Table 5.
Thermographic (TG) study
The standardized thermal imaging system setting is shown in Figure 6A. The temperature displays, the highest temperature mark ("+" sign), and the color scale are illustrated in Figure 6B. The background temperature of the experimental area is recorded as shown in Figure 6C. Strap muscles were prepared at a standard 5 mm thickness, which is shown in Figure 6D. The definition of the whole blade and one-third blade was demonstrated in Figure 6E,F.
TG activation study: The maximum temperature was tested with the whole blade in a dry environment; the results are shown in Table 3. The TG activation study contains four combinations: whole blade tests in a dry environment (Figure 7A,B), one-third blade tests in a dry environment (Figure 7C,D), whole blade tests in a wet environment (Figure 7E,F), and one-third blade tests in a wet environment (Figure 7G,H). Compared to the dry environment, heat splashing and lateral thermal spread tend to occur on the TG imaging screen in the wet environment. Different SEDs have different lateral thermal spread and smoke/splashing formation patterns when activated with a whole blade or one-third of a blade, according to their different hemostasis mechanisms. The thermal spread distance is defined as the farthest distance between the 60 °C isothermal line and the SED blade after a single activation. The experimental results are shown in Table 3. The final interpretations are shown in Table 5.
TG cooling study: The safe cooling time is defined as cooling for more than this time after a single activation of the SED, and it is completely lower than 60 °C on the TG screen. The MTM (Figure 8A) is a good cooling method in which the temperature is decreased rapidly under the TG imaging screen. MTM of 1 s was performed immediately after a single activation of the SED, and the temperature on the blade exceeding 60 °C or not determines whether the SED is safe or unsafe, respectively (Figure 8B). The experimental results, including minimum cooling time without MTM, blade temperature after MTM, and minimum cooling time with MTM, are shown in Table 4. The final interpretations are shown in Table 5.
Data interpretations
According to the data obtained in the experiments, the safety parameters of SED will be integrated into a table (Table 5 shows the data collected using Advanced bipolar SEDs (referenced as Device A) in the Table of Materials). Device A is one of the devices that is used for examination in this study. This data suggests that when surgeons use this SED, they should keep a sufficient safety distance and sufficient cooling time, adjust according to different operating environments and different grasping length, observe whether irregular thermal spread pattern occurs (smoke and splashing), and evaluate the temperature of the SED after a single activation and immediately after MTM is performed.
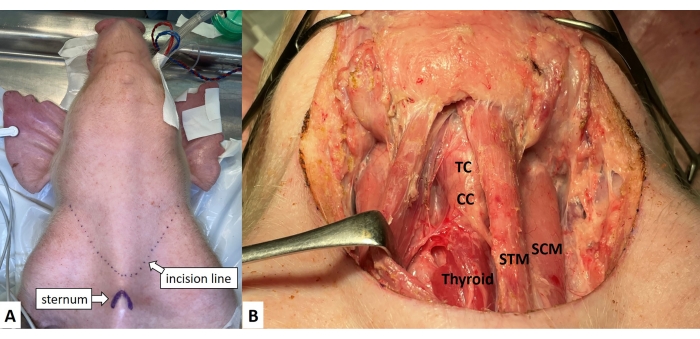
Figure 1: Skin Incision and dissection of the sternocleidomastoid muscles. (A) A 15 cm transverse cervical skin incision line is made 1 cm above the sternum. (B) The strap muscles are retracted laterally to visualize the thyroid cartilage, cricoid cartilage, tracheal rings, and thyroid gland. Abbreviations: SCM = sternocleidomastoid muscle, STM = strap muscles, TC = thyroid cartilage, CC = cricoid cartilage, Thyroid = thyroid gland. Please click here to view a larger version of this figure.
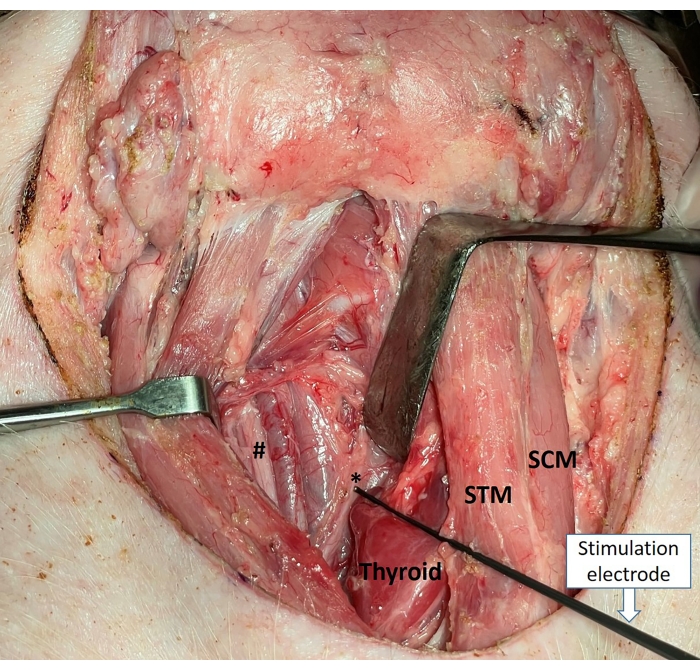
Figure 2: Identify and expose the RLNs (*) and VNs (#). Abbreviations: SCM = sternocleidomastoid muscle, S = strap muscles, TG = thyroid gland, RLN = recurrent laryngeal nerve, VN = vagus nerves. Please click here to view a larger version of this figure.
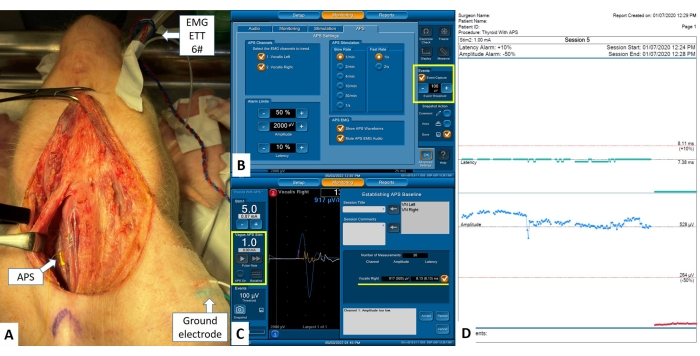
Figure 3: C-IONM settings and recordings. (A) Set up electrodes of C-IONM: recording electrodes- EMG endotracheal tube 6# was intubated; stimulating electrodes was installed on the VN (*); ground electrodes-electrodes were installed outside the surgical incision wound. All the electrodes were connected to the monitoring system. (B) The advanced settings of APS stimuli. (C) Set the current of stimulation and start to obtain the baseline in the Vagus APS Stim column, and the baseline latency and amplitude are tested and calculated automatically in the new window (establishing APS baseline). (D) The sample C-IONM report. Abbreviations: APS = automatic periodic stimulation, EMG = electromyography, ETT = endotracheal tube, C-IONM = continuous intraoperative neural monitoring, RLN = recurrent laryngeal nerve, VN = vagus nerves. Please click here to view a larger version of this figure.
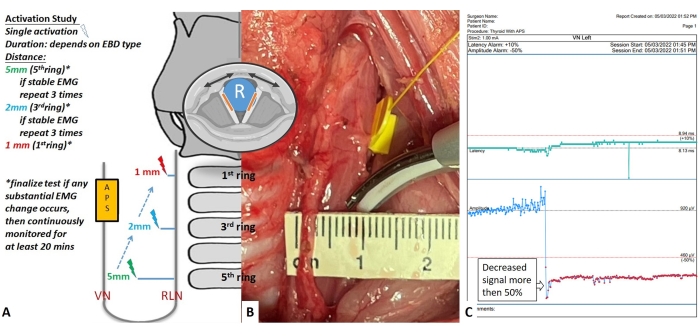
Figure 4: Flowchart of EP activation study protocols. (A) Single activation tests are performed on the RLN from the proximal (caudal) segments to the distal (cranial) segments at different distances. If the EMG response remained unchanged after the three activation tests at the 5 mm distance on the proximal segment, another test was performed at the 2 mm distance. If the EMG response remained stable after repeated tests at the 2 mm distance, final safety tests are performed at the 1 mm distance or by touching the SED tip with the RLN directly. If a substantial decrease of EMG amplitude is observed after any test, the side of RLN experiment is complete, and EMG response will be continuously monitored for at least 20 min. (B) The SED is tested at a 5 mm distance close to the left RLN. (C) APS EMG signal when doing the activation study. Abbreviations: SED = surgical energy device, RLN = recurrent laryngeal nerve, EMG = electromyographic, APS = automatic periodic stimulation. Please click here to view a larger version of this figure.
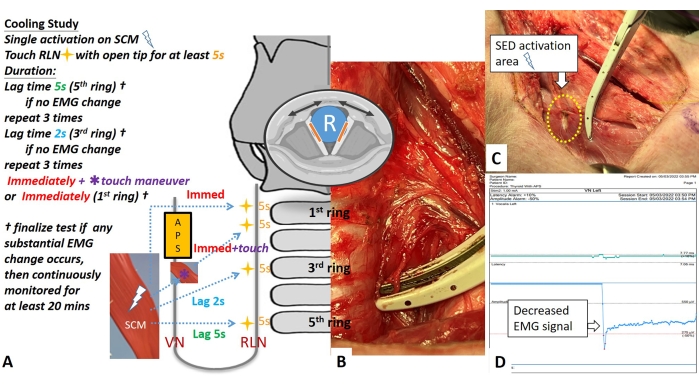
Figure 5: Flowchart of EP cooling study protocol. (A) The tests are performed on the RLN from the proximal (caudal) segments to the distal (cranial) segments. After the SED activation on the ipsilateral SCM muscle (white arrow) and after varying cooling times, touch the tip on the RLN (yellow star) for a 5 s period. If EMG response remained unchanged after three tests of 5 s cooling time, 2 s cooling time tests are performed. If the EMG response remained unchanged after repeated tests, final safety tests are performed by touching the SED tip with the RLN immediately after a single or double activations with or without the touch maneuver (asterisk). (B) The tip of the SED is opened to touch the inner noncoating part on the RLN. (C) The touch maneuver (asterisk) is quick touching/cooling with SCM after activation. (D) The APS EMG signal when doing the cooling study. Abbreviations: RLN = recurrent laryngeal nerve, SCM = sternocleidomastoid, EMG = electromyographic. Please click here to view a larger version of this figure.
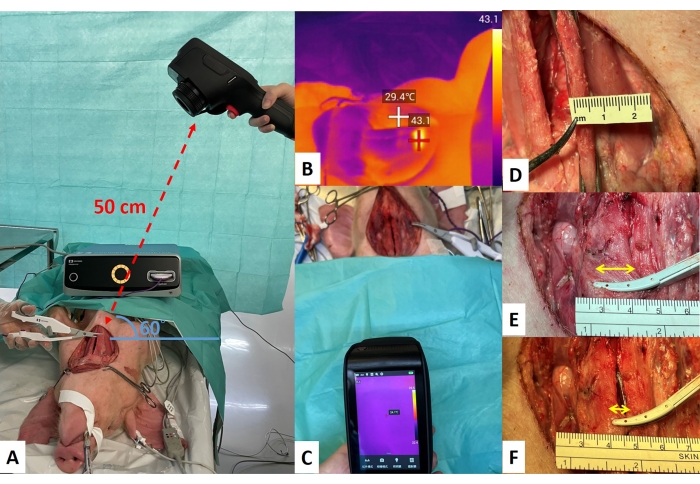
Figure 6: Thermal imaging system setting. (A) The camera was placed 50 cm from the target tissue and at an angle of 60° from the experimental table. (B) The operating field is measured by a thermal imaging camera. The temperature is displayed according to the color scale and the highest temperature on the screen is marked with a "+" sign. (C) Record the background temperature of the experimental area. (D) The standard strap muscle thickness for SED activation is 5 mm. (E) Whole blade test in a dry environment. (F) One-third (1/3) blade tests in a dry environment. Abbreviation: SED = surgical energy devices. Please click here to view a larger version of this figure.
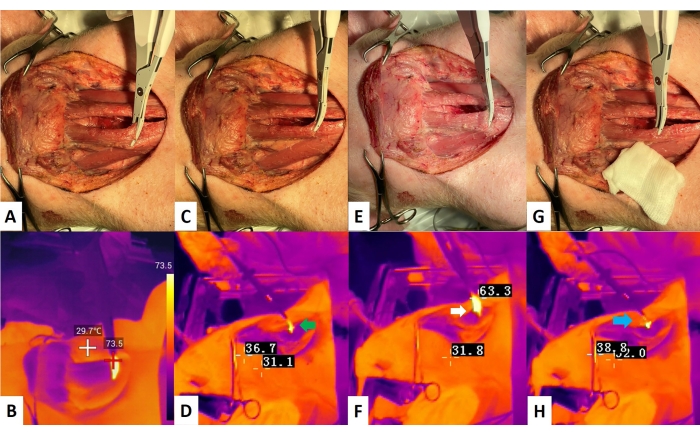
Figure 7: TG activation study. (A,B) A: Whole blade tests in a dry environment; B: TG image, the maximum activation temperature is more than 60 °C during the activation. (C,D) C: One-third (1/3) blade tests in a dry environment; D: TG image, splashing (green arrow) is observed after activation. (E) Whole blade tests in the wet environment; (F) TG image, more obvious lateral thermal spread is observed (white arrow) compared to the dry environment. (G) One-third (1/3) blade tests in a wet environment. (H) TG image, smoke (blue arrow) is more obvious compared to dry environment. Abbreviation: TG = thermographic. Please click here to view a larger version of this figure.
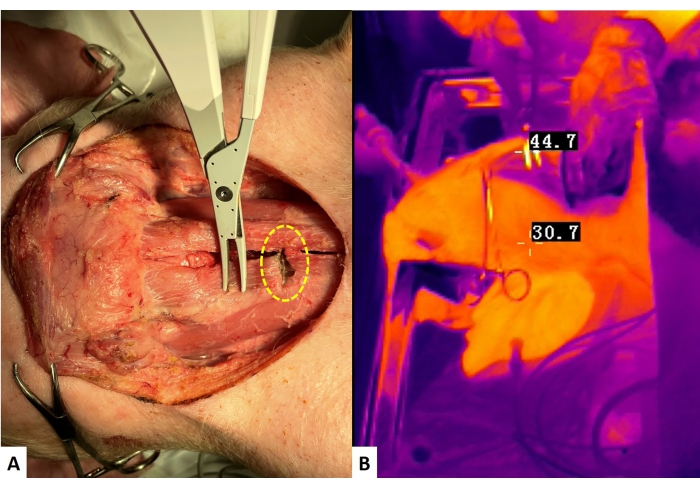
Figure 8: TG cooling study with MTM. (A) After a single activation of the SED with the whole blade on the strap muscle (yellow dotted line circle), quickly touching (approximately 1 s) the activated surface of the SED with another position of the strap muscle. (B) The TG image shows the SED temperature immediately after leaving the SED from the strap muscle with the blade open. When the temperature is more than 60 °C, start recording the cooling time until the highest temperature on the screen is less than 60 °C. Abbreviations: TG = thermographic, MTM = muscle tough maneuver, SED = surgical energy devices. Please click here to view a larger version of this figure.
| Nerve No. | 5 mm, | 2 mm, |
| amplitude status | amplitude status | |
| Nerve 1 | stable (3) | stable (3) |
| Nerve 2 | stable (3) | stable (3) |
| Nerve 3 | stable (3) | stable (3) |
| LOS, loss of signal; The number in brackets are the number of tests | ||
Table 1: Electrophysiological (EP) activation study. This is one of the EP activation study results. Every distance is examined three times until the EMG signal is decreased or lost. Every SED is checked with three nerves. This data is obtained using Device A (Table of Materials).
| No. nerve | 5 s, | 2 s, | Immediately without MTM, |
| amplitude status | amplitude status | amplitude status | |
| Nerve 1 | stable (3) | stable (3) | LOS (1) |
| Nerve 2 | stable (3) | stable (3) | 47% loss (2) |
| Nerve 3 | stable (3) | stable (3) | LOS (2) |
| MTM, muscle touch maneuver; LOS, loss of signal; The number in brackets are the number of tests | |||
Table 2: Electrophysiological (EP) cooling study. This is one of the EP cooling study results. Every distance is examined three times until the EMG signal is decreased or lost. In this experiment, the MTM are also examined. Every SED is checked with three nerves. This data is obtained using Device A (Table of Materials).
| Maximum activation temperature (°C) | |||||
| Blade | Test 1 | Test 2 | Test 4 | Test 5 | Maximum |
| Whole blade | 74.7 | 73.5 | 72.3 | 74.1 | 77.4 |
| Lateral thermal spread distance (in dry environment) (mm) | |||||
| Blade | Test 1 | Test 2 | Test 4 | Test 5 | Maximum |
| Whole blade | 3.7 | 5.2 | 4.9 | 4.2 | 5.3 |
| One-third blade | 4.2 | 4.7 | 4.5 | 5.0# | 5.2# |
| Lateral thermal spread distance (in wet environment) (mm) | |||||
| Blade | Test 1 | Test 2 | Test 4 | Test 5 | Maximum |
| Whole blade | 5.2*# | 4.3# | 6.7 | 4.6# | 6.7*# |
| One-third blade | 3.9*# | 4.5# | 5.1# | 5.7*# | 5.7*# |
| * with smoke; # with splashing | |||||
Table 3: Thermographic (TG) activation study. This is one of the TG activation study results. Every activation is examined five times under camera. This data is obtained using Device A (Table of Materials).
| Minimum cooling time (to 60 °C) without MTM (s) | ||||
| Test 1 | Test 2 | Test 3 | Test 4 | Test 5 |
| 6 | 5 | 5 | 6 | 6 |
| Blade Temperature after MTM (°C) | ||||
| Test 1 | Test 2 | Test 3 | Test 4 | Test 5 |
| 66.4 | 44.7 | 65.3 | 61.5 | 51.8 |
| Minimum cooling time (to 60 °C) with MTM (s) | ||||
| Test 1 | Test 2 | Test 3 | Test 4 | Test 5 |
| 2 | - | 2 | 1 | - |
Table 4: Thermographic (TG) cooling study. This is one of the TG cooling study results. Every activation is examined five times under camera and the cooling time is recorded. This data is obtained using Device A (Table of Materials).
| EP safety parameters | Device A |
| Activation distance | 2 mm |
| Cooling time | 2 $ s |
| TG safety parameters | Device A |
| Activation temperature @ | 77.4 °C |
| Lateral thermal spread distance | |
| Dry condition: whole blade (one-third blade) | 5.3 mm (5.2# mm) |
| Wet condition: whole blade (one-third blade) | 6.7 mm*# (5.7*# mm) |
| Cooling time | |
| without MTM | 6 s |
| with MTM (Blade temperature after MTM) | 2 s (66.4 °C) |
| $ No EMG signal loss after using MTM to cool the SEDs; @ with whole blade in dry environment; | |
| * with smoke; # with splashing; MTM, muscle touch maneuver | |
Table 5: Electrophysiological (EP) and Thermographic (TG) safety parameters. The table integrated the EP and TG safety parameters evaluated in this study. This data is obtained using Device A (Table of Materials).
Discussion
The development of SEDs is based on the expectation of thyroid surgeons to achieve effective hemostasis during thyroid surgery. However, the high temperature generated by SED is a risk factor that cannot be ignored. As the use of SED becomes more common, thermal injury to nerves will also become more common. Therefore, it is the responsibility of the thyroid surgeons who use SED to understand how to safely operate the equipment. However, it is not advisable to verify safety parameters through trial and error repeatedly in humans; therefore, the value of animal experiments has been shown. In addition, a standardized process is necessary to qualify and quantify the possible thermal effects of SEDs15,17 to maximally provide thyroid surgeons with guidelines to safely perform operations.
In this study, several steps require more attention. In the EP studies, neuromuscular blockade agents could interfere with EMG signals during neural monitoring and were not used during anesthesia induction and maintenance. In the TG studies, heat sources other than the SED tests should be removed. When the heat sources cannot be removed (e.g., the activation area for cooling study or strap muscle after MTM), it is necessary to block the non-tested heat sources with gauze. In the TG studies, the temperature of SEDs before activation should be confirmed to be within the background reference temperature (25 ± 2 °C), otherwise, a cooling measure should be taken, and the blade should be determined to be dry before starting the experiment.
Several previous studies have contributed to the definition of EP15,37,38,39,40,41,42,43 and TG31,32 safety parameters of various SEDs in activation and cooling studies in various porcine thyroid surgery models. The current protocol not only integrates past experience but also further optimizes and standardizes the process. In the EP study, once SED was activated without a safe critical distance or safe cooling time, the nerves faced irreversible and rapid injury. In the TG study, we observed the 60 °C isothermal field and the production of smoke/splashing. Surgeons can better understand the thermal spread patterns in different activation environments and different grasping ranges.
This study still has a few limitations. First, the temperature in the environment is not the same as in the surgical room, and the temperature of the piglet is not the same as the body temperature of a human. Second, the results of the porcine model may not be applicable to all human clinical practices; the animal experimental study not only provides surgeons with SED information that cannot be obtained from humans but also serves as a valuable research platform to establish thermal injury information for newly developed SEDs in the future. This information can help surgeons choose instruments and surgical strategies that can reduce thermal injury during thyroid and parathyroid surgery.
This article demonstrates the standard procedure for using animal experiments so that thyroid surgeons can gain a more comprehensive understanding of (1) the safe activation distance and cooling time for SEDs, (2) the maximum temperature generated by SEDs activation, and (3) irregular lateral thermal spread and smoke/splashing, which may potentially injure the nerve.
Disclosures
The authors declare that the research was conducted in the absence of any commercial or financial relationships that could be construed as a potential conflict of interest.
Acknowledgements
This study was supported by grants from Kaohsiung Medical University Hospital, Kaohsiung Medical University (KMUH109-9M44), Kaohsiung Municipal Siaogang Hospital/Kaohsiung Medical University Research Center grants (KMHK-DK(C)110009, I-109-04, H-109-05, I-108-02), and Ministry of Science and Technology (MOST 109-2628-B-037-014, MOST 110-2314-B-037-104-MY2, MOST 110-2314-B-037-120), Taiwan.
Materials
| Name | Company | Catalog Number | Comments |
|---|---|---|---|
| Automatic periodic stimulation (APS) | Medtronic, Jacksonville, FL | 2.0 mm | |
| Advanced bipolar surgical energy devices(SEDs) | Medtronic, Minneapolis, MN | LigaSure Exact Dissector (Device A) | Generator: Valleylab LS10 energy platform Power setting: Default |
| Bipolar electrocautery | Generator: ForceTriad energy platform Power setting: 30 watts | ||
| Duroc-Landrace pigs | 3–4 months old; weighing 18–30 kg | ||
| Electromyography (EMG) Endotracheal tube (ETT) | Medtronic, Jacksonville, FL | #6 NIM Standard Tube | Recording electrodes |
| Ferromagnetic SEDs | Domain Surgical, Salt Lake City, Utah | FMwand, and Fmsealer | Generator: FMX G1 Generator Power setting: FMwand (Max 45); FMsealer (Max 3) |
| Hybrid SEDs (Ultrasonic and Advance bipolar SEDs) | Olympus Co Inc, Tokyo, Japan | Thunderbeat | Generator: Thunderbeat generator ESG USG 400 Power setting: SEAL&CUT mode (Level 1); SEAL mode (Level 3) |
| Monopolar electrocautery | Generator: ForceTriad energy platform Power setting: 15 watts | ||
| Nerve Integrity Monitoring (NIM) system | Medtronic, Jacksonville, FL | NIM 3.0 | Intraoperative neuromonitoring (IONM) equipment |
| Sevoflurane | 1% to 2% for anesthesia maintenance | ||
| Tiletamine/Zolazepam | 2 mg/kg for anesthesia induction | ||
| Thermal imaging camera | Ezo Corp., Taiwan | Thermal camera D4A (384x288 pixels) | Thermal image recording equioments |
| Ultrasonic SEDs | Ethicon, Johnson and Johnson, Cincinnati, OH | Harmonic Focus+ | Generator: Ethicon Endo-Surgery Generator G11 Power setting: Level 5 |
| Ultrasonic SEDs | Medtronic, Minneapolis, MN | Sonicision | Generator: Sonicision Reusable Generator Power setting: maximum power mode (55 kHz) |
References
- Wang, J. J., et al. Improving voice outcomes after thyroid surgery - review of safety parameters for using energy-based devices near the recurrent laryngeal nerve. Front Endocrinol. 12, 793431(2021).
- Cakabay, B., et al. LigaSure versus clamp-and-tie in thyroidectomy: a single-center experience. Advances in Therapy. 26 (11), 1035-1041 (2009).
- Chiang, F. Y., et al. Comparison of hypocalcemia rates between LigaSure and clamp-and-tie hemostatic technique in total thyroidectomies. Head & Neck. 41 (10), 3677-3683 (2019).
- Liu, C. -H., et al. Comparison of surgical complications rates between LigaSure small jaw and clamp-and-tie hemostatic technique in 1,000 neuro-monitored thyroidectomies. Frontiers in Endocrinology. 12, 313(2021).
- Moran, K., et al. Energy vessel sealant devices are associated with decreased risk of neck hematoma after thyroid surgery. Updates in Surgery. 72 (4), 1135-1141 (2020).
- Pacilli, M., et al. Energy based vessel sealing devices in thyroid surgery: a systematic review to clarify the relationship with recurrent laryngeal nerve injuries. Medicina. 56 (12), 651(2020).
- Garas, G., et al. Which hemostatic device in thyroid surgery? A network meta-analysis of surgical technologies. Thyroid. 23 (9), 1138-1150 (2013).
- Wu, C. W., et al. Intraoperative neuromonitoring for the early detection and prevention of RLN traction injury in thyroid surgery: A porcine model. Surgery. 155 (2), 329-339 (2014).
- Wu, C. -W., et al. Intraoperative neural monitoring in thyroid surgery: lessons learned from animal studies. Gland Surgery. 5 (5), 473-480 (2016).
- Dionigi, G., et al. Severity of recurrent laryngeal nerve injuries in thyroid surgery. World Journal of Surgery. 40 (6), 1373-1381 (2016).
- Wu, C. W., et al. Recurrent laryngeal nerve (RLN) injury in thyroid surgery: lessons learned from the intraoperative neural monitoring (IONM). International Journal of Head and Neck Science. 1 (1), 19-26 (2017).
- Dionigi, G., et al. Recurrent laryngeal nerve injury in video-assisted thyroidectomy: lessons learned from neuromonitoring. Surg Endosc. 26 (9), 2601-2608 (2012).
- Dionigi, G. Energy based devices and recurrent laryngeal nerve injury: the need for safer instruments. Langenbeck's Archives of Surgery. 394 (3), 579-580 (2009).
- Kern, K. A. Medicolegal analysis of errors in diagnosis and treatment of surgical endocrine disease. Surgery. 114 (6), 1167-1174 (1993).
- Wu, C. W., et al. Intra-operative neural monitoring of thyroid surgery in a porcine model. Journal of Visualized Experiments. (144), e57919(2019).
- Wu, C. W., et al. Investigation of optimal intensity and safety of electrical nerve stimulation during intraoperative neuromonitoring of the recurrent laryngeal nerve: a prospective porcine model. Head & Neck. 32 (10), 1295-1301 (2010).
- Dionigi, G., et al. Safety of energy based devices for hemostasis in thyroid surgery. Gland Surgery. 5 (5), 490(2016).
- Björck, G., et al. New animal model for assessment of functional laryngeal motor innervation. Ann Otol Rhinol Laryngol. 121 (10), 695-699 (2012).
- Wu, C. W., et al. Feasibility of intraoperative neuromonitoring during thyroid surgery using transcartilage surface recording electrodes. Thyroid. 28 (11), 1508-1516 (2018).
- Wu, C. W., et al. Transcutaneous recording during intraoperative neuromonitoring in thyroid surgery. Thyroid. 28 (11), 1500-1507 (2018).
- Chiang, F. Y., et al. The mechanism of recurrent laryngeal nerve injury during thyroid surgery--the application of intraoperative neuromonitoring. Surgery. 143 (6), 743-749 (2008).
- Randolph, G. W., et al. Electrophysiologic recurrent laryngeal nerve monitoring during thyroid and parathyroid surgery: international standards guideline statement. Laryngoscope. 121, 1-16 (2011).
- Wu, C. -W., et al. Informed consent for intraoperative neural monitoring in thyroid and parathyroid surgery - consensus statement of the International Neural Monitoring Study Group. Frontiers in Endocrinology. 12 (1598), (2021).
- Chiang, F. Y., et al. Standardization of intraoperative neuromonitoring of recurrent laryngeal nerve in thyroid operation. World Journal of Surgery. 34 (2), 223-229 (2010).
- Wu, C. W., et al. International neuromonitoring study group guidelines 2018: Part II: Optimal recurrent laryngeal nerve management for invasive thyroid cancer-incorporation of surgical, laryngeal, and neural electrophysiologic data. Laryngoscope. 128, 18-27 (2018).
- Schneider, R., et al. International neural monitoring study group guideline 2018 part I: Staging bilateral thyroid surgery with monitoring loss of signal. Laryngoscope. 128, 1-17 (2018).
- Wu, C. W., et al. Training courses in laryngeal nerve monitoring in thyroid and parathyroid surgery-The INMSG Consensus Statement. Frontiers in Endocrinology. 12, 705346(2021).
- Dionigi, G., et al. Continuous monitoring of the recurrent laryngeal nerve in thyroid surgery: a critical appraisal. International Journal of Surgery. 11, 44-46 (2013).
- Schneider, R., et al. A new anchor electrode design for continuous neuromonitoring of the recurrent laryngeal nerve by vagal nerve stimulations. Langenbecks Archives of Surgery. 394 (5), 903-910 (2009).
- Sinclair, C. F., et al. Clarifying optimal outcome measures in intermittent and continuous laryngeal neuromonitoring. Head & Neck. 44 (2), 460-471 (2021).
- Hayami, M., et al. Steam induced by the activation of energy devices under a wet condition may cause thermal injury. Surgical Endoscopy. 34 (5), 2295-2302 (2020).
- Hayami, M., et al. Lateral thermal spread induced by energy devices: a porcine model to evaluate the influence on the recurrent laryngeal nerve. Sure Endosc. 33 (12), 4153-4163 (2019).
- Smith, C. T., Zarebczan, B., Alhefdhi, A., Chen, H. Infrared thermographic profiles of vessel sealing devices on thyroid parenchyma. Journal of Surgical Research. 170 (1), 64-68 (2011).
- Seehofer, D., et al. Safety and efficacy of new integrated bipolar and ultrasonic scissors compared to conventional laparoscopic 5-mm sealing and cutting instruments. Surgical Endoscopy. 26 (9), 2541-2549 (2012).
- Kim, F. J., et al. Temperature safety profile of laparoscopic devices: Harmonic ACE (ACE), Ligasure V (LV), and plasma trisector (PT). Surgical Endoscopy. 22 (6), 1464-1469 (2008).
- Lin, Y. C., et al. Electrophysiologic monitoring correlates of recurrent laryngeal nerve heat thermal injury in a porcine model. Laryngoscope. 125 (8), 283-290 (2015).
- Chávez, K. V., et al. Safety assessment of the use of ultrasonic energy in the proximity of the recurrent laryngeal nerve in a porcine model. The American Journal of Surgery. 215 (1), 186-190 (2018).
- Wu, C. W., et al. Recurrent laryngeal nerve safety parameters of the H armonic F ocus during thyroid surgery: Porcine model using continuous monitoring. The Laryngoscope. 125 (12), 2838-2845 (2015).
- Huang, T. Y., et al. Safety parameters of ferromagnetic device during thyroid surgery: Porcine model using continuous neuromonitoring. Head Neck. 42 (10), 2931-2940 (2020).
- Dionigi, G., et al. Safety of LigaSure in recurrent laryngeal nerve dissection-porcine model using continuous monitoring. The Laryngoscope. 127 (7), 1724-1729 (2017).
- Huang, T. -Y., et al. Safety of Ligasure exact dissector in thyroidectomy with continuous neuromonitoring: a porcine model. Gland Surgery. 9 (3), 702(2020).
- Kim, H. K., Chai, Y. J., Lee, H. Y., Kim, H. Y., Dionigi, G. Comparing the safety of harmonic ACE and ACE+ around the recurrent laryngeal nerve in swine models. Annals of Surgical Treatment Research. 94 (6), 285-290 (2018).
- Kwak, H. Y., et al. Thermal injury of the recurrent laryngeal nerve by THUNDERBEAT during thyroid surgery: findings from continuous intraoperative neuromonitoring in a porcine model. Journal of Surgical Research. 200 (1), 177-182 (2016).
Reprints and Permissions
