

Summary
This protocol describes a non-invasive method to efficiently identify S-phase cells for downstream microscopy studies, such as measuring DNA repair protein recruitment by laser micro-irradiation.
Abstract
DNA damage repair maintains the genetic integrity of cells in a highly reactive environment. Cells may accumulate various types of DNA damage due to both endogenous and exogenous sources such as metabolic activities or UV radiation. Without DNA repair, the cell's genetic code becomes compromised, undermining the structures and functions of proteins and potentially causing disease.
Understanding the spatiotemporal dynamics of the different DNA repair pathways in various cell cycle phases is crucial in the field of DNA damage repair. Current fluorescent microscopy techniques provide great tools to measure the recruitment kinetics of different repair proteins after DNA damage induction. DNA synthesis during the S phase of the cell cycle is a peculiar point in cell fate regarding DNA repair. It provides a unique window to screen the entire genome for mistakes. At the same time, DNA synthesis errors also pose a threat to DNA integrity that is not encountered in non-dividing cells. Therefore, DNA repair processes differ significantly in S phase as compared to other phases of the cell cycle, and those differences are poorly understood.
The following protocol describes the preparation of cell lines and the measurement of dynamics of DNA repair proteins in S phase at locally induced DNA damage sites, using a laser-scanning confocal microscope equipped with a 405 nm laser line. Tagged PCNA (with mPlum) is used as a cell cycle marker combined with an AcGFP-labeled repair protein of interest (i.e., EXO1b) to measure the DNA damage recruitment in S phase.
Introduction
Several DNA repair pathways have evolved to address the different types of DNA lesions that can arise in cells, all of which are highly regulated in both space and time. One of the most vulnerable periods of the cell cycle is S phase, when DNA synthesis occurs. While proliferation is fundamental to life, it also provides a major challenge. Cells need to ensure faithful replication of their genome to avoid mutations to be passed down to future generations. Consequently, proliferation provides a therapeutic point of intervention that has been employed for the development of therapeutic approaches in the field of oncology.
All the major techniques used for studying protein recruitment at DNA lesions have their strengths and limitations. Micro-irradiation has better spatial and temporal resolution1 than most of the alternative methods like immunofluorescent imaging of ionizing radiation-induced foci (IRIF), chromatin-immunoprecipitation (ChIP), or biochemical fractionation. However, micro-irradiation lacs the robustness of the aforementioned techniques that can sample a large number of cells at the same time.
To investigate DNA repair in S phase, one must be able to distinguish S phase cells in an asynchronous cell culture population. There are many well-known methods to address this, involving either the synchronization of cells, or visualization of the different cell cycle phases. However, both approaches introduce significant challenges and possible artefacts. Chemical synchronization methods widely used to enrich cells in early S phase (e.g., double thymidine block, aphidicolin, and hydroxyurea treatment) achieve synchronization through the induction of replication stress and eventually DNA damage itself. This limits the use of these methods to study DNA repair processes in S phase2. Synchronization through serum starvation and release is only applicable to a limited number of cell lines, largely excluding cancer cell lines which rely less on growth factors for cell-cycle progression compared to non-transformed cell lines. The Fluorescence Ubiquitin Cell Cycle Indicator (FUCCI) system is a particularly useful tool to study the cell cycle, but it has a fundamental limitation when differentiating between S and G2 cell-cycle phases3.
Here it is shown that using fluorescently tagged PCNA as a non-invasive marker for S phase limits the drawbacks of chemical cell-cycle synchronization methods, while allowing for more specificity and flexibility than the FUCCI system. As a single marker, not only can PCNA highlight S-phase cells in an asynchronous population, but it can also show the exact progression of cells within S phase (i.e., early, mid, or late S-phase)4. Low expression levels of exogenous, tagged PCNA ensures minimal interference with both cell cycle progression and DNA repair processes. Importantly, PCNA also serves as an internal control for proper DNA damage induction as it is involved in the repair of several DNA lesions and is recruited to locally induced DNA damage sites1,4.
The experiments presented here demonstrate how to measure the recruitment dynamics of EXO1b in S phase and how this is affected by the well-established PARP inhibitor, olaparib. EXO1b nuclease activity is relevant to a wide range of DNA repair pathways including mismatch repair (MMR), nucleotide excision repair (NER), and double-stranded break (DSB) repair. In S phase, EXO1b plays a major role in homologous recombination (HR) through the formation of 3' ssDNA overhangs during DNA resection5. EXO1b has been further implicated in DNA replication with roles in checkpoint activation to restart stalled DNA forks as well as primer removal and Okazaki fragment maturation at the lagging strand during strand displacement in replication5. EXO1b recruitment to damaged DNA sites is regulated by the direct interaction with poly (ADP-ribose) (PAR)6,7. Due to the numerous cell-cycle specific implications of EXO1b, it is an excellent choice for S-phase specific recruitment studies using PCNA.
Protocol
1. Cultivation of human osteosarcoma-derived cells (U-2 OS)
NOTE: U-2 OS cells are ideal for these studies as they have a flat morphology, large nucleus and strongly attach to several surfaces, including glass. Other cell lines with similar characteristics could also be used.
- For cultivation of U-2 OS cell lines, use McCoy's 5A medium supplemented with 10% fetal bovine serum (FBS) and antibiotics (100 U/mL penicillin and 100 µg/mL streptomycin). Incubate cells at 37 °C in a humidified atmosphere containing 5% CO2. For microscopy studies, maintain cell culture in a 10 cm dish to provide sufficient cell count.
- When cells approach 90% confluency (~7 x 10⁶ cells/10 cm dish), split the cells.
- Rinse cells with PBS to wash away trypsin inhibitors contained within the serum.
- Add 1 mL of Trypsin-EDTA and ensure that the cell layer is equally covered.
- Incubate at 37 °C until the cell layer is lifted off the plate (approximately 6 min).
- Resuspend the trypsinized cells in serum containing media to inactivate the trypsin and add 1/10th of the volume (~0.7 x 10⁶ cells) into a new 10 cm plate containing 10 mL of supplemented growth medium.
- Prior to experimentation, routinely test cells for mycoplasma contamination using the Universal Mycoplasma Detection kit following the manufacturer's recommendation.
2. Retroviral infection
NOTE: For BSL-2 safety measures and while working with recombinant viruses, please refer to: NIH Guidelines, Section III-D-3: Recombinant viruses in tissue culture.
- Seed 4 x 10⁶ HEK293T cells to achieve ~60% confluency within 24 h after plating into a 10 cm culture dish.
- For cultivating HEK293T please follow the cultivation steps of U-2 OS described in 1.1-1.3 of this protocol. For HEK293T substitute McCoy's 5A medium for DMEM. Be sure to always gently wash HEK293T cells as they attach to tissue culture plates weakly.
- Transfect HEK293T cells using a lipid-based transfection reagent for viral packaging of plasmids.
- For retroviral vectors, combine 1.5 µg of VSV-G (Addgene #8454) and 1.5 µg of pUMVC (Addgene #8449) packaging vectors along with 3 µg of the vector containing the gene of interest (in a retroviral vector backbone with puromycin resistance) into 250 µL of Opti-MEM reduced serum media in a microcentrifuge tube. Add 1 µL of P3000 reagent for each µg of DNA added into the Opti-MEM/DNA mixture (in this case 6 µL) and mix gently by tapping. Do not vortex or pipette up and down.
- In another microcentrifuge tube, combine 2 µL per µg DNA (in this case 12 µL) of transfection reagent with 250 µL of Opti-MEM reduced serum media.
- Combine the two mixtures (500 µL combined, do not vortex, only mix by gentle tapping) and let it incubate for 15 min at room temperature.
- Carefully, add the mixture dropwise to the seeded HEK293T cells without detaching the cells. Swirl the plates gently.
- Viral infection to generate stable cell lines.
- Remove the virus containing supernatant from the HEK293T cells 72 h after transfection. Carefully filter the solution with a 0.45 µm filter to remove cell debris and detached cells. Optionally, add 8 µg/mL polybrene to the viral supernatant to facilitate viral infection.
- Add virus containing supernatant to U-2 OS cells at ~50% confluency in a 10 cm dish (~3 x 10⁶ cells). Seed the U-2 OS cells the day before.
- Infect for 6-16 h before removing and discarding the virus-containing supernatant.
NOTE: To achieve the desired amount of overexpression for the gene of interest, incubate a series of viral dilutions for a fixed amount of time. Check the expression levels of the transgene in each newly established cell line with western blot comparing it to endogenous levels. - Allow cells to select in the presence of appropriate antibiotics (for 3-4 days in case of puromycin at 2 μg/mL final concentration) and verify the expression of the fluorescent protein tagged gene of interest under a microscope.
- Repeat these steps to generate double labeled cell lines. In the experiments presented here mPlum-PCNA was expressed from a retroviral vector (pBABE) combined with EXO1B-AcGFP, also expressed from a retroviral vector (pRetroQ-AcGFP1-N1).
3. Preparation of cells for micro-irradiation
- Plating cells: 24 h before the experiment, plate a total of 8.0 x 10⁴ cells into a volume between 500 µL-1 mL of media (for roughly 70% confluency) on a four well chambered coverglass with a No. 1.5 borosilicate glass bottom which delivers ideal results for high-magnification confocal microscopy and laser micro-irradiation. A higher cell confluency allows for more cells measured in a single field of view (FOV); however fully confluent slides will introduce cell cycle irregularities.
- Imaging media: An hour before micro-irradiation, exchange regular growth medium for FluoroBrite DMEM supplemented with 10% FBS, 100 U/mL penicillin and 100 µg/mL streptomycin, 15 mM HEPES (pH=7.4) and 1 mM sodium-pyruvate. This imaging media helps maximize the signal-to-noise ratio allowing the detection of very dim fluorescence. Since it contains HEPES, it also stabilizes pH in the absence of a 5% CO2 atmosphere.
- Apply any additional treatment before the imaging at this step. In the experiments presented here, cells were pre-treated one hour before imaging with either olaparib (PARP inhibitor, at 1 µM final concentration) or a vehicle control (DMSO)1,8,9.
4. Preparing the microscope and selecting S phase cells for imaging.
- Use a confocal system that has the similar properties as the system outlined here for best results. The experiments presented here were performed using a confocal microscope mounted on an inverted microscope stand (see Table of Materials).
NOTE: The microscope used here was equipped with a 50 mW 405 nm FRAP laser module, and a 60x 1.4 NA oil plan-apochromat objective. The confocal scanhead had two scanner options: a galvano scanner (for high resolution) and resonant scanner (for high-speed imaging).- Introduce fluorescence recovery after photobleaching (FRAP) laser to the sample via a software controlled XY galvano device. Use a 488 nm laser line to excite AcGFP and a 561 nm or 594 nm laser line to excite mPlum.
NOTE: The following filter combination gives optimal results: using a 560 nm long pass filter, emission light with a wavelength lower than 560 nm was passed through a 525/50 nm emission filter for AcGFP, while emission light with a wavelength higher than 560 nm was passed through a 595/50 nm emission filter for mPlum. Any appropriate filter set (e.g., FITC/TRITC, GFP/mCherry, FITC/TxRed) that ensures minimal fluorescence bleed-through could be used.
- Introduce fluorescence recovery after photobleaching (FRAP) laser to the sample via a software controlled XY galvano device. Use a 488 nm laser line to excite AcGFP and a 561 nm or 594 nm laser line to excite mPlum.
- Turn on the environmental chamber and the microscope components.
- Turn on the heating (stage, objective, and environmental chamber when possible), CO2 supply and the humidity regulator at least 4 h before the start of the experiment to ensure thermal equilibration for stable image acquisition.
- Initialize light sources along with the laser lines at least 1 h before the transfer of the cells to the microscope.
- Select S-phase cells in an asynchronous population using fluorescently tagged PCNA as a marker. Do this by following the steps below.
- Look for the unique localization pattern of the mPlum-tagged PCNA in S phase making identification of this cell cycle phase possible. PCNA has a completely homogeneous distribution in the nucleus in G1 and G2 phases of the cell cycle, while being excluded from the nucleoli. In S-phase, PCNA forms foci at the location of replisomes in the nucleus. Figure 1 shows the different patterns of PCNA foci throughout S-phase, which makes it possible to even differentiate early, mid, and late S-phase.
- Look through the ocular to select an FOV that has enough S-phase cells for micro-irradiation. Asynchronous U-2 OS cells usually have 30-40% of their population in S phase.
- Try to avoid extremes in expression levels (bright and dim cells alike) for both PCNA and the protein of interest (POI), in this case EXO1b-AcGFP, which could lead to experimental artefacts.
- When finding a suitable FOV, try to avoid scanning the field for a long time to minimize photobleaching and unwanted DNA damage.
- Set the desired region of interest (ROI) for micro-irradiation. Using the associated software (see Table of Materials), set desired ROI by first inserting binary lines (set the desired number of lines and spacing). Click Binary, then click Insert line | Circle | Ellipse to draw the desired number of lines.
- Convert these binary lines to ROIs and finally convert these ROIs into stimulation ROIs. To do that, first click ROI, then click Move Binary to ROI, then right click on any of the ROIs and select Use as Stimulation ROI: S1. Place these lines in the FOV to pass through the nucleus of the cells. ROIs with a length of 1024 pixels that spanned the entire FOV were used throughout the protocol.
5. Micro-irradiation for immunofluorescence staining or time lapse imaging.
- Determining optimal micro-irradiation settings.
- Before micro-irradiation of the cells, take a higher resolution image of the FOV to identify PCNA foci for later analysis. Instead of sequential scanning, simultaneously record both optical channels used (green and red), to avoid cell movement between scanning at the two wavelengths. For proper resolution of the foci use at least 1024 x 1024 pixels/field resolution with 1x zoom (0.29 μm pixel size on the imaging system used here), with 1/8 frame/s scanning speed (4.85 μs/pixel) with 2x averaging. Once these parameters are set in the A1 LFOV Compact GUI and the A1 LFOV Scan Area windows, hit the Capture button to record the FOV.
NOTE: It is important to maintain the same pixel size throughout experiments to ensure comparable results. - To set up the micro-irradiation, open the ND Stimulation tab in the imaging software to access the Time schedule (A1 LFOV / Galvano Device) window.This uses the galvano scanners to acquire a series of pre-stimulation images, stimulate (using the LUN-F 50 mW 405 nm FRAP laser), and then acquire a series of post-stimulation images again using the galvano scanners. First set up three phases in the Time schedule window. In the Acq/Stim column select Acquisition | Bleaching | Acquisition for the three phases respectively. For the bleaching phase, set S1 as the ROI.
NOTE: In the experiment presented here, no images were acquired during the stimulation phase. - In the Galvano XY window, set up the key factors for micro-irradiation: 405 nm laser power output, dwell time (iteration is 1 by default on this system). In the experiments presented here, cells were irradiated with the 405 nm FRAP laser (50 mW at the fiber tip) at 100% power output with a 1000-3000 µs dwell time.
NOTE: Because laser dwell time is on a per pixel basis, as long as pixel size remains the same, the relationship between the dwell time and power density will be comparable between different FOVs. Figure 2A shows the use of DNA damage response (DDR) pathway specific proteins (FBXL10 for DSBs and NTHL1 for oxidative base damage) to optimize laser power settings for specific damage induction. These stable cell lines were generated with viral infection following section 2 of the protocol.
- Before micro-irradiation of the cells, take a higher resolution image of the FOV to identify PCNA foci for later analysis. Instead of sequential scanning, simultaneously record both optical channels used (green and red), to avoid cell movement between scanning at the two wavelengths. For proper resolution of the foci use at least 1024 x 1024 pixels/field resolution with 1x zoom (0.29 μm pixel size on the imaging system used here), with 1/8 frame/s scanning speed (4.85 μs/pixel) with 2x averaging. Once these parameters are set in the A1 LFOV Compact GUI and the A1 LFOV Scan Area windows, hit the Capture button to record the FOV.
- Time lapse imaging.
- Set up time lapse imaging for the desired time window and intervals using the Time schedule, A1 LFOV Compact GUI and the A1 LFOV Scan Area windows. In the experiments presented here, the recruitment of EXO1b and PCNA was imaged for 12 min, scanning the FOV every 5 seconds, at 1024 x 1024 pixels/field, using 1x zoom (resulting in 0.29 µm pixel size on the imaging system used here) with 0.35 frame/s scanning speed (1.45 µs/pixel) without averaging to reduce photo-bleaching.
- Optimize the laser power %, gain and offset settings to reduce photo-bleaching during the imaging in the A1 LFOV Compact GUI window. If one aims to measure both POI and PCNA, use simultaneous scanning instead of sequential scanning to avoid cell movement between scanning the field for the two separate fluorophores.
- The imaging system was used with the following settings. For the 488 nm laser line (20 mW): 7% laser power, gain: 45 (GaAsP detector) with and offset of 2, for the 561 nm laser line (20 mW): 4% laser power, gain 40 (GaAsP detector) with and offset of 2.
- Depending on the kinetics of the protein, extend or shorten the interval between images or the duration of the total time lapse. In the Time Schedule window, set the desired Interval and Duration for the third phase Acquisition row.
- Press Run now to execute the micro-irradiation and the subsequent time lapse imaging.
- At the end of the time lapse imaging, save the stimulation ROIs as separate images, which will be a useful aid to identify the coordinates of micro-irradiation in any downstream software used for analysis.
- Immunofluorescence staining.
NOTE: Step 5.1.3 and Figure 2A demonstrates the use of known DNA repair proteins to assess the types of DNA lesions introduced by micro-irradiation. Certain DNA lesions can also be detected by using specific antibodies after fixing the cells. It is also possible to detect the recruitment of the POI by antibody detection of the endogenous protein. The visualization of γH2A.X to check for DSBs is demonstrated below (Figure 2B). Figure 3 shows the consistency of PCNA localization and recruitment throughout cell cycle for both endogenous and exogenous tagged PCNA.- After step 5.1.3, take just one image after micro-irradiation to ensure proper FRAP event based on the recruitment of mPlum-PCNA. Take note of the exact coordinates of the FOV to to find the field later after the immunofluorescent labeling.
- Take the cell culture chamber out of the microscope and incubate cells at 37 °C in a humidified atmosphere containing 5% CO2 for 5-10 min.
NOTE: Paraformaldehyde (PFA) is toxic, and work should be done in a well-ventilated area or a fume hood. All subsequent washing and incubation will be done with 0.5 mL volumes in the 4 well chamber slide. After the incubation time, wash the cells with 0.5 mL of PBS (137 mM NaCl, 2.7 mM KCl, 8 mM Na2HPO4, and 2 mM KH2PO4) and fix with 0.5 mL of 4% PFA in PBS for 10 min at room temperature (RT). - Wash the cells once with PBS, then wash them with 50 mM NH4Cl to quench residual PFA.
- Permeabilize the cells for 15 min at RT with 0.1% Triton X-100 in PBS.
- Block the samples for 1 h with blocking buffer (5% FBS, 3% BSA, 0.05% Triton X-100 in PBS).
- Remove the blocking solution and add the diluted primary antibody (anti-γH2A.X, 1:2000) in blocking buffer for 1 h at RT.
- Wash the wells with blocking buffer 3 x 10 min.
- Add diluted secondary antibody (anti-mouse Alexa 488 Plus conjugate, 1:2000) in blocking buffer for 1 h at RT.
- Wash the wells with blocking buffer 3 x 10 min.
- Counterstain the nucleus with 1 µg/mL DAPI solution in PBS for 15 min.
- Wash the cells once with PBS. The imaging can be performed directly in PBS or a PBS solution with antifade reagents (e.g., AFR3) to reduce photobleaching.
6. Recruitment analysis
NOTE: Figure 4A shows representative images of Exo1b and PCNA recruitment in the presence of DMSO or olaparib. Figure 4B shows a representative image for data analysis. Mean fluorescence values were calculated by measuring mean AcGFP intensities using a rectangle along the laser track highlighted by the mPlum-PCNA (A, yellow rectangles) across different timepoints using Fiji. PCNA can serve as an internal control to highlight successful irradiation along the ROI coordinates. Similarly, mean AcGFP fluorescence values were also calculated for undamaged regions of the nucleus (B, blue rectangles). Background signal intensity was measured in unpopulated areas (C, red rectangles) and was subtracted from the mean fluorescent values (Figure A and B). Thus, the relative mean fluorescent unit (RFU) for each data collection point was calculated by the equation RFU = (A − C)/ (B − C)8,9. The resulting RFU values of the micro-irradiated region is normalized to the RFU values prior to micro-irradiation.
- For defining the region A of the micro-irradiated site, exclude nucleolar regions, replication foci, and irregular nuclear regions of the cell from measurement. Hold shift key in between drawing two ROIs in Fiji to group two separate regions as one.
NOTE: Protein recruitment will vary among different genes and irradiation conditions; thus, the size of region A must be determined individually. Once pixel width of region A is determined, it should remain constant for any comparative recruitments. In the experiments presented here, 7 pixel width rectangles were used. - Exclude cells that moved during the duration of the recorded videos from analysis. To include highly mobile cells, the described analysis must be carried out frame-by-frame.
- To visualize the recruitment profile, plot the normalized RFU values against time using a statistical software.
- Calculate the difference at an indicated time-point between DMSO and olaparib (n=31) treatment using a Mann-Whitney test.
Representative Results
Cells address each type of DNA lesion in a specific manner that also depends on which cell cycle phase they are in. For example, following micro-irradiation, double-stranded breaks (DSB) will be processed either by non-homologous end joining (NHEJ) or HR depending on the cell cycle phase. Nucleases acting most extensively during the S and G2 phases of the cell cycle create DNA overhangs that are crucial for proper HR. To promote the evaluation of cells in S phase, PCNA was employed as a single-color cell cycle marker. Figure 1A shows the localization profile of mPlum-PCNA during cell cycle progression. PCNA has a completely homogeneous distribution in the nucleus in G1 and G2 phase (while also being mostly excluded from the nucleoli). In S phase, PCNA localizes to sites of DNA replication, which can be visualized as bright spots in the nucleus. In early S phase cells, the spots are relatively small and equally distributed throughout the nucleus of the cell. Progressing into mid S phase, the spots become blurred and localize more towards the perimeter of the nucleus and the nucleoli. In late S phase, the spots reduce in numbers but become increasingly large as PCNA concentrates at late replication sites (Figure 1B). Importantly, exogenous PCNA expression from the pBABE vector backbone was less than the endogenous levels but was enough for detection by microscopy which minimizes potential artefacts in cell cycle progression and DDR. Figure 1C shows the extent of PCNA overexpression compared to endogenous levels. Please note that the band corresponding to mPlum-PCNA migrates slower due to its larger size.
We aimed to introduce DSBs during micro-irradiation to investigate the PARP1/2-dependent recruitment of EXO1b to these lesions in S phase. Figure 2A shows that low doses of energy (1000 µs dwell time) do not induce the recruitment of EGFP-FBXL10, a DSB responder (component of the FRUCC complex 8), while it was sufficient to induce the recruitment of NTHL1-mCherry, a base excision repair (BER) pathway protein, recruiting to sites of oxidative DNA damage10,11,12. At 3000 µs dwell time, both EGFP-FBXL10 and NTHL1-mCherry recruit, demonstrating a laser output that generates both oxidative lesions and DSBs. Strengthening these results, Figure 2B shows immunofluorescence staining against γH2A.X (DSB marker), which is clearly more apparent when using higher energy doses. PCNA serves as both a cell cycle marker and a marker for successful micro-irradiation, as it adequately recruits with both laser dwell time settings. Importantly, both exogenous and/or endogenous fluorescent protein-tagged PCNA can be used for this reporter function as they behave similarly (Figure 3). Endogenously tagged PCNA was engineered by inserting mRuby in frame with the first exon into one allele of the PCNA locus13 (the cell line was a kind gift of Jörg Mansfeld).
Figure 4A and Figure 4C shows the recruitment of AcGFP-tagged EXO1b in S phase cells. EXO1b reaches maximum level of accumulation at micro-irradiation sites around 1 minute and then slowly starts disengaging from the DNA lesions afterwards. Enrichments at micro-irradiation sites are denoted by a > 1 relative fluorescence unit on the graph. In the presence of olaparib, accumulation of EXO1b at the laser stripe at 1 minute is significantly less compared to the vehicle control. These results are in agreement with the literature6,7. Figure 4B demonstrates representative regions for quantification (areas A, B, and C) as described in point 6 in the protocol. Figure 4D shows the comparable expression levels of endogenous EXO1b and exogenous EXO1b-AcGFP in cells used for micro-irradiation.
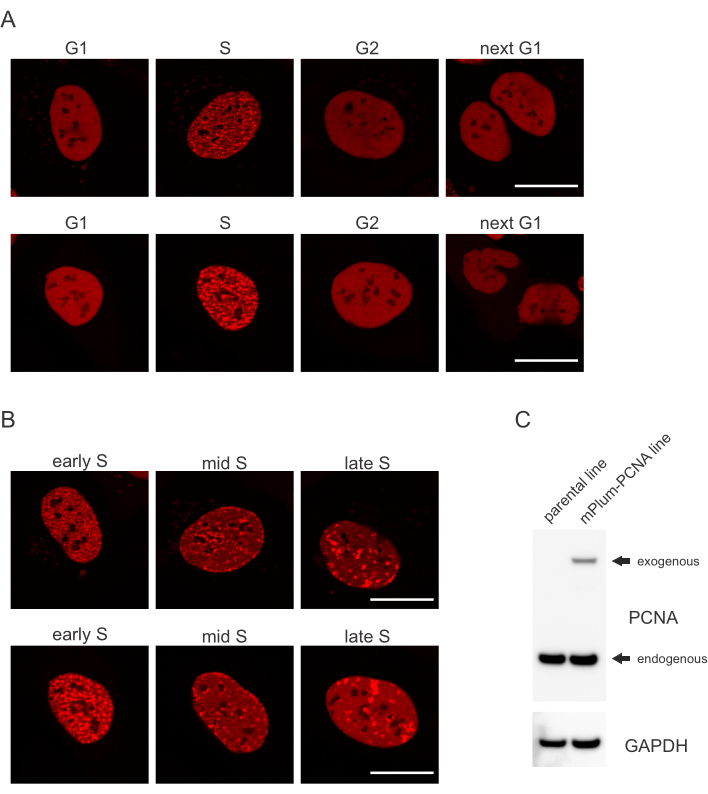
Figure 1: Localization pattern of PCNA. (A) Images show localization pattern of stably integrated, exogenous PCNA throughout the cell cycle in U-2 OS cells. (B) Images show PCNA foci patterns in different stages of S phase (early, mid, and late) in U-2 OS cells. (C) Western blot showing endogenous and exogenous levels of PCNA in the U-2 OS cells used for imaging. Scale bar represents 20 µm. Please click here to view a larger version of this figure.

Figure 2: Induction of DSBs through optimized laser power output. (A) Laser settings can be optimized to induce different forms of DNA damage. U-2 OS cells stably expressing both EGFP-FBXL10 and NTHL1-mCherry were used to identify DSBs and sites of oxidative lesions, respectively. Micro-irradiation with a 405 nm laser line was carried out on asynchronous U-2 OS cells with either 1000 µs or 3000 µs dwell time. Scale bar represents 20 µm. (B) Immunofluorescent staining against γH2A.X was done on human retinal pigment epithelial cells (hTERT RPE-1) having mRuby-tagged endogenous PCNA. Cells were fixed and processed 5 minutes after micro-irradiation with either 1000 µs or 3000 µs dwell time. Scale bar represents 20 µm. Please click here to view a larger version of this figure.

Figure 3: Comparable recruitment of endogenous mRuby-PCNA and exogenous mPlum-PCNA to micro-irradiation sites at 1000 µs or 3000 µs laser dwell time. Both endogenous and exogenous tagged PCNA form replication foci during S phase. Please click here to view a larger version of this figure.

Figure 4: PARP1/2-dependent recruitment of EXO1b in S phase. U-2 OS cells stably expressing EXO1b-AcGFP and mPlum-PCNA were micro-irradiated with 405 nm FRAP laser line using 3000 µs dwell time. (A) Representative images of micro-irradiated cells at the indicated time points after pre-treatment with either vehicle control (DMSO) or olaparib (1 µM). Scale bar represents 20 µm. (B) Representative images of defined regions of A, B, and C areas for the recruitment analysis. Scale bar represents 20 µm. (C) DNA damage recruitment dynamics was captured by live cell imaging. Relative mean fluorescence values and images were acquired every 5 s for 12 min. For each condition, ≥30 cells were evaluated. Mean relative fluorescence values (solid black lines) and standard error (range visualized by a shaded area) were plotted against time. Dashed line shows recruitment values at 1 min after micro-irradiation. The difference between DMSO (n=32) and olaparib (n=31) treatment was calculated using a Mann-Whitney test. Asterix denotes p<0.0001. (D) Western blot compares the expression levels of endogenous EXO1b and exogenous EXO1b-AcGFP in cells used for micro-irradiation. Please click here to view a larger version of this figure.
Discussion
Critical steps and potential protocol troubleshooting/modifications
Proper tissue culture vessel for micro-irradiation is critical for success. Most high-resolution imaging systems are optimized for 0.17 mm cover glass thickness. Using higher or lower thickness imaging chambers or ones made from plastic polymers (not optimized for 405 nm imaging), can significantly reduce image quality. When using glass surfaces, make sure that they are tissue-culture treated to enhance cell adhesion. If they are not tissue-culture treated, these chambers will need to be coated, for example, with poly-D-lysine before seeding the cells. When plating cells into the chambered coverglass, ideal cell density is paramount to avoid cell cycle irregularities and additional stress to the cells. Proper thermal equilibration of the microscope components prior to experimentation to maintain a stable temperature is crucial for both maintaining the focus throughout the time lapse imaging and is also necessary to ensure a homogeneous DDR across time and samples.
It is critical that cells are in a healthy condition prior to micro-irradiation to reduce artefactual data. If cells have irregular morphology post-infection/selection, allow cells to progress through multiple passages until morphology returns to normal. Always make sure that the cells lines used are free of mycoplasma contamination. Among the many adverse effects of mycoplasma infection, it also causes DNA damage to the host cells and could affect their DDR pathways14,15. The most sensitive way to detect mycoplasma in the cell culture is through PCR (versus. detection with DAPI or Hoechst).
Optimal overexpression of the repair protein of interest should be comparable to endogenous levels, however, high enough for detection. The promoter used on the viral vectors, the viral titer during infection, and the length of the infection time can all be adjusted for ideal expression levels. For consistent results, isolate individual cell clones to ensure homogeneous expression levels and normal cell morphology. It is recommended to use vector constructs that do not overexpress tagged PCNA at higher than endogenous levels for proper cell-cycle and DNA repair marker function. Even low levels of PCNA overexpression are sufficient to discriminate S-phase cells. Retroviral pBABE vectors have been successfully used for this purpose (Addgene #1764, #1765, #1766, #1767). PCNA can be tagged with any monomeric red (e.g., mPlum, mCherry, mRuby, etc.) or monomeric green fluorescent proteins (e.g., mEGFP, AcGFP, mWasabi, mNeonGreen, mEmerald, etc.) which could then be combined with an alternately tagged POI. Overexpressing a fluorescently tagged POI has some limitations and considerations. Fluorescent tags may disrupt normal protein function and localization. Thus, the location of the tag (N or C-terminal) must be considered. Always use monomeric fluorescent proteins, as oligomerization of non-monomeric variants can affect the function of the POI.
The laser settings must be determined for each imaging system as many components of the optical path will affect the actual power delivered into the cells. Laser micro-irradiation can cause several types of DNA lesions depending on the excitation wavelength, the power output of the FRAP laser and if any pre-sensitizing agents (like Bromodeoxyuridine or Hoechst) were used. 405 nm lasers can cause oxidative DNA damage, single and double stranded breaks16,17. By using higher laser output settings, the amount of DSBs increases. In this protocol pre-sensitization methods were not utilized, but these techniques are greatly covered in the literature and re-capped in the discussion below. In our opinion, the best way to test if the desired lesion is generated is by testing for the recruitment of known DNA damage pathway specific genes. Recruitment of NTHL1 or OGG1, components of the BER pathway, suggests the induction of oxidized DNA bases10,11,17,18,19, while FBXL10 or XRCC5 indicate the presence of DSBs8,20,21. Recruitment of XRCC1 can indicate both the presence of oxidized DNA bases and single stranded breaks (SSB)22,23. XPC (i.e., RAD4) is a good indicator of NER that removes the bulky DNA adducts generated by ultraviolet light (UV)17,24. Because recruiting exogenous proteins may introduce certain irregularities, immunofluorescent staining of endogenous DNA repair proteins or markers (like γH2A.X for double stranded breaks) can confirm the presence of specific DNA lesions. Alternatively, antibodies raised against specific types of DNA lesions could also be used. To adjust the delivered laser power, both the dwell time and the laser power can be changed.
With the help of mathematical modeling, a detailed kinetic analysis could be performed that can provide valuable insights into the recruitment properties of the POI (e.g., contribution of multiple DNA binding domains, sensitivity towards different signaling events, etc.). Automated recruitment evaluation and cell tracking could be combined to create robust workflows 1,25.
Advantages and limitations of DNA pre-sensitization
Pre-sensitization of DNA prior to micro-irradiation is a commonly used tool for DNA repair protein recruitment16,17. Sensitizing DNA prior to micro-irradiation leaves it more susceptible to DSBs. The two most common methods for DNA pre-sensitization are pre-treatment of cells with either Bromodeoxyuridine (BrdU) or Hoechst dye. For systems not capable of micro-irradiation at high laser powers, these methods may be necessary for inducing DNA lesions like DSBs. Additionally, in the absence of a transmitted light detector or a fluorescent signal highlighting the cell nucleus (for example, when studying the recruitment of untagged endogenous DNA repair proteins), Hoechst acts as both a pre-sensitizing tool and a fluorescent nuclear stain. However, DNA pre-sensitization can introduce significant complications. BrdU (used at a final concentration of 10 µM) must be added to cells 24 hours (or time equivalent to a full cell cycle in the cell line used) to properly incorporate into DNA and can cause cell cycle interference26. Hoechst 33342 (used at a final concentration of 1 µg/mL) is cytotoxic after long incubation periods but requires sufficient time to saturate the nucleus with the dye. Therefore, it should only be applied 15-20 minutes prior to micro-irradiation; otherwise, the recruitment data will not be consistent. The cells stained this way cannot be kept in culture for more than a few hours27,28. Make sure not to use Hoechst 33358, which is not as cell permeable as the Hoechst 33342 dye. Pre-sensitization can also introduce unnecessary variance among experiments and makes the experiment even more sensitive to differences in cell density (as this will affect the amount of incorporated dye / cell).
Advantages and limitations of confocal microscopy
Imaging speed of confocal microscopy can be limiting when compared to widefield microcopy. However, a confocal microscope equipped with a resonant scanner can tremendously improve imaging speed (at the cost of resolution) coming close to speeds of spinning-disk microscopy. Three features make the A1R HD25 confocal system an excellent choice for the protocol presented here. First, the 25 mm FOV of the system makes it possible to image between 15-20 cells in a single scanned field (vs. 5-10 cells in regular setups), limiting the number of acquisitions necessary to get enough cells for statistical analysis. Second, the FRAP module and two scanheads make it possible to image and micro-irradiate the cells simultaneously, not just sequentially. Lastly, the flexibility of having both the resonant and galvano scanners provides the ability to easily switch between high-temporal resolution imaging with exceptional speed which minimizes quenching of fluorophores, and high-spatial resolution imaging that utilizes slower scanning speeds to produce images with a higher signal to noise ratio. While the used system allowed for the aforementioned flexibility, to resemble more widely available confocal microscope configurations, only the galvano scanner was used in the presented experiments (for both micro-irradiation and subsequent imaging).
Advantages and limitations of micro-irradiation
While micro-irradiation provides unrivaled spatial and temporal resolution, it is not without limitations. DNA damage by laser micro-irradiation is highly clustered to specific parts of the nucleus compared to naturally occurring damaging agents. Thus, chromatin response due to micro-irradiation may differ compared to homogeneously distributed damage. Additionally, micro-irradiation is time consuming and may only be conducted on a few dozen cells, while large population-based biochemical methods (chromatin fractionation, immunoprecipitation, ChIP) can provide increased robustness by studying thousands of cells at a time. Verifying observations made by micro-irradiation with traditional biochemical techniques is an effective strategy for reliable conclusions. Though simultaneous micro-irradiation of many cells in a certain FOV is possible, the imaging system will need more time to perform the task. Therefore, measuring the dynamics of proteins that recruit very rapidly to DNA lesions limits the number of possible ROIs for micro-irradiation used simultaneously. On the imaging system used for this protocol, the micro-irradiation of a single 1024 pixel long ROI takes 1032 ms using 1000 μs dwell time and 3088 ms using 3000 μs dwell time to complete. Using multiple lines of ROIs will significantly increase the time needed to finish micro-irradiation (e.g., 7 x 1024 pixel long ROI takes 14402 ms using 1000 µs dwell time and 21598 ms using 3000 µs dwell time). This time is lost from image acquisition and must be taken into consideration. When imaging rapid recruitment events, use the shortest ROI possible and only micro-irradiate one cell at a time.
Advantages and limitations over synchronization methods
For cell cycle specific studies, the existing methods involve either the synchronization of cells into specific cell cycle phases or using fluorescent reporters to identify the specific cell cycle phase of the cell. However, each of these methods provides their own challenges and limitations.
The FUCCI system3 (relying on fluorescent protein tagged truncated forms of CDT1 and Geminin) is a particularly useful tool for cell cycle studies but has limitations when it comes to differentiating between S and G2 phases of the cell cycle. Geminin levels are already high from mid S phase and stay high until M phase, making these phases difficult to separate. Using the FUCCI system also means that two optical channels of the microscope cannot be used for imaging the POI.
Non-cancer cell lines could be synchronized into G0 by the removal of growth factors found in the serum (serum starvation) causing little or no DNA damage to the cells. However, most cancer cell lines will partially continue to progress through cell cycle even without adequate amounts of serum in their media. Additionally, cells partially begin to lose synchronization by late G1, early S phase. In addition to serum starvation, there are numerous chemical methods to achieve cell cycle synchronization. Hydroxyurea, aphidicolin, and thymidine blocks are methods of stopping DNA replication to synchronize cells into early S phase. While these methods are cheap and simple, they introduce replication stress which results in DNA damage. These DNA replication inhibitors have been shown to induce the phosphorylation of H2A.X, a well-known marker of DSBs2,29. The method of using tagged-PCNA as a marker for S-phase cells reduces potential for artefacts caused by chemical synchronization and can be applied to a wide range of cell lines compared to serum starvation.
Conclusion
DNA damage is a driving force for genetic diseases where mutagenic lesions can lead to the malignant transformation of cells. Targeting the DNA synthesis machinery is a fundamental therapeutic strategy in treatment of hyperproliferative diseases like cancer. In order to treat these diseases in a more targeted fashion, we need a better understanding of the proteins that repair DNA lesions. The protocol described here helps micro-irradiation based studies in S phase by minimizing the challenges presented by traditional synchronization methods to reduce possible artefacts and increase the reproducibility of the experiments.
Disclosures
The authors state that the publication of the presented work was sponsored by Nikon Corporation. The authors declare that no competing interests exist.
Acknowledgments
The authors thank M. Pagano for his continuous support as well as D. Simoneschi, A. Marzio and G. Tang for their critical review of the manuscript. B. Miwatani-Minter thanks R. Miwatani and B. Minter for their continued support. G. Rona thanks K. Ronane Jurasz and G. Rona for their continued support.
Materials
| Name | Company | Catalog Number | Comments |
| Ammonium chloride | Sigma-Aldrich | A9434-500G | For quenching formaldehyde |
| Anti-EXO1 Rabbit Polyclonal Antibody | Proteintech | 16253-1-AP | primary antibody |
| Anti-phospho-Histone H2A.X (Ser139) Antibody, clone JBW301 | Millipore | 05-636 | primary antibody |
| Bovine Serum Albumin | Sigma-Aldrich | 3117332001 | BSA for blocking |
| BrdU (5-Bromo-2'-deoxyuridine) | Merck | 19-160 | pre-sensitizing agent |
| Citifluor™ Mountant Solution AFR3 | Electron Microscopy Sciences | 17973-10 | antifade containing PBS solution for imaging |
| DAPI | Sigma-Aldrich | D9542-1MG | nucleic acid stain |
| DMEM Medium | Thermo Fisher Scientific | 10569010 | Cell culture medium for HEK293T cells |
| DMSO | Sigma-Aldrich | D2650-100ML | Vehichle control and dissolution solvent |
| EGFP-FBXL10 | Addgene | #126542 | viral expression vector for EGFP-FBXL10 |
| EXO1b-AcGFP (in pRetroQ) | custom cloning | na | EXO1b cDNA was cloned in the NheI, BamHI sites of pRetroQ-AcGFP1-N1 vector. |
| Fetal Bovine Serum | Gibco | 16140071 | Media supplement |
| FluoroBrite DMEM | Thermo Fisher Scientific | A1896701 | Phenol red free medium for microscopy |
| Goat anti-Mouse IgG (H+L) Highly Cross-Adsorbed Secondary Antibody, Alexa Fluor Plus 488 | Thermo Fisher Scientific | A32723 | secondary antibody |
| HEK293T cells | ATCC | ATCC CRL-3216 | Cell line for viral packaging |
| HEPES | Sigma-Aldrich | H0887-100ML | Buffering agent to supplement live cell imaging medium |
| Hoechst 33342 | Thermo Fisher Scientific | H3570 | pre-sensitizing agent |
| Lipofectamine 3000 | Thermo Fisher Scientific | L3000015 | Transfection reagent |
| McCoy’s 5A (Modified) Medium | Life Technologies | 16600-108 | Cell culture medium for U-2 OS cells |
| mCherry-PCNA | Addgene | #55117 | non-viral PCNA construct suitable for cell cycle marker |
| mPlum-PCNA | Addgene | #55994 | non-viral PCNA construct suitable for cell cycle marker |
| mPlum-PCNA (in pBABE) | custom cloning | na | mPlum-PCNA cDNA was cloned from Addgene #55994 in the BamHI, SalI sites of pBABE (puro) |
| Nikon A1R-HD25 Confocal Scanhead and Controller | Nikon | na | confocal imaging system |
| Nikon LUN4 laser unit | Nikon | na | excitation system |
| Nikon LUN-F 50 mW 405 nm FRAP laser unit | Nikon | na | FRAP laser unit |
| Nikon NIS Elements Confocal Controller Software | Nikon | na | Confocal controlling software |
| Nikon Ti2-E Inverted Microscope | Nikon | na | inverted epifluorescent microscope base |
| Nikon Ti2-LAPP Modular Illumination System | Nikon | na | illumination system |
| NTHL1-mCherry (in pRetroQ) | custom cloning | na | NTHL1 cDNA was cloned in the NheI, SalI sites of pRetroQ-mCherry-N1 vector. |
| Nunc Lab-Tek II Chambered Coverglass (4 well) | Thermo Fisher Scientific | 155382PK | Live cell microscopy cell culture chamber |
| Olaparib | Selleck Chemicals | S1060 | PARP inhibitor |
| Opti-MEM reduced serum media | Thermo Fisher Scientific | 31985062 | Dilution medium for transient transfection |
| Paraformaldehyde aqueous solution (32%) | Thermo Fisher Scientific | 50-980-494 | Fixative |
| pBABE (hygro) | Addgene | #1765 | retroviral expression vector (for low expression levels) |
| pBABE (neo) | Addgene | #1767 | retroviral expression vector (for low expression levels) |
| pBABE (puro) | Addgene | #1764 | retroviral expression vector (for low expression levels) |
| pBABE (zeo) | Addgene | #1766 | retroviral expression vector (for low expression levels) |
| PCNA Antibody (PC10) | Santa Cruz | sc-56 | primary antibody |
| Penicillin-Streptomycin-Glutamine (100x) | Gibco | 10378016 | Media supplement |
| polybrene | Sigma-Aldrich | TR-1003 | Increase viral infection efficiency |
| pRetroQ-AcGFP-C1 | Takara | 632506 | retroviral expression vector |
| pRetroQ-AcGFP-N1 | Takara | 632505 | retroviral expression vector |
| pRetroQ-mCherry-C1 | Takara | 632567 | retroviral expression vector |
| pRetroQ-mCherry-N1 | Takara | 632568 | retroviral expression vector |
| pUMVC | Addgene | #8449 | Viral packaging vector |
| Sodium-pyruvate | Thermo Fisher Scientific | 11360070 | Supplement for live cell imaging medium |
| Triton X-100 aqueous solution (10%) | Sigma-Aldrich | 11332481001 | Dilute in PBS for cell permeabilization buffer |
| Trypsin-EDTA Solution 10X | Sigma-Aldrich | 59418C-100ML | Dilute in PBS to split cells |
| U-2 OS Cells | ATCC | HTB-96 | Optimal cell line for microscopy experiments |
| Universal Mycoplasma Detection Kit | ATCC | 30-1012K | PCR based Mycoplasma detection kit |
| VSV-G | Addgene | #8454 | Viral protein envelope vector |
References
- Aleksandrov, R., et al.
- Darzynkiewicz, Z., Halicka, H. D., Zhao, H., Podhorecka, M. Cell synchronization by inhibitors of DNA replication induces replication stress and DNA damage response: Analysis by flow cytometry. Methods in Molecular Biology. 761, 85-96 (2011).
- Sakaue-Sawano, A., et al. Visualizing spatiotemporal dynamics of multicellular cell-cycle progression. Cell. 132 (3), 487-498 (2008).
- Herce, H. D., Rajan, M., Lattig-Tunnemann, G., Fillies, M., Cardoso, M. C. A novel cell permeable DNA replication and repair marker. Nucleus. 5 (6), 590-600 (2014).
- Keijzers, G., et al. Human exonuclease 1 (EXO1) regulatory functions in dna replication with putative roles in cancer. International Journal of Molecular Sciences. 20 (1), (2018).
- Cheruiyot, A., et al. Poly(ADP-ribose)-binding promotes Exo1 damage recruitment and suppresses its nuclease activities. DNA Repair (Amsterdam). 35, 106-115 (2015).
- Zhang, F., Shi, J., Chen, S. H., Bian, C., Yu, X. The PIN domain of EXO1 recognizes poly(ADP-ribose) in DNA damage response. Nucleic Acids Research. 43 (22), 10782-10794 (2015).
- Rona, G., et al. PARP1-dependent recruitment of the FBXL10-RNF68-RNF2 ubiquitin ligase to sites of DNA damage controls H2A.Z loading. elife. 7, (2018).
- Young, L. M., et al. TIMELESS forms a complex with PARP1 distinct from its complex with TIPIN and plays a role in the dna damage response. Cell Reports. 13 (3), 451-459 (2015).
- Kong, X., et al. Laser microirradiation to study in vivo cellular responses to simple and complex dna damage. Journal of Visualized Experiments. (131), e56213 (2018).
- Kong, X., et al. Condensin I recruitment to base damage-enriched DNA lesions is modulated by PARP1. PLoS One. 6 (8), 23548 (2011).
- Lan, L., et al. Novel method for site-specific induction of oxidative DNA damage reveals differences in recruitment of repair proteins to heterochromatin and euchromatin. Nucleic Acids Research. 42 (4), 2330-2345 (2014).
- Zerjatke, T., et al. Quantitative cell cycle analysis based on an endogenous all-in-one reporter for cell tracking and classification. Cell Reports. 19 (9), 1953-1966 (2017).
- Ji, Y., Karbaschi, M., Cooke, M. S. Mycoplasma infection of cultured cells induces oxidative stress and attenuates cellular base excision repair activity. Mutation Research. 845, 403054 (2019).
- Sun, G., et al. Mycoplasma pneumoniae infection induces reactive oxygen species and DNA damage in A549 human lung carcinoma cells. Infection and Immunity. 76 (10), 4405-4413 (2008).
- Gassman, N. R., Wilson, S. H. Micro-irradiation tools to visualize base excision repair and single-strand break repair. DNA Repair (Amsterdam). 31, 52-63 (2015).
- Muster, B., Rapp, A., Cardoso, M. C. Systematic analysis of DNA damage induction and DNA repair pathway activation by continuous wave visible light laser micro-irradiation. AIMS Genetics. 4 (1), 47-68 (2017).
- Ikeda, S., et al. Purification and characterization of human NTH1, a homolog of Escherichia coli endonuclease III. Direct identification of Lys-212 as the active nucleophilic residue. Journal of Biological Chemistry. 273 (34), 21585-21593 (1998).
- Rosenquist, T. A., Zharkov, D. O., Grollman, A. P. Cloning and characterization of a mammalian 8-oxoguanine DNA glycosylase. Proceedings of the National Academy of Science U. S. A. 94 (14), 7429-7434 (1997).
- Reid, D. A., et al. Organization and dynamics of the nonhomologous end-joining machinery during DNA double-strand break repair. Proceedings of the National Academy of Science U. S. A. 112 (20), 2575-2584 (2015).
- Taccioli, G. E., et al. Ku80: product of the XRCC5 gene and its role in DNA repair and V(D)J recombination. Science. 265 (5177), 1442-1445 (1994).
- Marsin, S., et al. Role of XRCC1 in the coordination and stimulation of oxidative DNA damage repair initiated by the DNA glycosylase hOGG1. Journal of Biological Chemistry. 278 (45), 44068-44074 (2003).
- Thompson, L. H., Brookman, K. W., Jones, N. J., Allen, S. A., Carrano, A. V. Molecular cloning of the human XRCC1 gene, which corrects defective DNA strand break repair and sister chromatid exchange. Molecular and Cell Biology. 10 (12), 6160-6171 (1990).
- Scharer, O. D.
- Oeck, S., et al. High-throughput evaluation of protein migration and localization after laser micro-irradiation. Science Reports. 9 (1), 3148 (2019).
- Mistrik, M., et al. Cells and stripes: A novel quantitative photo-manipulation technique. Science Reports. 6, 19567 (2016).
- Durand, R. E., Olive, P. L. Cytotoxicity, mutagenicity and dna damage by hoechst 33342. Journal of Histochemistry and Cytochemistry. 30 (2), 111-116 (1982).
- Tobey, R. A., Oishi, N., Crissman, H. A. Cell cycle synchronization: reversible induction of G2 synchrony in cultured rodent and human diploid fibroblasts. Proceedings of the National Academy of Science U. S. A. 87 (13), 5104-5108 (1990).
- Podhorecka, M., Skladanowski, A., Bozko, P. H2AX phosphorylation: Its role in DNA damage response and cancer therapy. Journal of Nucleic Acids. 2010, (2010).
