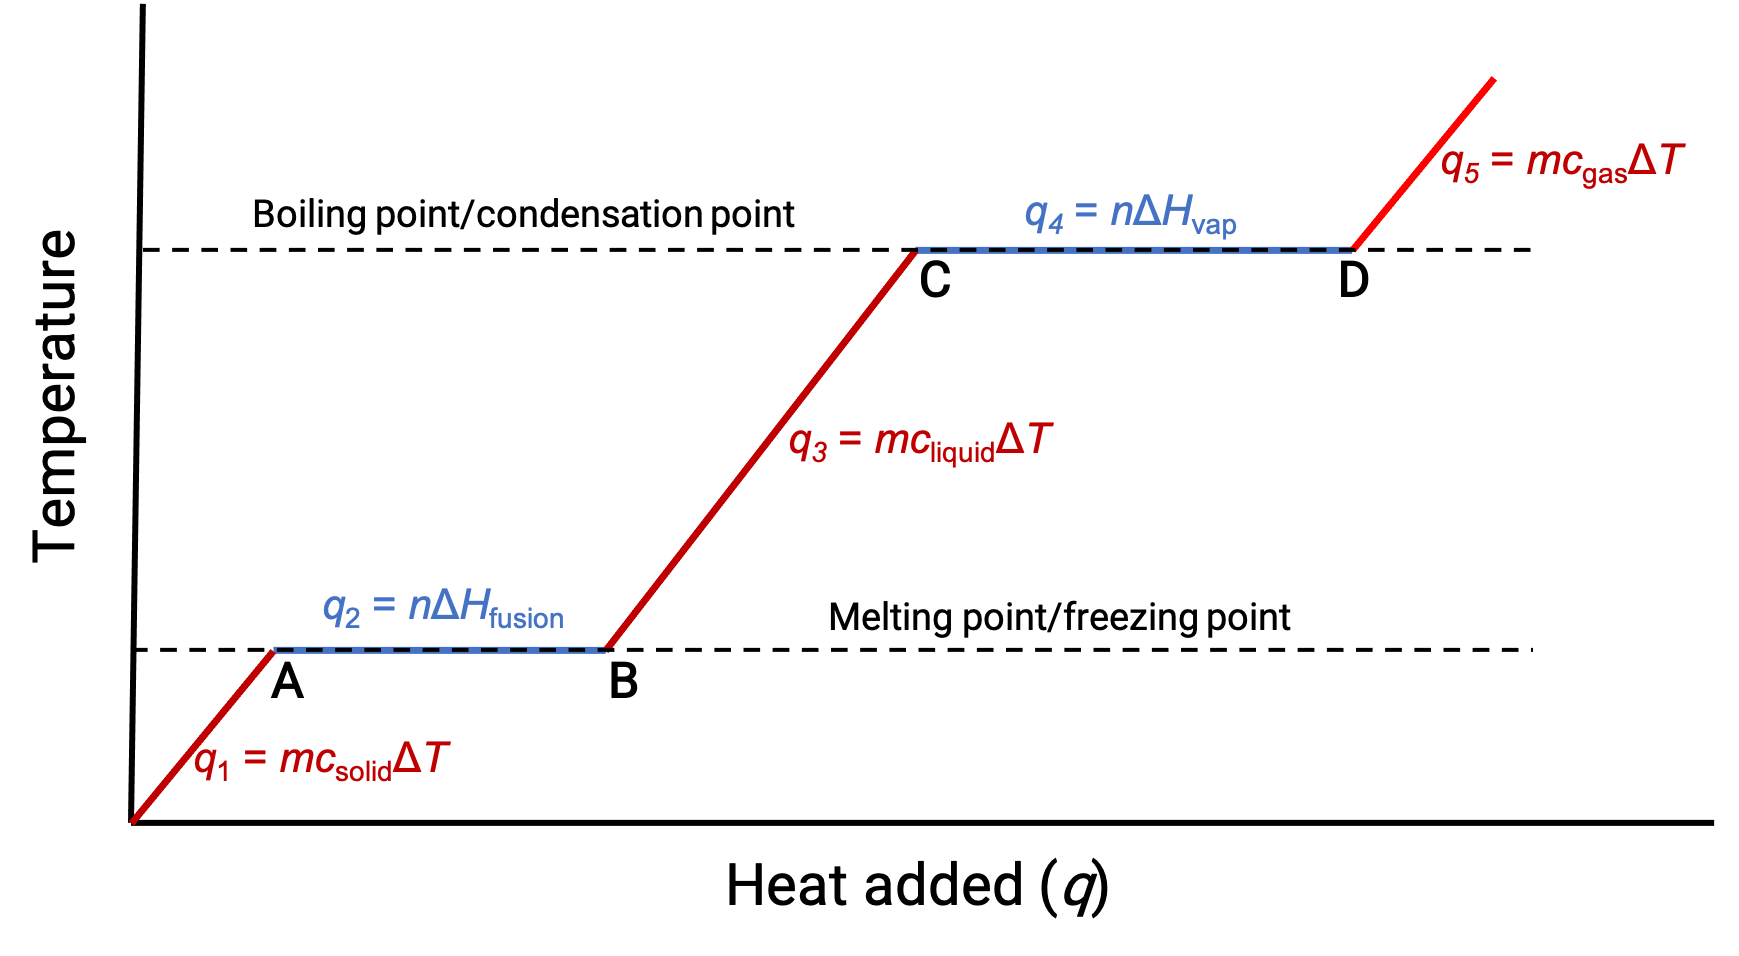
Heating or cooling a substance leads to temperature changes, followed by phase changes. Heating a substance increases its molecules' thermal energy, which is reflected as a rise in temperature until it reaches a transition point. When the substance has absorbed enough heat, the attractive forces between its molecules are overcome, leading to a phase transition at a constant temperature. Once the transition is complete, heating results in a rise in temperature again. When heat is removed from the substance, the decrease in its molecules’ thermal energy corresponds to a drop in temperature, until it reaches a transition point. Then, the temperature remains constant as stronger intermolecular forces are re-established during the phase change. The behavior of a substance in response to temperature changes can be modeled using heating curves or cooling curves, where the temperature change is plotted as a function of the heat added or heat removed. Consider a beaker filled with ice cubes, initially at −20 °C. As heat flows in, the temperature of the ice rises steadily. The amount of heat absorbed in warming the ice depends on the specific heat capacity of ice. Once the melting point of ice has been reached, the temperature stops rising despite the continually flowing heat. The effects of the absorbed heat weaken the intermolecular forces until the ice completely melts into liquid water. The plateau of solid–liquid equilibrium is characteristic of the phase transition at a constant temperature. The enthalpy change between the beginning and end of the plateau indicates the amount of heat needed for the melting process, or in other words, the enthalpy of fusion of water. After the melting process is complete, the absorbed heat results in a corresponding linear rise in temperature. The specific heat capacity of water dictates the amount of heat absorbed. At the boiling point, the temperature stops rising. The absorbed heat instead contributes to overcoming the attractive forces between water molecules until the water completely vaporizes. The plateau of liquid–gas equilibrium represents the phase transition at a constant temperature. The change in enthalpy between the beginning and end of the plateau is the enthalpy of vaporization of water. After all the liquid has transformed into vapor, additional heat leads to the temperature rising again.