A technique called Comprehensive Microarray Polymer Profiling (CoMPP) for the characterisation of plant cell wall glycans is described. This method combines the specificity of monoclonal antibodies directed to defined glycan-epitopes with a miniature microarray analytical platform allowing screening of glycan occurrence in a broad range of biological contexts.
Method Article
Glycan Profiling of Plant Cell Wall Polymers using Microarrays
In This Article
Summary
Abstract
Plant cell walls are complex matrixes of heterogeneous glycans which play an important role in the physiology and development of plants and provide the raw materials for human societies (e.g. wood, paper, textile and biofuel industries)1,2. However, understanding the biosynthesis and function of these components remains challenging.
Cell wall glycans are chemically and conformationally diverse due to the complexity of their building blocks, the glycosyl residues. These form linkages at multiple positions and differ in ring structure, isomeric or anomeric configuration, and in addition, are substituted with an array of non-sugar residues. Glycan composition varies in different cell and/or tissue types or even sub-domains of a single cell wall3. Furthermore, their composition is also modified during development1, or in response to environmental cues4.
In excess of 2,000 genes have Plant cell walls are complex matrixes of heterogeneous glycans been predicted to be involved in cell wall glycan biosynthesis and modification in Arabidopsis5. However, relatively few of the biosynthetic genes have been functionally characterized 4,5. Reverse genetics approaches are difficult because the genes are often differentially expressed, often at low levels, between cell types6. Also, mutant studies are often hindered by gene redundancy or compensatory mechanisms to ensure appropriate cell wall function is maintained7. Thus novel approaches are needed to rapidly characterise the diverse range of glycan structures and to facilitate functional genomics approaches to understanding cell wall biosynthesis and modification.
Monoclonal antibodies (mAbs)8,9 have emerged as an important tool for determining glycan structure and distribution in plants. These recognise distinct epitopes present within major classes of plant cell wall glycans, including pectins, xyloglucans, xylans, mannans, glucans and arabinogalactans. Recently their use has been extended to large-scale screening experiments to determine the relative abundance of glycans in a broad range of plant and tissue types simultaneously9,10,11.
Here we present a microarray-based glycan screening method called Comprehensive Microarray Polymer Profiling (CoMPP) (Figures 1 & 2)10,11 that enables multiple samples (100 sec) to be screened using a miniaturised microarray platform with reduced reagent and sample volumes. The spot signals on the microarray can be formally quantified to give semi-quantitative data about glycan epitope occurrence. This approach is well suited to tracking glycan changes in complex biological systems12 and providing a global overview of cell wall composition particularly when prior knowledge of this is unavailable.
Protocol
1. Tissue Collection & Preparation
- Collect 100 mg fresh weight of plant tissues (a minimum of 10 mg dry weight) in at least triplicate for each tissue of interest. The following steps describe the preparation of cell wall material from vegetative tissues. In the case of storage tissues, un-wanted starch is enzymatically removed before proceeding with the extraction of cell wall polymers as previously described13.
- Homogenize the samples to a fine powder with liquid nitrogen using a Qiagen TissueLyser II, with 24 tube adapter sets and 3 mm tungsten carbide beads (30 Hz, 2 x 30 sec). Alternatively if only a few samples are being processed, a mortar and pestle is used.
- Transfer the homogenates into 10 ml plastic conical tubes.
- Prepare cell wall material by washing the homogenates in 10 ml 80% v/v ethanol at RT and vortexing vigorously for 2 min.
- Centrifuge samples at 3,500 x g and discard supernatant. Repeat the 70% ethanol washes at least three times or until the supernatant is clear, particularly for tissues containing chlorophyll.
- Perform a final wash with 100% acetone and leave the pellets containing Alcohol Insoluble Residues (AIR) to air-dry overnight.
- Sieve the AIR samples with a 0.4 mm2 mesh to achieve a fine, homogenous powder and to remove larger, poorly ground particles which sometime remain in the homogenate.
- Weigh 10 mg AIR sample into microtubes, each containing a 3 mm glass bead to aid the mixing of samples.
2. Extraction of Cell Wall Glycans
- Pectins, and polymers associated with pectins are extracted from the samples by adding 500 μl of 50 μM CDTA (pH 7.5) to each sample.
- Briefly vortex the tubes to ensure the solvent is in contact with the sample material and then mix using the TissueLyser for 3 hr at 8 Hz.
- Centrifuge samples at 12,000 x g, carefully remove the supernatants and store at 4 °C.
- Wash pellets in 1 ml of de-ionized water to dilute and remove any remaining solvent, vortex and centrifuge at 13,000 x g. Repeat this step without disturbing the pellet and remove all liquid from the tubes before proceeding to the next step.
- Cross-linking glycans are sequentially extracted from the remaining cell wall pellet with 500 μl of 4M NaOH with 0.1% w/v NaBH4, using the same procedure described in steps 2.1 - 2.4 for the CDTA extraction. NaBH4 is added to reduce the aldehyde (or keto) group at the reducing end of the polysaccharides to an alcohol thereby preventing base peeling of polysaccharides.
- After centrifugation, supernatants are again removed, stored at 4 °C, and the pellets washed twice in de-ionized water before proceeding to the next extraction.
- As an optional step, residual polymers, such as cellulose are extracted with 500 μl cadoxen (31% v/v 1,2-diaminoethane with 0.78 M CdO) using the same procedure as described in steps 2.1 - 2.4. Alternatively, absolute cellulosic content in remaining pellets can be determined using Acetic/Nitric assays (See Discussion).
3. Printing Microarrays
- Centrifuge supernatants containing extracted cell wall polymers at 13,000 x g to remove any particulate matter.
- Load 50 μl of each sample into a polypropylene 384 well microtiter plate using a pre-designed custom layout where samples are arranged according to tissue type and extraction type.
- Dilute the cell wall polymer sample in a 0, 5 and 25× serial dilution series with deionized water.
- Parameters such as pin height, collection and dwell time, and washing steps are set on the software controlling the microarrayer.
- The humidity of the printing chamber is controlled at 60% to prevent sample evaporation.
- The printing job is started using LabNEXT software and a program which corresponds to the microarray layout.
- The robot uses capillary channel pins to print solutions from the sample plate onto 20 x 20 cm nitrocellulose membrane which is attached to a flat plate in the machine. Each spot on the array contains 15 nl of solution and is printed in triplicate.
- Identical microarrays are printed next to each other on the membrane and cut into individual arrays after the print job is complete.
- In each experiment the arrays can be modified in order to accommodate more or less samples, dilutions or replicates.
4. Probing of Glycan Microarrays
- After printing, block the individual microarrays in 5% w/v skimmed milk powder dissolved in phosphate buffered saline (MPBS) at room temperature for 2 hr to reduce non-specific binding.
- Probe microarrays with monoclonal antibodies specific for cell-wall glycan epitopes for 2 hr in MPBS. The majority of monoclonal antibodies against cell wall glycans are commercially available from three companies; Biosupplies (www.biosupplies.com.au), Carbosource Services (www.carbosource.net) and PlantProbes (www.plantprobes.net).
- Include a negative control, a microarray incubated with only MPBS and no primary antibody.
- Wash the microarrays 3 times in phosphate buffered saline (PBS) for 5 min to remove non-specific binding.
- Probe the microarrays with secondary antibody conjugated to horseradish peroxidase (HRP) in MPBS for 2 hr. Most monoclonal antibodies against cell wall glycans require anti-mouse or anti-rat secondary antibodies.
- Repeat the washing steps 3 times with PBS buffer for 5 min to remove non-specific binding.
- Develop the microarrays using chromogenic (3,3-Diaminobenzidine) or chemiluminecent (luminol) substrates.
5. Quantification
- After development, scan the individual microarrays using a high-resolution (1,200 dpi) desktop scanner and save the images as negative, 16-bit TIFF files (Figure 3).
- Calculate the integral intensity of each spot using Xplore Image Processing Software (LabNEXT) fitted with an automated grid tool. The integral spot intensity is derived from the sum of pixels in the grid area surrounding each spot.
- The grid data for each microarray is exported as a txt file and can be manually imported into an Excel spreadsheet for analysis. An online tool (http://microarray.plantcell.unimelb.edu.au/ ) has been developed to automatically translate and process data from individual txt files.
- The integral spot intensity is averaged across printing replicates and dilutions to obtain a 'mean spot intensity' value for each sample (Figure 2). Alternatively, spot signals corresponding to just one dilution value on the array are used to quantify the relative glycan epitope abundance for each sample.
- The relative mean spot intensities between different samples are presented as a heatmap (Figure 4) using conditional formatting in excel or online heatmapper tools (http://bar.utoronto.ca/welcome.htm). The data for each antibody type is corrected to 100 and a 5% cutoff value is imposed to remove background signal and false positives.
Results
The relative abundance of glycans in six tissue types (anther filaments, pollen, ovaries, petals, sepals and stigma) from Nicotiana alata flowers was determined using CoMPP. Figure 3A shows a representative microarray that has been probed with mAb JIM5 specific for partially (low) methylesterified homogalacturonan (HG), an epitope which occurs on pectic polysaccharides14. The JIM5 epitope is detected in CDTA extracts of all flower tissues however is highest in pollen and lowest in stigmatic tissue (Figure 3A and 4A). Interestingly, the JIM5 epitope is also detected in the NaOH extracts in pollen but not in other tissues (Figure 3A).
Quantitative information about the occurrence of a glycan of interest is obtained by including a series of purified polysaccharides as internal standards on the microarray (Figure 3B). Integral spot intensity of extracts of different tissues probed with mAb JIM5 is matched to the spot signals derived from a serial dilution of homogalacturonan (25% degree of methyl esterification, DE). In ovary tissue, approximately 157 μg of homogalacturonan containing the JIM5 epitope was present in each sample, accounting for approximately 1.5% (by weight) of total cell wall residues (Figure 3C). Whereas 625 μg homogalacturonan containing the JIM5 epitope was present in pollen tissue, accounting for approximately 6.25% (by weight) of total cell wall residue.
The relative abundance of 15 glycan epitopes are summarised as a heatmap in Figure 4 where the intensity of color bars is proportional to the adjusted mean spot intensity for each sample. A pictorial representation of this data is also illustrated in Figure 5 and allows us to rapidly interpret differences in glycan epitope occurrence between the different flower tissues.
Our results indicate that individual glycan epitopes are uniquely distributed amongst N. alata flower tissues. For example, the LM13 epitope (linearised (1-5)-α-L-arabinan15 ) is most abundant in anther filaments and sepal tissues compared to other tissues (Figure 5D). This pattern is in striking contrast to that of shorter chain (1-5)-α-L-arabinan epitopes preferentially detected by mAb LM6 (Figure 5E)15. Cross-linking glycans also have distinct patterns of occurrence in N. alata flowers. The LM10 epitope (low-substituted (1-4)-β-D-xylan) is abundant in stigma tissue compared to other tissues, but is absent from ovary tissue (Figure 5G). LM15 xyloglycan epitopes are highest in petal and anther filament compared to other tissues (Figure 5H), whereas heteromannans are highest in anther filaments (Figure 5J).

Figure 1. A simplified flow diagram representing the five key steps of Comprehensive Microarray Polymer Profiling (CoMPP).

Figure 2. An illustration of the key steps of Comprehensive Microarray Polymer Profiling (CoMPP). (A) Plant tissues are collected as three replicates, homogenized and washed in 70% EtOH and acetone to make alcohol insoluble residues (AIR). (B) Cell wall glycans are sequentially extracted from AIR samples with 50 mM CDTA and 4 M NaOH. (C) Extracted cell wall glycans are printed on nitrocellulose using a microarray robot. Each sample is represented in three concentrations and as a series of four printing replicates. (D) The printed arrays are probed individually with mAbs directed to cell wall glycans epitopes. (E) The spot signals are quantified using microarray imaging software, exported as txt files and relative mean spot intensity values are automatically calculated using an online data processing tool.

Figure 3. Glycan profiling of Nicotiana alata flower tissues. (A) A representative microarray probed with monoclonal antibody (mAb) JIM5 specific for homogalacturonan (partially, low methylesterification) is indicated as a negative, 16-bit TIFF file. (B) The amount of polysaccharide containing a glycan epitope of interest can be quantified by printing a series of polysaccharide standards. (C) Integral spot intensity of sample of interest probed by mAb JIM5 is calculated and matched to a standard curve to estimate the quantity (μg) of polysaccharide containing this epitope in the sample.

Figure 4. Glycan profiling of Nicotiana alata flower tissues represented as a heatmap. The color intensity is proportional to the relative mean spot identity value (scale bar). Relative abundance of 15 glycan epitopes detected by monoclonal antibodies (listed at the top) was analyzed for six tissue types extracted with CDTA and NaOH (left hand side). The glycan epitopes fall into three broad classes of polysaccharides; pectins, cross-linking glycans and arabinogalactan proteins (AGPs). me, methyl-esterification; DP, Degree of polymerization; mAb, monoclonal antibodies; AGP, arabinogalactan-protein.
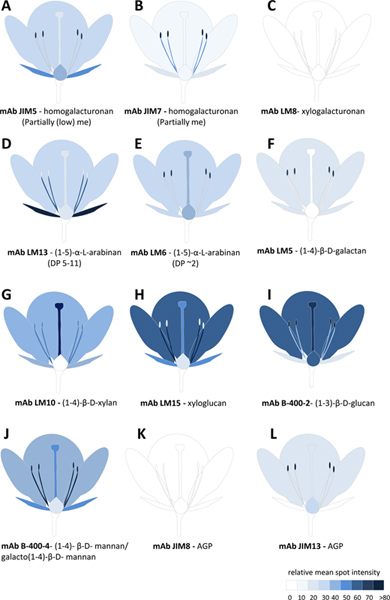
Figure 5. Glycan profiling of Nicotiana alata flower tissues represented pictorially. A-L represents the relative abundance of 12 glycan epitopes detected by mAbs in different flower tissues. The scale bar color intensity is proportional to the relative mean spot identity value derived from either CDTA or NaOH extracts or a sum of both. me, methyl-esterification; DP, Degree of polymerization; mAb, monoclonal antibodies; AGP, arabinogalactan-protein. Click here to view larger figure.
Discussion
CoMPP is a fast and sensitive method for profiling the glycan composition of hundreds plant-derived samples in a matter of days. This method complements the already available bacterial or mammalian glycan array platforms for high-throughput screening of carbohydrate interactions with glycan-binding proteins such as lectins, receptors, and antibodies16. With a large diversity of probes available for detecting cell wall glycans, it is possible to gain detailed information about glycan epitopes belonging to all major classes of polysaccharides in the plant cell wall8,9. However these encompass only a small proportion of the glycan structures that have been identified8,9, and in some circumstances limit the comprehensibility of CoMPP. Nevertheless, this capability has recently been extended by the use of carbohydrate binding modules (CBMs) against plant glycans17, and also against epitopes characterized by non-glycosyl residues such as phenolics18 and acetyl residues19 which modify glycosyl residues and play an important role in glycan function.
Although CoMPP determines the relative levels of glycans across a set of samples, it is possible to quantify the epitope levels in sequential extracts by comparing the binding signal in specific samples to that of known standards (Figure 3B and C). Despite the advantages of reduced sample volumes in a microarray-based platform, the ability to accurately quantify glycan occurrence can be hindered by differences in spot morphology or saturation of spot signal. These problems (as well as false positives) are avoided by optimising the amount of cell wall material verses extractant volume, prior to analysis, and including a series of replicates and dilutions as outlined here and in mammalian glycan array methods16. Furthermore, differences in spot morphology (caused by diffusion of samples at different rates from the point of contact) can be overcome by using non-contact ink-jet microarray technology16.
CoMPP is used in combination with established procedures for the isolation and preparation of cell walls20. It can also be used in parallel with existing biochemical, enzymatic and physical methods to gain further information about glycan content in samples of interest. For instance instead of extracting cellulosic polymers, Acetic/Nitric acid assays20 can be used to quantify cellulose content (mg) remaining after sequential extraction of pectin and cross-linking glycans with CDTA and NaOH. Enzyme treatment of glycan microarrays21 can also reveal further differences in glycan epitope distribution amongst samples, or confirm the specificity of epitopes structures detected on the microarray. The determination of glycan composition by independent analytical techniques, such as those recently described13, is also particularly important for the validation of CoMPP data.
We demonstrate that glycans are distributed in an organ or tissue specific manner in N. alata flowers. This information can give insight into the biological function of glycan epitopes or glycan synthesizing or modifying enzymes present in these different cell types. CoMPP has previously provided insight into cell wall alterations that occur in relation to plant type22 during development23,24 or in response to mutation10,25. In summary, CoMPP is a valuable tool for the studying the diverse role of glycans and glycan synthesizing and modifying genes in the plant cell wall.
Disclosures
No conflicts of interest declared.
Acknowledgements
IEM would like to acknowledge the Danish Research Council (FTP and FNU) for funding. ERL acknowledges the support of an ARC DP grant. AB acknowledges the support of the ARC Centre of Excellence in Plant Cell Walls grant.
Materials
| Name | Company | Catalog Number | Comments |
|---|---|---|---|
| 3 mm Tungsten Carbide beads | Qiagen | 69997 | |
| Collection microtubes (1.2 mm) | Qiagen | 19560 | 1.5 ml microfuge tubes can also be used |
| Qiagen TissueLyser II | Qiagen | 85300 | |
| 3 mm glass beads | Sigma Aldrich | Z143928 | |
| CDTA | Sigma Aldrich | 34588 | |
| Cadmium oxide | Sigma Aldrich | 202894 | |
| 1,2-diamin–thane | Sigma Aldrich | 03550 | |
| Nitrocellulose membrane (0.22 μm pore size) | GE-water process technologies | EP2HY00010 | different pore sized membranes are suitable for different pin types |
| Xact II microarrayer robot | Labnext | 001A | the Xact II robot was fitted with a custom 20 x 20 cm ceramic plate to which the nitrocellulose membrane is attached |
| Xtend RM microarray pins | Labnext | 0037-350 | pins must be suitable for spotting on membranes |
| 384 well microtiter plates (polypropylene) | Greiner | 781207 | |
| Anti-glycan monoclonal antibodies | Plant Probes/ CarboSource/Biosupplies | Websites; PlantProbes (www.plantprobes.net), Carbosource (www.carbosource.net) and Biosupplies (www.biosupplies.com.au). | |
| Anti-Rat IgG (whole molecule) - Peroxidase antibody produced in goat. | Sigma | A9037 | the type of secondary antibodies depends on the primary antibody used (e.g. raised in rat, mouse, goat etc). |
| SIGMAFAST 3,3'-Diaminobenzidine tablets | Sigma | D4293 | the type of developing reagent depends on the secondary antibodies used and the detection method (colourmetric, or chemiluminecent). |
| SuperSignal West Pico Chemiluminescent Substrate | Thermoscientific | 34080 | see above |
| Xplore Image Processing Software | LabNext | 008 | many software types with automatic gridding tools are available to measure pixel value of microarray spots. |
| Plant polysaccharides | Sigma/Megazyme |
References
- Carpita, N. C., Gibeaut, D. M. Structural models of primary cell walls in flowering plants: consistency of molecular structure with the physical properties of the walls during growth. Plant J. 3, 1-30 (1993).
- Somerville, C. Biofuels. Curr. Biol. 17, 115-119 (2007).
- Willats, W. G., Orfila, C., Limberg, G., et al. Modulation of the degree and pattern of methyl-esterification of pectic homogalacturonan in plant cell walls. implications for pectin methyl esterase action, matrix properties, and cell adhesion. J. Biol. Chem. 276, 19404-19413 (2001).
- Doblin, M. S., Pettolino, F., Bacic, A. Plant cell walls: the skeleton of the plant world. Functional Plant Biology. 37, 357-381 (2010).
- Carpita, N., Tierney, M., Campbell, M. Molecular biology of the plant cell wall: searching for the genes that define structure, architecture and dynamics. Plant Molecular Biology. 47, 1-5 (2001).
- Sarria, R., Wagner, T. A., O'Neill, M. A., Faik, A., et al. Characterization of a family of Arabidopsis genes related to xyloglucan fucosyltransferase1. Plant Physiol. 127, 1595-1606 (2001).
- Somerville, C., Bauer, S., Brininstool, G. Toward a systems approach to understanding plant cell walls. Science. 306, 2206-2211 (2004).
- Willats, W. G. T., Knox, J. P. Molecules in context: probes for cell wall analysis. The Plant Cell Wall. Rose, J. K. C. , Blackwell. 92-110 (2003).
- Pattathil, S., Avci, U., Baldwin, D., et al. A Comprehensive Toolkit of Plant Cell Wall Glycan-Directed Monoclonal Antibodies. Plant Physiology. 153, 514-525 (2010).
- Moller, I. E., Sørensen, I., Bernal, A. J., et al. High-throughput mapping of cell-wall polymers within and between plants using novel microarrays. The Plant J. 50, 1118-1128 (2007).
- Sørensen, I., Willats, W. G. T. Screening and characterization of plant cell walls using carbohydrate microarrays. Methods Mol. Biol. 715, 115-121 (2011).
- Moller, I. E., Licht, D. eF. ine, Harholt, H. H., J,, et al. The dynamics of plant cell-wall polysaccharide decomposition in leaf-cutting ant fungus gardens. PLoS One. 6 (3), e17506(2011).
- Pettolino, F. A., Walsh, C., Fincher, G. B. Chemical procedures for the determination of polysaccharide composition of plant cell walls. Nature Protocols. , In Press (2012).
- Clausen, M. H., Willats, W. G. T., Knox, J. P. Synthetic methyl hexagalacturonate hapten inhibitors of anti-homogalacturonan monoclonal antibodies LM7, JIM5 and JIM7. Carbohydrate Res. 338, 1797-1800 (2003).
- Verhertbruggen, Y., Marcus, S. E., Haeger, A., et al. Developmental complexity of arabinan polysaccharides and their processing in plant cell walls. Plant J. 59, 413-425 (2009).
- Heimburg-Molinaro, J., Song, X., Smith, D. F. UNIT 12.10 Preparation and Analysis of Glycan Microarray. Current Protocols in Protein Science. , (2011).
- McCartney, L., Blake, A., Flint, J., et al. Differential recognition of plant cell walls by microbial xylan-specific carbohydrate-binding modules. PNAS. 103, 4765-4770 (2006).
- Caño-Delgado, A. I., Metzlaff, K., Bevan, M. W. The eli1 mutation reveals a link between cell expansion and secondary cell wall formation in Arabidopsis thaliana. Development. 127, 3395-3405 (2000).
- Manabe, Y., Nafisi, M., Verhertbruggen, Y., et al. Loss-of-Function Mutation of REDUCED WALL ACETYLATION2 in Arabidopsis Leads to Reduced Cell Wall Acetylation and Increased Resistance to Botrytis cinerea. Plant Physiology. 155, 1068-1078 (2011).
- Updegraff, D. Semimicro determination of cellulose in biological materials. Anal. Biochem. 32, 420-424 (1969).
- 21Moller, I., Marcus, S. E., Haeger, A., et al. High-throughput screening of monoclonal antibodies against plant cell wall glycans by hierarchial clustering of their carbohydrate microarray binding profiles. Glycoconjugate Journal. 25, 37-48 (2007).
- Sørensen, I., Pettolino, F. A., Wilson, S. M., et al. Mixed linkage (1→3),(1→4)-β-D-glucan is not unique to the Poales and is an abundant component of Equisetum arvense cell walls. Plant J. 54 (13), 510-521 (2008).
- Domozych, D. S., Sørensen, I., Willats, W. G. T. The distribution of cell wall polymers during antheridium development and spermatogenesis in the Charophycean green alga, Chara. 2104, 1045-1056 (2009).
- Singh, B., Avci, U., Eichler Inwood, S. E. A specialized outer layer of the primary cell wall joins elongating cotton fibers into tissue-like bundles. Plant Physiol. 150, 684-699 (2009).
- Øbro, J., Sørensen, I., Derkx, P., et al. High-throughput screening of Erwinia chrysanthemi pectin methylesterase variants using carbohydrate microarrays. Proteomics. 9, 1861-1868 (2009).
Reprints and Permissions
