

Summary
Reading in color is a new method for training letter-color associations that are typically found only in grapheme-color synesthetes. It involves an implicit form of training that has potential for long-term associative training methods because the training is a byproduct of reading and any text can be colored.
Abstract
Synesthesia is a rare condition in which a stimulus from one modality automatically and consistently triggers unusual sensations in the same and/or other modalities. A relatively common and well-studied type is grapheme-color synesthesia, defined as the consistent experience of color when viewing, hearing and thinking about letters, words and numbers. We describe our method for investigating to what extent synesthetic associations between letters and colors can be learned by reading in color in nonsynesthetes. Reading in color is a special method for training associations in the sense that the associations are learned implicitly while the reader reads text as he or she normally would and it does not require explicit computer-directed training methods. In this protocol, participants are given specially prepared books to read in which four high-frequency letters are paired with four high-frequency colors. Participants receive unique sets of letter-color pairs based on their pre-existing preferences for colored letters. A modified Stroop task is administered before and after reading in order to test for learned letter-color associations and changes in brain activation. In addition to objective testing, a reading experience questionnaire is administered that is designed to probe for differences in subjective experience. A subset of questions may predict how well an individual learned the associations from reading in color. Importantly, we are not claiming that this method will cause each individual to develop grapheme-color synesthesia, only that it is possible for certain individuals to form letter-color associations by reading in color and these associations are similar in some aspects to those seen in developmental grapheme-color synesthetes. The method is quite flexible and can be used to investigate different aspects and outcomes of training synesthetic associations, including learning-induced changes in brain function and structure.
Introduction
Synesthesia is a rare condition typically described as a 'crossing of the senses.' There are many forms of synesthesia. One of the most common types is grapheme-color synesthesia, the consistent and automatic experience of color upon seeing, hearing, or thinking about letters, words or numbers. The prevalence of grapheme-color synesthesia is about 1% of the population1. Research has shown that synesthetic experiences are genuine, not imagined, and are not related to neurological or psychiatric illness2-11. Recent neuroimaging research has shown that the function and structure of the brains of synesthetes differ from matched nonsynesthetic controls12. There is a genetic component to synesthesia13,14, however, the majority of synesthetic inducers are culturally determined, for example by language15,16. This interaction between genes and environment begs the question of why some people develop synesthesia and others do not. Is this difference entirely determined by genetics, or is it possible to train synesthesia in individuals who may not possess 'synesthetic' genes? A first step to answering this question requires a long-term training method that has potential for developing associations of the type found in synesthesia. Here we describe a method for training letter-color associations by reading text with colored letters (Figure 1). We will also discuss a method that may be used to predict individual differences in the learning effect.
Previous synesthetic training methods have focused on directed training using a computer17-21. Computer training in the lab requires the participants to come into the lab over the course of several days, although computer training at home is also now feasible. Training associations by reading in color can be done at home and at the participants' convenience. Perhaps the biggest advantages of reading in color are that participants are able to choose what they would like to read and that any text can be colored. Importantly, the learned associations between letters and colors are a 'byproduct' of normal reading, since the participants are not instructed to nor are they trying to remember which letter is paired with which color (although of course they are aware of these colored letters). We have previously shown that it is possible to develop letter-color associations by reading in color, and these are similar in their automatic nature to those seen in developmental grapheme-color synesthesia, although we are not claiming that the trainees should be considered synesthetes22.
The most common behavioral task used to objectively measure the presence or strength of a synesthetic association is a modified version of the classic Stroop paradigm23. However, this type of task cannot be used as a diagnostic marker of synesthesia since it is possible to train a Stroop effect in nonsynesthetes24. (A test of consistency or test of genuineness is better suited for diagnosis of synesthesia2,25). In the classic Stroop task, a color word (e.g. 'RED') is shown in color to a participant and he or she must say what color the word is printed in as fast as possible. When the word is presented in the same color as the color word itself (e.g. 'RED' printed in red ink), it is considered to be congruent, and when the word is presented in different color as the color word (e.g. 'RED' printed in green ink), it is considered to be incongruent (Figure 2). People react slower and are less accurate on incongruent trials compared to congruent trials, and this difference is called 'the Stroop effect.' The cause of the Stroop effect is that reading the word itself is an automatic process that cannot be completely inhibited or ignored and therefore interferes with the task at hand. The 'synesthetic' version of this task uses letters instead of words, and the instructions are the same: indicate as fast as possible the color that the letter is presented in26. A difference between incongruent and congruent conditions is found in individuals who have an existing association between letters (or numbers) and colors, most of all synesthetes (Figure 2), but also trainees18,20-22,27. Genuine synesthesia involves more than just the presence of a Stroop effect, the most important characteristics being the experience of percepts (e.g. color) in a modality that is not being stimulated (e.g. black text) that are highly specific and consistent across time2,25. The presence of a 'synesthetic' Stroop effect shows that the associations between letters and colors are automatic to the point that they interfere with task demands, but it cannot prove that a letter-color association is perceptual in nature or whether an individual is a synesthete18.
Individuals are all different, and some trainees may develop large Stroop effects after reading in color, while others may not. We have developed a set of questions about subjective color experience that may predict how strong these learned associations become at the individual level. Additionally, learning letter-color associations may interact with pre-existing preferences for the letter-color pairs in nonsynesthetes. These results point towards underlying factors that may determine how sensitive an individual is to developing letter-color associations. For example, sensitivity may be determined by vividness of visual mental imagery28 or memory ability29-31, both of which have been found to be related to grapheme-color synesthesia. The reading in color method may help researchers to further explore these hypotheses by providing a feasible long-term training program for nonsynesthetes. It remains to be seen if reading consistently colored letters over long periods of time may lead some nonsynesthetic individuals to experience real color percepts in response to black letters that remain automatic and also consistent over years or a lifetime.
The overall procedure involves recruiting motivated participants to read colored books. The participants must be motivated to read because they will not be observed outside of the lab. Furthermore, they are trusted to accurately report how much they read. Participants must be tested both before and after reading for the presence of learned letter-color associations. Each participant should be assigned a unique set of letter-color pairs based on their individual preferences. Four high-frequency letters (e.g. a, e, n, and r) are paired with four-high frequency colors (e.g. red, orange, green, and blue). Learned associations are tested with a synesthetic version of the classic Stroop task, comparing congruent and incongruent conditions of letter-color pairs. Magnetic resonance images (MRI) are acquired before and after reading in order to test for learning-induced changes in brain function and structure32,33. In addition, it is important to evaluate the experience of the participants using questionnaires because the subjective experiences of the participants are of interest, such as possible color experiences in the presence of black text. The number of words read will vary between participants because they may choose their own reading materials. Post-session testing should always be conducted as soon as possible after the participant is finished reading (to date there is no data suggesting how long learning effects may endure as measured with the Stroop task). This protocol can be adjusted in many ways, but we consider it to be the basis for a synesthetic training method using reading in color.
Protocol
Ethics statement: The following protocol meets the requirements of the Ethical Committee of the Department of Psychology at the University of Amsterdam for testing human participants.
1. Screening
- The characteristics of the sample have an influence on the results. Screen subjects for possible covariate traits, such as color blindness, literacy, synesthesia, dyslexia, attention deficit disorder (ADD), neurological and psychological trauma. Age and gender have an influence on learning and memory, as well as the neurobiology of the brain34,35. These factors matter when choosing experimental groups, although these factors have not yet been systematically tested in terms of specific effects on learning letter-color associations.
- Question participants about how motivated they are to participate in the study. The motivation of the participants is essential for the quality of the results because participants must be willing to read outside of the lab. The great thing about this method is that they are able to read what they choose.
- To test for the presence of synesthesia, use a consistency test, either a questionnaire or computer based test-retest paradigm2,25,36 or an existing verified online testing service37. Dutch participants may use our testing website: www.synesthesie.net.
- If the experimental protocol includes MRI measurements, make sure to additionally screen for health risks associated with MRI scanning.
2. Stimuli
- Reading material - It is important that participants are motivated to read, therefore provide interesting reading material. Importantly, do not violate copyright laws. It is unlawful to copy and reprint copyright-protected books without explicit permission from the copyright holder. There are sources of copyright-free books, e.g. Project Gutenberg (www.gutenberg.org) or ask a publisher permission to use their copyrighted material. Ensure that the books are relatively long (we recommend a minimum of 40,000 words).
- Ask each participant which books he or she would like to read based on the reading material offered. Ideally, participants should continue reading for an extended period of time and read each day, which may eventually lead to reading several books. Tell the participants that reading more books is encouraged. This is a good procedure to follow because it helps to ensure that participants are trained over longer periods of time.
- Letters and colors - Choose four relatively frequent letters (we will use: a, e, n, and r) and four frequent colors (e.g. red, orange, green, and blue). It is important to know the relative letter frequencies of the letters chosen because letter frequency determines how often the participants see a particular letter in color. In addition, letter frequency may interact with letter-color preference. Although it is not necessary to use relative letter frequency as an independent variable in the analysis, it is important to estimate how often a participant will view a letter in a specific color. Choosing low-frequency letters will result in very infrequent letter-color presentations and may decrease the possibilities of acquiring learned letter-color associations. Estimated relative frequencies of the above four letters in the Dutch language are: e = 19%, n = 10%, a = 7.5%, and r = 6%.
- Match the colors in the book to the colors on the computer screen (that will be used for the testing sessions). Adjust the RGB values in the stimulus computer to match the colored ink on the paper. We recommend asking several people to verify that the colors on screen match the colors in the book. Ask if the colors of the letters match the colors in the book for all letters in all colors (to cover all possible congruent and incongruent combinations). Furthermore, use a testing room where the lighting conditions can be controlled in order to prevent changes in lighting during different testing sessions (e.g. use a room with no windows and always use the same setting on the lights).
- In order to balance letter frequency with pre-existing letter-color pair preferences, we recommend that the letters be split into 'high-' and 'low-frequency' groups: for example, 'e' and 'n' are the high-frequency letters (average frequency = 14.5%), while 'a' and 'r' are the low-frequency letters (average frequency = 6.8%).
- Evaluate the presence of existing letter-color pair preferences. Most people have implicit preferences for letters in certain colors, and this preference may have an effect on the association that will be trained. Using a 5-point Likert scale, ask participants to rate their preferences for the 16 combinations of four letters with four colors. Instruct participants to “Please indicate to what extent you like the following letter-color pairs. (1 = strongly dislike, 3 = neutral, 5 = strongly preferred)." Preferred letter-color pairs are defined as a rating of 3 to 5. Nonpreferred letter-color pairs are defined as a rating of 1 to 3. The rating '3' is included in both groups because some subjects may rate all pairs as 3, indicating that they have no preferences.
- Randomly assign participants to two preference groups in order to test and control for an interaction between letter frequency and letter-color pair preference. For participants in preference group 1, assign letters 'e' and 'n' the preferred colors based on the questionnaire ratings (ratings 3-5). Assign letters 'a' and 'r' the nonpreferred colors based on the questionnaire ratings (ratings 1-3). For participants in preference group 2, assign letters 'e' and 'n' the nonpreferred colors based on the questionnaire ratings (ratings 1-3). Assign letters 'a' and 'r' the preferred colors based on the questionnaire ratings (ratings 3-5).
- Change the font in each book to Arial Black 10 pt. This font is used because it is bold and the colors stand out of the page more than they would if a thin-style font were used.
- Based on the letter-color assignments per participant, prepare the colored books in Microsoft Office Word. A customized Visual Basic Macro can be programmed that replaces each instance of a certain letter in black into a different color. A copy of this code can be found in Appendix A.
- Print and bind the books. Do not hand out any books until all prereading testing has been completed, including scanning.
- Instruct participants not to read in bad lighting conditions. It is important that all colors are vivid and clearly visible while reading.
- Instruct participants to keep track of how much they have read between testing sessions. Consider asking participants to also record how much they read per a unit of time by recording the number of pages read per hours or minutes. (e.g. pages/day can be converted to words/day or words/week). We note that not all of our participants have been diligent about recording the amount of reading they did each day. Therefore, we recommend that participants be as motivated as possible to do so; it helps to have participants write directly in the books. Obtaining an accurate representation of how much each participant read is important. After the participants finish reading, record the number of words and characters that each participant has read for the analyses.
- Decide before the experiment starts if participants will be excluded if they do not read a certain number of words by the time of the second testing session or if they stop reading a certain number of days before the second testing session will take place.
3. Testing Learned Letter-color Associations in the Behavioral Lab
Software is needed for the visual presentation of stimuli and the recording of response times and accuracy. Our lab uses the software Presentation (www.neurobs.com). However, software such as E-prime or MATLAB can also be used.
- Test participants both before and after reading the colored books. Use the following protocol during both the pre- and post-reading testing sessions. Make an appointment to test each participant. The appointment for the second testing session can be made at the same time or afterward. Make sure to give each participant the exact same protocol each time he or she is tested.
- Decide which keyboard keys to use. It is best to avoid keys that correspond to letters in the experiment. In this experiment, the following keyboard keys will be used: M, <, >, and /.
- Counterbalance the letter-key assignments by randomly assigning participants to different keyboard conditions in order to ensure that the same letter is not always paired with the same finger for all participants. Make sure that the keyboard conditions are balanced within the preference groups. In the current experiment, two keyboard conditions are used: For participants in keyboard condition 1, the keys M, <, >, and / correspond to letters e, n, a, and r, respectively. For participants in keyboard condition 2, the keys M, <, >, and / correspond to letters r, a, n, and e, respectively.
- A color-key training phase is necessary before the Stroop task is administered in order for participants to be able to react as fast as possible to the colors. Assign each key the congruent color for the letter that it corresponds to. The color assigned to each key will vary between participants because each participant is assigned a personalized set of letter-color pairs (see Stimuli), and each letter is assigned to a certain key (see step 3.3). We recommend putting colored stickers on the keys per participant.
- Instruct participants to use only one hand when responding and make sure that all participants use the same hand (this is because participants use only one hand in the MRI scanner).
- Administer the color-key training. Present the four colors on screen (colored squares with visual angle = 3°) one at a time in random order and instruct participants to respond with the correct key as fast and as accurately as possible.
- Give feedback after each trial for accuracy. Present 192 trials (48 times/color), giving participants a short break half way through the training.
- Monitor participants to make sure that by the end of the training, they respond quickly and accurately (>95% correct) without looking at their fingers. If this is not the case, readminister the training session. After the participant is properly trained on the color-key mappings, administer the Stroop task.
- Use a modified version of the classic Stroop task in order to test for automatic associations between the letters and colors18.
- Compare the following letter conditions with each other: congruent (the same letter-color pairings that each participant read in his or her books), and incongruent (all letter-color pairings that each participant did not read in his or her books).
- Make sure that the experiment has an equal number of congruent and incongruent stimuli in each condition. In the current experiment, 96 trials/condition are given (per testing session). Give participants at least one break during the Stroop task.
- Present letters on screen one at a time (average visual angle = 2°). Present all stimuli in the center of the screen on a white background.
- A single trial consists of one of four letters presented for 200 msec in black, followed by that same letter presented in one of four colors until a response is made (reaction time) or 2,000 msec (missed trial). Do not give feedback on accuracy.
- Jitter the inter-trial interval (a fixation cross) with a random integer between 1,000-2,000 msec.
- Randomize the presentation of the congruent and incongruent stimuli (not a blocked design).
- Instruct participants to indicate the color that the letter is presented in as fast and as accurately as possible (using the keys they were just trained to associate with each color).
- Measure the participants' reaction time and accuracy on each trial.
4. Testing Learned Letter-color Associations in the MRI Scanner
- Test participants in the scanner both before and after reading the colored books. The following protocol should be followed during both the pre- and post-reading testing sessions. Make an appointment to test each participant on the same day as the behavioral testing session. Make sure to give each participant the exact same protocol each time he or she is tested. When possible, maintain the same order of behavioral testing and MRI scanning during both the pre- and post-testing sessions for each participant.
- Consult with the MRI specialist at your location to determine the appropriate scan settings and scan sequences for that particular MRI scanner. We recommend acquiring whole-brain volumes for all functional and structural scans. We suggest simultaneously recording respiration and heart rate while collecting functional MRI data to be used as possible confound regressors.
- Train the color-key response mappings: follow steps 3.5-3.8 when participants are going to be scanned before they are tested in the computer lab or if a significant amount of time has passed between the behavioral testing and the scan session. Administer the color-key training before participants go into the scanner.
- Use a four-button response box in order for participants to respond to the task while they are in the scanner. Ensure that the color-key response mappings in the scanner are identical to the mappings that the participants have practiced on the keyboard.
- Administer a similar Stroop task in the scanner as the one administered in the behavioral lab (see steps 3.9-3.17). Take the following into account when designing the Stroop task for the MRI protocol:
- Design the Stroop task as an event-related paradigm (not a blocked design).
- Split the Stroop task into at least two separate runs to avoid fatigue-related performance decline. It is recommended to use the same number of total trials in both the MRI and behavioral sessions.
- Ensure that each run has an equal number of congruent and incongruent stimuli (e.g. 48 trials/congruency condition).
- Ensure that the colored letters remain on screen for the same amount of time during each trial (e.g. 2 sec). Ensure that the letters are not removed from the screen upon the event of a button-press. Instruct participants that this is the case. Inform them that they should not expect the letters to immediately disappear upon a response as they do in the behavioral lab and that they may assume that their responses are recorded so long as they push the buttons. Make sure to independently verify that the responses are being logged properly.
- Jitter the inter-trial interval (ITI) as the following: 50% of ITIs = 2 sec, 33.3% of ITIs = 4 sec, 5.6% of ITIs = 6 sec, 5.6% of ITIs = 7 sec, 5.6% of ITIs = 8 sec.
- Randomize the presentation of the congruent and incongruent stimuli (not a blocked design).
- Instruct participants to indicate the color that the letter is presented in as fast and as accurately as possible (using the keys they were just trained to associate with each color).
- Measure the participants' reaction time and accuracy on each trial while acquiring functional MRI images.
- In addition to functional imaging, structural images may also be acquired before and after reading during the scan sessions. For example, T1-weighted images that can be used in voxel-based morphometry38 and cortical-surface area analyses39, and diffusion-weighted images that can be used in fractional anisotropy40 or tractography analyses41. We recommend acquiring two T1-weighted volumes and four diffusion-weighted runs per testing session.
5. Subjective Experience of the Participants
- Evaluate the participants' experiences of reading in color. An example questionnaire is given in Appendix B.
Representative Results
After both testing sessions are completed, begin the data analysis to test for learned associations between letters and colors from reading in color. Only correct trials should be included in the reaction time analysis. A learned association is measured here by the size of the Stroop effect: the difference between incongruent and congruent stimuli in reaction times and accuracy. The Stroop effect is measured before and after reading. A significant interaction between testing session and congruency means that the Stroop effect is significantly different after reading compared to before reading, implying that the letter-color association has changed due to reading in color. The effect should be in the expected direction, namely that the Stroop effect is significantly larger after reading compared to before reading. An example of a significant interaction is illustrated in Figure 3. The Stroop effect in accuracy may be significantly different after reading compared to before reading. Since accuracy tends to be very high on this task, it is not always the case that a significant interaction between testing session and congruency is found for accuracy. Keep in mind that there are large individual differences in the learning effect and that these statistics are representative at the group level. For comparison, we report the test statistics, including effect sizes, of the significant effects found in the previous published study22 at the significance level of α = .05 (reaction time data): congruency, F(1,14) = 16.38, p = 0.001, ηp2 = 0.539; interaction testing session and congruency, F(1,14) = 5.85, p = 0.030, ηp2 = 0.295.
It is possible that there is an interaction between letter frequency and pre-existing letter-color pair preferences in the sample. In other words, assigning participants their preferred colors to the high-frequency letters and nonpreferred colors to the low-frequency letters (preference group 1) had an impact on the resulting change in the size of the Stroop effect compared to when participants are assigned their nonpreferred colors to the high-frequency letters and preferred colors to the low-frequency letters (preference group 2). For example, the change in the Stroop effect after reading may be significantly bigger in preference group 2 compared to preference group 1, indicating that pre-existing letter-color preferences interacted with the frequency of letter presentation. To test for this effect, first ensure that there are no unwanted significant differences between the mean (i.e. total) preference ratings of the two preference groups. Furthermore, check whether both preference groups have read the same amount of words or characters. In order to test an interaction between letter frequency and letter-color preference, 'preference group' can be included as a between-subjects factor in the analysis of factors: testing session and congruency. If a significant interaction effect with preference group is found, it can indicate that pre-existing associations between letters and colors are dependent on the frequency of letter presentation. An example of such an interaction is illustrated in Figure 4. It is also good to check whether the interaction between testing session and congruency is significant in both preference groups separately. If it were significant in one group, this would indicate that this preference group is driving the combined results of both groups (most likely preference group 2). The interaction between letter-color pair preference and relative letter frequency is an interesting path for future research.
In order to probe for individual differences in learning the letter-color associations, several correlation analyses can be carried out (and should be corrected for multiple comparisons). For example, word count or character count (the number of words or characters each participant read in color between testing sessions) can be correlated with the Stroop effect found after reading. Typically, we do not find a significant correlation between either word or character count and the Stroop effect when the sample size has been between 10-25 participants, indicating that some participants who read more than others did not necessarily develop a larger Stroop effect compared to others who read less and were inherently more sensitive to developing these associations.
For the brain imaging analysis, the interaction between testing session and congruency should be significant in order to verify that training letter-color associations by reading in color had a significant effect on brain activation. We suggest using a standard analysis pipeline for preprocessing functional MRI data42, including motion correction, and the general linear model (GLM) for the statistical analysis43. Contrasts of interest are congruent > incongruent and incongruent > congruent. If reading in color affects brain function in certain areas, then brain activation within these contrasts should be significantly different after reading compared to before reading. We are able to provide an example of brain activation from the post-reading session related to these contrasts at the single-subject level is illustrated in Figure 5 (i.e. the data shown here is not the result of the interaction between testing session and congruency). In order to test for differences in brain structure, we refer researchers to follow standard protocols38-41. We have yet to determine if reading in color may affect grey or white matter structures in the brain.
The degree to which an individual reports internalizing the color experience may positively correlate with the size of the post-reading Stroop effect. For example, sub questions Q26, Q27, and Q29 (see Appendix B) on the reading experience questionnaire typically predict the Stroop effect after reading. Significant results should be corrected for multiple comparisons. Possible correction methods include Bonferroni correction44, or alternatively, the false discovery rate45 (FDR).
The degree to which an individual reports internalizing the color experience may positively correlate with the size of the post-reading Stroop effect. For example, sub questions Q26, Q27, and Q29 (see Appendix B) on the reading experience questionnaire typically predict the Stroop effect after reading. Significant results should be corrected for multiple comparisons. Possible correction methods include Bonferroni correction44, or alternatively, the false discovery rate45 (FDR).
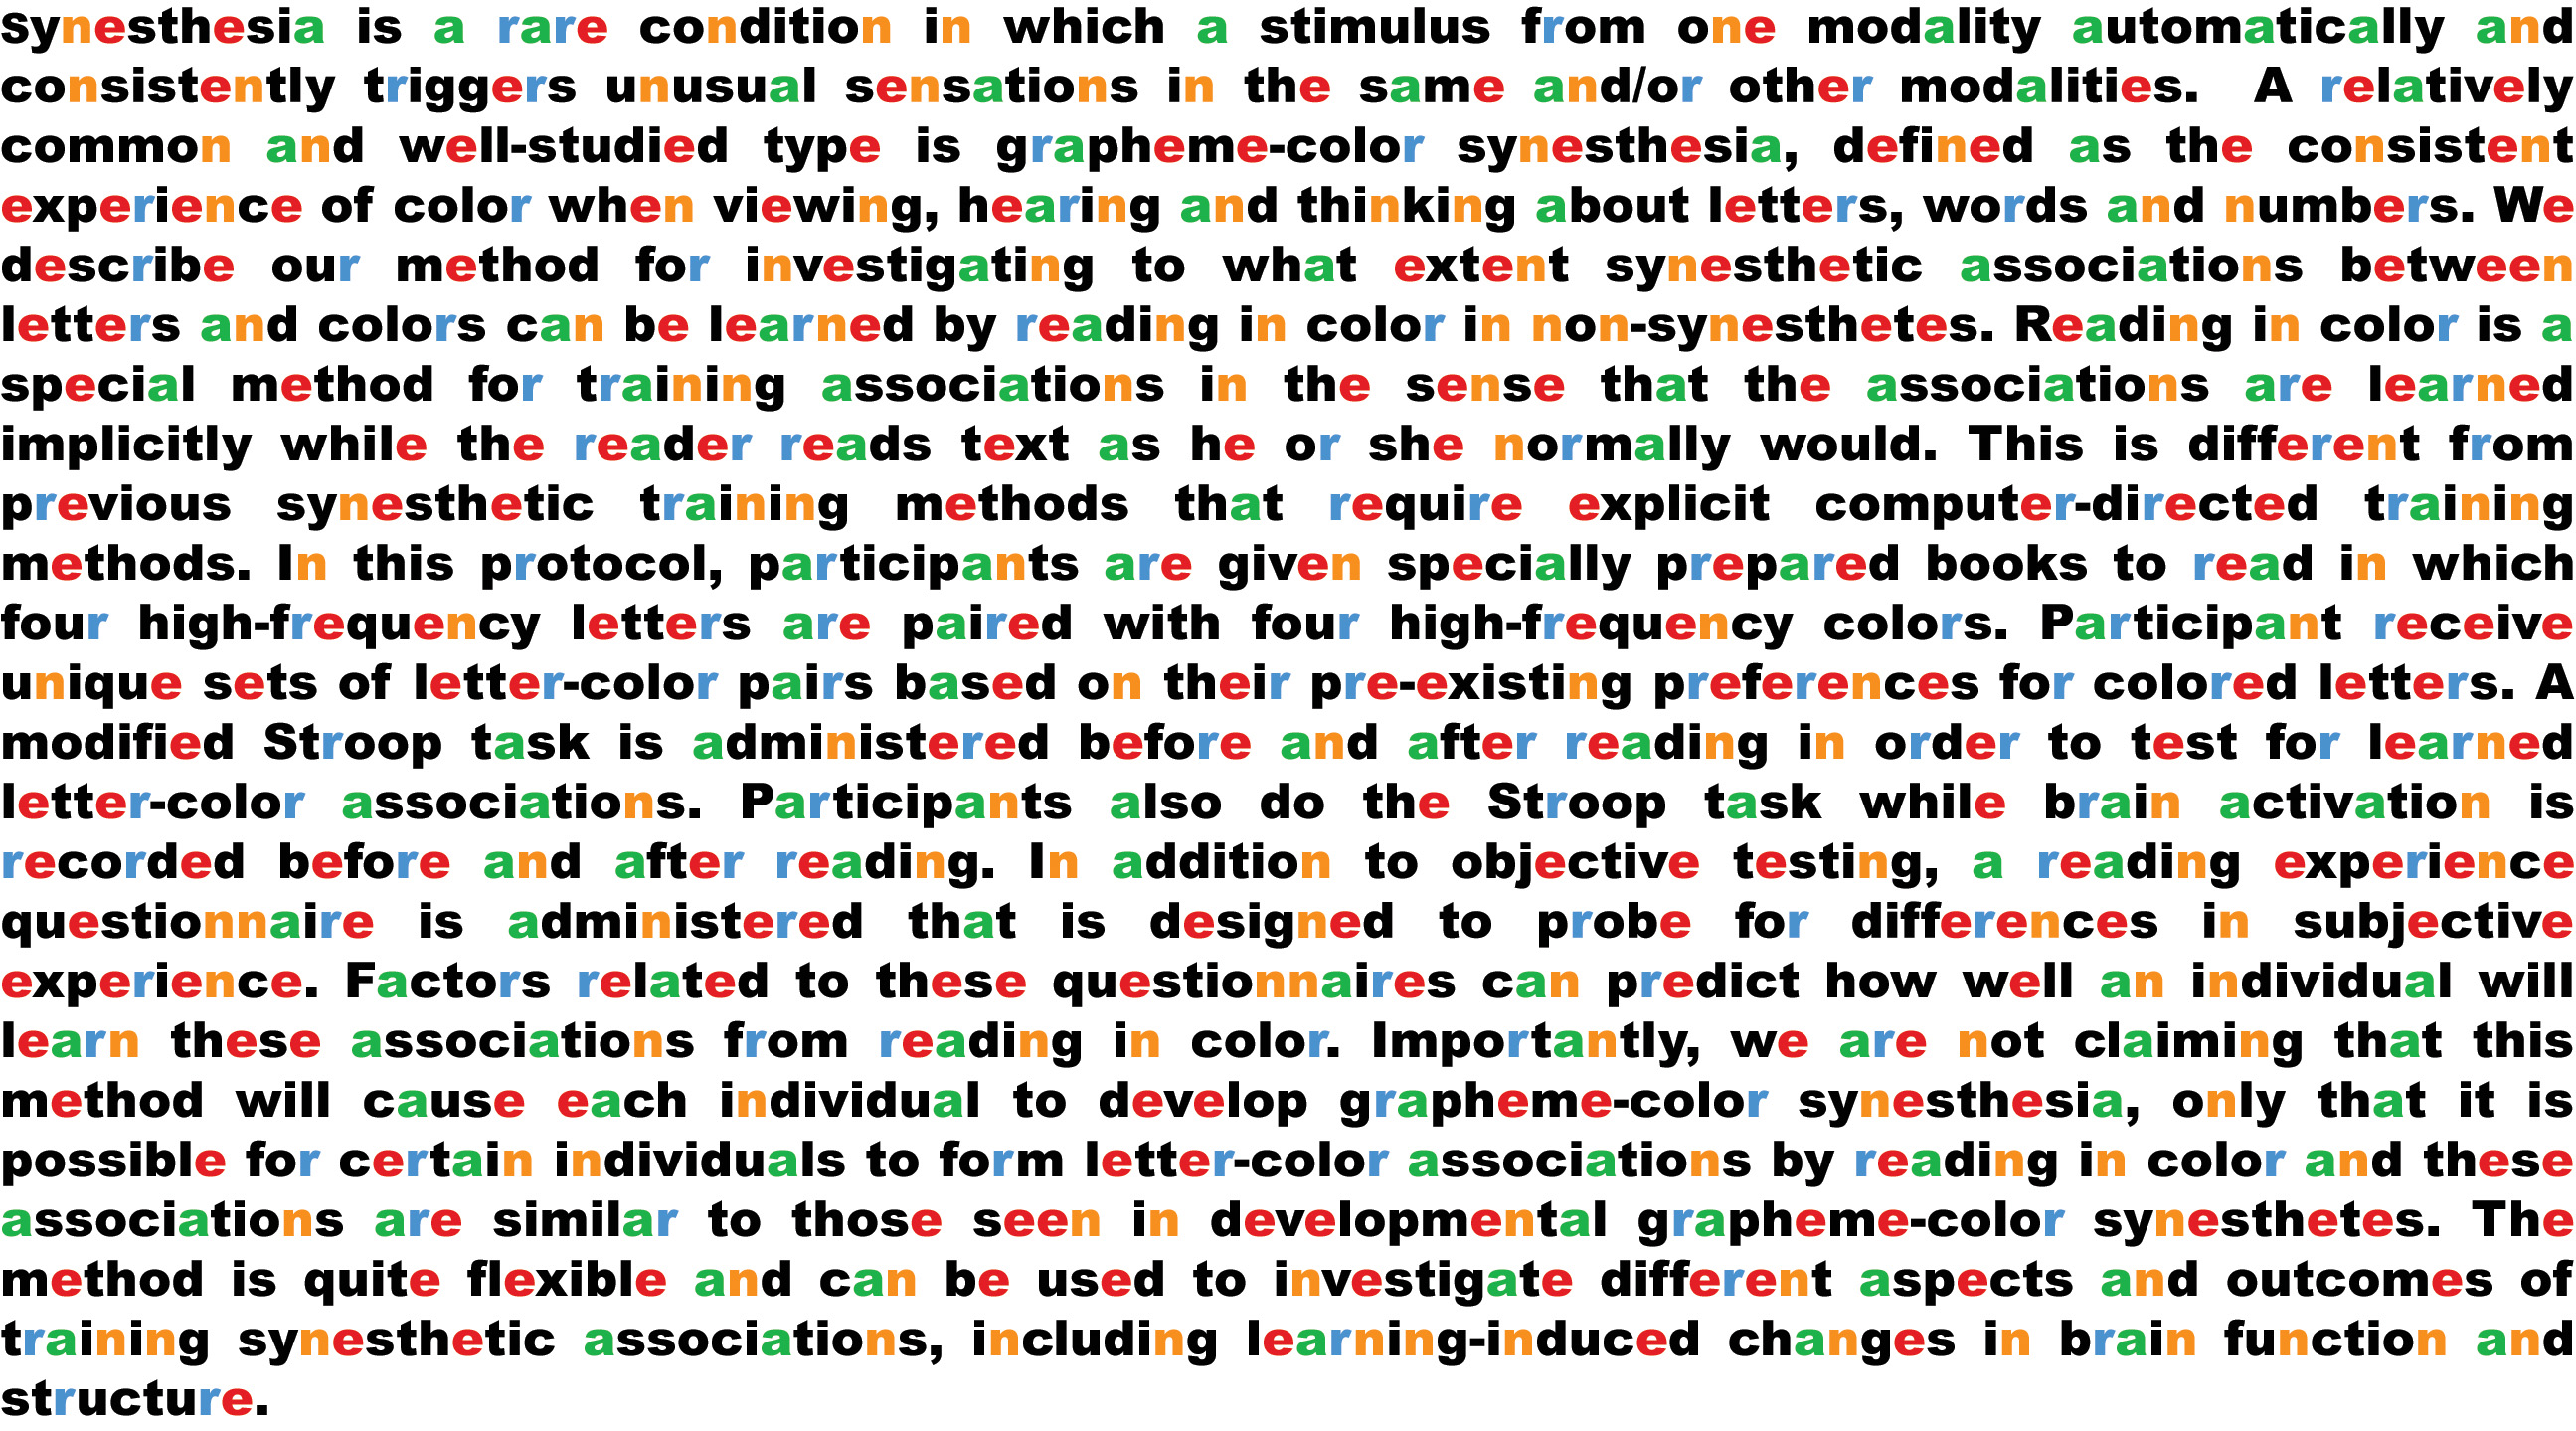
Figure 1: An example of a colored text fragment with four high-frequency letters (a, e, n, and r) consistently printed in four high-frequency colors (red, orange, green, and blue). Click here to view larger image.

Figure 2: Examples of congruency in the classic Stroop task and the synesthetic Stroop task. In this example, the red stimuli are congruent, and the green stimuli are incongruent. Click here to view larger image.

Figure 3: An example of a significant interaction between testing session and letter-color congruency. Error bars represent the standard error of the mean. A) The difference in reaction times between incongruent and congruent stimuli before and after reading. Participants will be slower in reacting to incongruently colored letters compared to congruently colored letters. B) The difference in accuracy between congruent and incongruent stimuli before and after reading. Participants will often be more accurate on congruent trials compared to incongruent trials after reading. Click here to view larger image.

Figure 4: An example of a possible interaction between preference group, testing session and congruency. In this example data, preference group 1 has a pre-existing Stroop effect, while preference group 2 does not. Preference group 1 has been assigned their preferences to the high-frequency letters (e and n) and their nonpreferences to the low-frequency letters (a and r), while preference group 2 has been assigned their nonpreferences to the high-frequency letters (e and n) and their preferences to the low-frequency letters (a and r). This graph illustrates that pre-existing preferences for letter-color pairs may possibly have an effect on subsequent results Click here to view larger image.

Figure 5: An example of the possible results obtained in brain activation of one participant during the Stroop task in the MRI scanner during the post-reading session (the data shown here is not the result of the interaction between testing session and congruency). Coordinates are in MNI space. The scanner used here is a Philips 3T Achieva, located in Amsterdam, the Netherlands. Click here to view larger image.
Discussion
We have described a basic method for training and testing letter-color associations through reading in color. An important aspect for this method to work properly is that the individual participants are each motivated to read the colored books, have done so, and reported the duration and amount of reading honestly, since they cannot be directly observed in the lab. It helps to recruit people who are reading enthusiasts because they normally do a lot of reading in their own time. In case the expected results are not obtained, it is important to rule out that a null effect (or lack of a Stroop effect) is simply due to the fact that the participants did not actually read the colored text. One way to ensure that participants have done the reading is for the experimenter(s) to read the books in order to converse with the participants about their contents. It is not always the case that each participant will develop a significant Stroop effect based on reading, but with a comparable sample size (N ~ 15), the representative results are typically found at the group level.
In terms of data analyses, decide before beginning the experiment whether outliers will be removed from the reaction time data. Our standard is that response times less than 150 msec and greater than 2.5 times the standard deviation per condition and session be removed. Before testing begins, it is good practice to determine a minimum criterion for the amount of reading necessary (we suggest around 40,000 words as a guideline) and to exclude participants who have not read at least this amount. Also, consider excluding participants who have stopped reading a certain number of days before the testing session. After the data has been collected, make sure that only correct trials are included in the reaction time analysis and check for speed-accuracy tradeoffs. Also, check the accuracy on the color-key response training to make sure that participants learned which key goes with which color. Watching the participants when doing the color-key training to make sure that they are able to do the task without looking at their fingers ensures the quality of the data to be collected. Consider checking whether the Stroop effect is present in most or all of the participants or whether only a few participants with very strong effects seem to be driving the group-level effects. Similarly, check whether one of the preference groups is driving the effects (in our experience, preference group 2 typically showed a larger change in the Stroop effect due to reading).
In the brain imaging functional data, ensure that the quality of the data is good enough by testing for significant (de)activation for all stimuli regardless of congruency. Furthermore, consider adding respiration and heart rate as confound regressors in your GLM analysis. Another control measure during scanning is the use of an eye-tracker to ensure that the participants are indeed watching the screen, doing the task properly and not asleep. Short runs (less than 10 min) help to avoid concentration and fatigue issues. Finally, the characteristics of the (subject) sample tested will also have an effect on the results and should always be taken into account if not a variable of interest because age and gender affect brain function and structure34,35. The interpretation of brain activation related to trained letter-color associations in the Stroop task remains an interesting line for future research. Regarding the classic Stroop task, the contrast incongruent > congruent is typically associated with frontal lobe and anterior cingulate activation that is thought to reflect cognitive control mechanisms because it is necessary to inhibit an automatic response in the incongruently colored condition compared to the congruent condition, which involves response and conflict monitoring46. The contrast congruent > incongruent has received less attention in the conflict processing literature47. The synesthetic version of the Stroop task has not been employed in many fMRI studies on grapheme-color synesthesia12. Two studies have tested synesthetes using a comparable synesthetic Stroop task in an fMRI paradigm, but they did not report comparable contrasts48,49.
Concerning the brain imaging structural data, consider using the significant clusters of activation found during the Stroop task as masks for regions of interests in the statistical analyses of the structural images. In addition, consider correlating white and grey matter properties with behavior on the Stroop task in order to test whether macroscopic brain structures predict inter-individual differences in performance and learning.
There are many aspects of the current protocol that can be changed based on the research goal of the experiment at hand. In the Stroop task, for example, the number of letters and colors trained can vary. It should be noted that increasing the number of colors tested would increase the necessary number of response options during the Stroop task affecting the experimental paradigm. Some researchers use a microphone to record vocal responses in the computer lab, although this is not as practical in the MRI scanner. A baseline condition can be added to the Stroop task (in addition to the congruent and incongruent conditions), in which letters that have not been colored in the books are presented in the same colors used for the congruent and incongruent conditions. Using a baseline condition can allow better inference as to how the congruent and incongruent conditions change over time in comparison to any change in the baseline condition. The duration and amount of reading may vary and may also be a variable of interest decided upon by the researchers, as well as the time in between reading the last colored book and the last testing session. Many other cognitive and perceptual tasks and questionnaires can be added to the protocol. Lastly, the protocol may be easily combined with other neuroimaging techniques.
The presence of a synesthetic Stroop effect in trainee data mimics the behavior on the same task found in grapheme-color synesthetes18,27,50. We would like to stress the fact that the presence of a Stroop effect is not enough to claim that trainees have genuine synesthesia. Developmental synesthesia is defined by more than just a synesthetic Stroop effect or perceptual color experiences, such as consistency of the letter-color associations over time with an onset in early childhood51, differences in the function and structure of the brain12, and a possible genetic predisposition13,14 (for a discussion about defining synesthesia, see references52-55). Therefore, we prefer the term 'pseudo-synesthesia', in order to differentiate trainees (even if they would report color experiences) from grapheme-color synesthetes, who report the experience of synesthetic associations for as long as they can remember.
Individual differences in the learning effect (i.e. the size of the post-reading Stroop effect) may be predicted by the self-report rating of how much the color experience is internalized (i.e. 'in the mind's eye'), indicating that the subjective experience of color plays a role in training synesthetic associations. Such a correlation does not provide definitive proof that color experiences related to the trained letters are perceptual in nature and not solely semantic (propositional) associations. It is possible that the questionnaire is biased because it excludes the possibility to indicate that an individual experiences a semantic association without having any experience of color. Following the suggestion of an anonymous reviewer on this point, we propose to add an additional question to the questionnaire: “When I see certain letters in black text, I do not see color or experience color (in the mind's eye), but I have an automatic association to color." Further research is necessary in order to understand whether sensitivity to forming letter-color associations is related to other processes, such as visual mental imagery. It remains to be seen whether trained letter-color associations go beyond semantic associations by having similar qualities as visual mental images or veridical perception.
Reading in color is a method for training letter-color associations. This method can be used to examine the extent to which cognitive advantages seen in synesthesia, such as better memory for certain stimuli categories29-31 may be trained in nonsynesthetes and whether this training may induce changes in the brains of the trainees. It is promising in the sense that there is still much to learn concerning the effects of both short-term and long-term 'reading in color' training methods. We hope that by providing the basic protocol that we have developed, others will use it to progress not just the field of (training) synesthesia research, but the cognitive neuroscience of learning and memory as well.
Appendix A: Code for coloring books in Microsoft Word using a Visual Basic macro
Sub Letters2Colors()
Dim a_color As Long
Dim e_color As Long
Dim n_color As Long
Dim r_color As Long
e_color = RGB(230, 0, 0) 'red
n_color = RGB(255, 143, 0) 'orange
a_color = RGB(0, 181, 0) 'green
r_color = RGB(0, 155, 255) 'blue
Selection.Find.ClearFormatting
Selection.Find.Replacement.ClearFormatting
With Selection.Find
.Text = "a"
.Replacement.Text = "a"
.Forward = True
.Wrap = wdFindContinue
.Format = True
.MatchCase = True
.MatchWholeWord = False
.MatchByte = False
.CorrectHangulEndings = True
.MatchWildcards = False
.MatchSoundsLike = False
.MatchAllWordForms = False
.Replacement.Font.Color = a_color
End With
Selection.Find.Execute Replace:=wdReplaceAll
Selection.Find.ClearFormatting
Selection.Find.Replacement.ClearFormatting
With Selection.Find
.Text = "e"
.Replacement.Text = "e"
.Forward = True
.Wrap = wdFindContinue
.Format = True
.MatchCase = True
.MatchWholeWord = False
.MatchByte = False
.CorrectHangulEndings = True
.MatchWildcards = False
.MatchSoundsLike = False
.MatchAllWordForms = False
.Replacement.Font.Color = e_color
End With
Selection.Find.Execute Replace:=wdReplaceAll
Selection.Find.ClearFormatting
Selection.Find.Replacement.ClearFormatting
With Selection.Find
.Text = "n"
.Replacement.Text = "n"
.Forward = True
.Wrap = wdFindContinue
.Format = True
.MatchCase = True
.MatchWholeWord = False
.MatchByte = False
.CorrectHangulEndings = True
.MatchWildcards = False
.MatchSoundsLike = False
.MatchAllWordForms = False
.Replacement.Font.Color = n_color
End With
Selection.Find.Execute Replace:=wdReplaceAll
Selection.Find.ClearFormatting
Selection.Find.Replacement.ClearFormatting
With Selection.Find
.Text = "r"
.Replacement.Text = "r"
.Forward = True
.Wrap = wdFindContinue
.Format = True
.MatchCase = True
.MatchWholeWord = False
.MatchByte = False
.CorrectHangulEndings = True
.MatchWildcards = False
.MatchSoundsLike = False
.MatchAllWordForms = False
.Replacement.Font.Color = r_color
End With
Selection.Find.Execute Replace:=wdReplaceAll
End Sub
Appendix B: Example reading experience questionnaire
The following questions should be given in random order:
Q1) I enjoy reading
Q2) I do not enjoy reading
Q3) I enjoyed reading in color
Q4) I did not enjoy reading in color
Q5) I enjoyed the content of the book
Q6) I did not enjoy the content of the book
Q7) The colored text was pretty
Q8) The colored text was ugly
Q9) The colored text was distracting
Q10) The colored text was not distracting
Q11) The colored text became less distracting over time
Q12) The colored text became more distracting over time
Q13) I felt as if I was reading faster in color (by the end of the book)
Q14) I felt as if I was reading slower in color (by the end of the book)
Q15) I was more motivated to read this book compared to a book with normal black text
Q16) I was less motivated to read this book compared to a book with normal black text
Q17) I like the color red
Q18) I like the color orange
Q19) I like the color green
Q20) I like the color blue
Q21) I read more than an average person
Q22) I read less than an average person
Q23) I tend to read books from the same genre
Q24) I tend to read books from a variety of genres
Q25) When I see certain letters in black text (e,n,a,r), I see them in color
Q26) When I see certain letters in black text (e,n,a,r), I experience them in color (i.e. in the mind's eye)
Q27) When I think about certain letters (e,n,a,r), I experience them in color (i.e. in the mind's eye)
Q28) When I think about certain letters (e,n,a,r), I see them in color
Q29) Whenever I see or think about letters, I have no color experience
Q30) Choose one of the following statements that best describes your experience (A to E)…
(A) When I see certain letters in black text (e,n,a,r), I see them in color
(B) When I see certain letters in black text (e,n,a,r), I experience them in color (i.e. in the mind's eye)
(C) When I think about certain letters (e,n,a,r), I experience them in color (i.e. in the mind's eye)
(D) When I think about certain letters (e,n,a,r), I see them in color
(E) Whenever I see or think about letters, I have no color experience
Open question: Have you noticed any changes in behavior or experience since you started reading the book(s)?
Disclosures
The authors have nothing to disclose.
Acknowledgments
We thank Nick Daems for writing the Visual Basic Word macro. We would like to acknowledge and thank the publishers Nijgh and van Ditmar (Amsterdam, the Netherlands) for providing Dutch language materials for our research protocol. We would also like to thank all of our participants.
Materials
| Name | Company | Catalog Number | Comments |
| Achieva 3T MRI scanner | Philips | website for information: http://www.healthcare.philips.com/main/products/mri/systems/achievaTX | |
| Presentation | Neurobehavioral Systems | Software for conducting psychological experiments: www.neurobs.com |
References
- Simner, J., Mulvenna, C., Sagiv, N., et al. Synaesthesia: The prevalence of atypical cross-modal experiences. Perception. 35 (8), 1024-1033 (2006).
- Baron-Cohen, S., Wyke, M. A., Binnie, C. Hearing words and seeing colours: An experimental investigation of a case of synaesthesia. Perception. 16 (6), 761-767 (1987).
- Cytowic, R. E. Synesthesia: Phenomenology and neuropsychology. Psyche. 2 (10), 2-10 (1995).
- Cytowic, R. E., Wood, F. B. Synesthesia* 1:: II. psychophysical relations in the synesthesia of geometrically shaped taste and colored hearing. Brain Cogn. 1, 36-49 (1982).
- Dixon, M. J., Smilek, D., Cudahy, C., Merikle, P. M. Five plus two equals yellow. Nature. 406 (6794), 365-365 (2000).
- Mattingley, J. B., Rich, A. N., Yelland, G., Bradshaw, J. L. Unconscious priming eliminates automatic binding of colour and alphanumeric form in synaesthesia. Nature. 410 (6828), 580-582 (2001).
- Palmeri, T. J., Blake, R., Marois, R., Flanery, M. A., Whetsell, W. The perceptual reality of synesthetic colors. Proc. Natl. Acad. Sci. U.S.A. 99 (6), 4127-4131 (2002).
- Blake, R., Palmeri, T. J., Marois, R., Kim, C. Y. On the perceptual reality of synesthetic color. Synesthesia: Perspectives from Cognitive Neuroscience. , University Press. New York: Oxford. 47-73 (2005).
- Ramachandran, V. S., Hubbard, E. M. Psychophysical investigations into the neural basis of synaesthesia. Proc. Royal Soc. B Biol. Sci. 268 (1470), 979-983 (2001).
- Ramachandran, V. S., Hubbard, E. M. Synaesthesia: A window into perception, thought and language. J. Conscious. Stud. 8 (12), 3-34 (2001).
- Smilek, D., Dixon, M. J., Cudahy, C., Merikle, P. M. Synaesthetic photisms influence visual perception. J. Cogn. Neurosci. 13 (7), 930-936 (2001).
- Rouw, R., Scholte, H. S., Colizoli, O. Brain areas involved in synaesthesia: A review. J. Neuropsychol. 5 (2), 214-242 (2011).
- Asher, J. E., Lamb, J. A., Brocklebank, D., et al. A whole-genome scan and fine-mapping linkage study of auditory-visual synesthesia reveals evidence of linkage to chromosomes 2q24, 5q33, 6p12, and 12p12. Am. J. Human Genet.. 84 (2), 279-285 (2009).
- Tomson, S. N., Avidan, N., Lee, K., et al. The genetics of colored sequence synesthesia: Suggestive evidence of linkage to 16q and genetic heterogeneity for the condition. Behav. Brain Res. 223 (1), 48-52 (2011).
- Barnett, K. J., Finucane, C., Asher, J. E., et al. Familial patterns and the origins of individual differences in synaesthesia. Cognition. 106 (2), 871-893 (2008).
- Simner, J., Ward, J., Lanz, M., et al. Non-random associations of graphemes to colours in synaesthetic and non-synaesthetic populations. Cogn. Neuropsychol. 22 (8), 1069-1085 (2005).
- Cohen Kadosh, R., Sagiv, N., Linden, D. E. J., Robertson, L. C., Elinger, G., Henik, A. When blue is larger than red: Colors influence numerical cognition in synesthesia. J. Cogn. Neurosci. 17 (11), 1766-1773 (2005).
- Meier, B., Rothen, N. Training grapheme-colour associations produces a synaesthetic stroop effect, but not a conditioned synaesthetic response. Neuropsychologia. 47 (4), 1208-1211 (2009).
- Brang, D., Kanai, S., Ramachandran, V. S., Coulson, S. Contextual priming in Grapheme-Color synesthetes and yoked controls: 400 msec in the life of a synesthete. J. Cogn. Neurosci. 23 (7), 1681-1696 (2011).
- Rothen, N., Wantz, A., Meier, B. Training synaesthesia. Perception. 40 (10), 1248-1250 (2011).
- Kusnir, F., Thut, G. Formation of automatic letter-colour associations in non-synaesthetes through likelihood manipulation of letter-colour mappings. Neuropsychologia. 50 (14), 6341-6352 (2012).
- Colizoli, O., Murre, J. M., Rouw, R. Pseudo-synesthesia through reading books with colored letters. PLoS ONE. 7 (6), (2012).
- Stroop, J. R. Studies of interference in serial verbal reactions. J. Exp. Psychol. 18 (1), 643-662 (1935).
- MacLeod, C. M., Dunbar, K. Training and stroop-like interference: Evidence for a continuum of automaticity. Journal of Experimental Psychology: Learn. Mem. Cogn. 14 (1), 126-135 (1988).
- Baron-Cohen, S., Harrison, J., Goldstein, L. H., Wyke, M. Coloured speech perception: Is synaesthesia what happens when modularity breaks down. Perception. 22 (4), 419-426 (1993).
- Wollen, K. A., Ruggiero, F. T. Colored-letter synesthesia. J. Ment. Imagery. 7 (2), 83-86 (1983).
- Elias, L. J., Saucier, D. M., Hardie, C., Sarty, G. E. Dissociating semantic and perceptual components of synaesthesia: behavioural and functional neuroanatomical investigations. Cogn. Brain Res. 16 (2), 232-237 (2003).
- Barnett, K. J., Newell, F. N. Synaesthesia is associated with enhanced, self-rated visual imagery. Conscious. Cogn. 17 (3), 1032-1039 (2008).
- Yaro, C., Ward, J. Searching for Shereshevskii: What is superior about the memory of synaesthetes. Q. J. Exp. Psychol. 60 (5), 681-695 (2007).
- Rothen, N., Meier, B., Ward, J. Enhanced memory ability: Insights from synaesthesia. Neurosci. Biobehav. Rev. 36 (8), 1952-1963 (2012).
- Terhune, D. B., Wudarczyk, O. A., Kochuparampil, P., Cohen Kadosh, R. Enhanced dimension-specific visual working memory in grapheme-color synesthesia. Cognition. 129 (1), 123-137 (2013).
- Op de Beeck,, Baker, H. P., DiCarlo, C. I., Kanwisher, J. J., G, N. Discrimination training alters object representations in human extrastriate cortex. J. Neurosci. 26 (50), 13025-13036 (2006).
- Kwok, V., et al. Learning new color names produces rapid increase in gray matter in the intact adult human cortex. Proc. Natl. Acad. Sci. U.S.A. 108 (16), 6686-6688 (2011).
- Cahill, L. Why sex matters for neuroscience. Nat. Rev. Neurosci. 7 (6), 477-484 (2006).
- Hedden, T., Gabrieli, J. D. E. Insights into the ageing mind: a view from cognitive neuroscience. Nat. Rev. Neurosci. 5 (2), 87-96 (2004).
- Rothen, N., Seth, A. K., Witzel, C., Ward, J. Diagnosing synaesthesia with online colour pickers: Maximising sensitivity and specificity. J. Neurosci. Methods. 215 (1), 156-160 (2013).
- Eagleman, D. M., Kagan, A. D., Nelson, S. S., Sagaram, D., Sarma, A. K. A standardized test battery for the study of synesthesia. J. Neurosci. Methods. 159 (1), 139-145 (2007).
- Ashburner, J., Friston, K. J. Voxel-based morphometry—the methods. Neuroimage. 11 (6), 805-821 (2000).
- Dale, A. M., Fischl, B., Sereno, M. I. Cortical surface-based analysis: I. segmentation and surface reconstruction. Neuroimage. 9 (2), 179-194 (1999).
- Smith, S. M., et al. Tract-based spatial statistics: Voxelwise analysis of multi-subject diffusion data. Neuroimage. 31 (4), 1487-1505 (2006).
- Behrens,, et al. Non-invasive mapping of connections between human thalamus and cortex using diffusion imaging. Nat. Neurosci. 6 (7), 750-757 (2003).
- Huettel, S. A., Song, A. W., McCarthy, G. Functional magnetic resonance imaging. , Massachusetts: Sinauer Associates. (2004).
- Beckmann, C. F., Jenkinson, M., Smith, S. M. General multilevel linear modeling for group analysis in FMRI. Neuroimage. 20 (2), 1052-1063 (2003).
- Sedgwick, P. Multiple significance tests: the Bonferroni correction. BMJ. 344, (2012).
- Benjamini, Y., Hochberg, Y. Controlling the false discovery rate: a practical and powerful approach to multiple testing. J. R. Statist. Soc. B Methodol. 57 (1), 289-300 (1995).
- Leung, H. C., Skudlarski, P., Gatenby, J. C., Peterson, B. S., Gore, J. C. An event-related functional MRI study of the Stroop color word interference task. Cereb. Cortex. 10 (6), 552-560 (2000).
- Roberts, K. L., Hall, D. A. Examining a supramodal network for conflict processing: a systematic review and novel functional magnetic resonance imaging data for related visual and auditory stroop tasks. J. Cogn. Neurosci. 20 (6), 1063-1078 (2008).
- Specht, K., Laeng, B. An independent component analysis of fMRI data of grapheme-colour synaesthesia. J. Neuropsychol. 5 (2), 203-213 (2011).
- Laeng, B., Hugdahl, K., Specht, K. The neural correlate of colour distances revealed with competing synaesthetic and real colours. Cortex. 47 (3), 320-331 (2011).
- Rothen, N., Nikolić, D., Jürgens, U. M., Mroczko-Wąsowicz, A., Cock, J., Meier, B. Psychophysiological evidence for the genuineness of swimming-style colour synaesthesia. Conscious. Cogn. 22 (1), 35-46 (2013).
- Ward, J. Synaesthesia. Ann. Rev. Psychol. 64 (1), 49-75 (2013).
- Simner, J. Defining Synaesthesia. Br. J. Psychol. 103 (1), 1-15 (2012).
- Cohen Kadosh, R., Terhune, D. B. Redefining synaesthesia. Br. J. Psychol. 103 (1), 20-23 (2012).
- Eagleman, D. M. Synaesthesia in its protean guises. Br. J. Psychol. 103 (1), 16-19 (2012).
- Simner, J. Defining synaesthesia: A response to two excellent commentaries. Br. J. Psychol. 103 (1), 24-27 (2012).
