We describe the synthesis and properties of multifunctional Fe2O3-Au nanoparticles produced by a wet chemical approach and investigate their photothermal properties using laser irradiation. The composite Fe2O3-Au nanoparticles retain the properties of both materials, creating a multifunctional structure with excellent magnetic and plasmonic properties.
Method Article
Multifunctional Hybrid Fe2O3-Au Nanoparticles for Efficient Plasmonic Heating
In This Article
Summary
Abstract
One of the most widely used methods for manufacturing colloidal gold nanospherical particles involves the reduction of chloroauric acid (HAuCl4) to neutral gold Au(0) by reducing agents, such as sodium citrate or sodium borohydride. The extension of this method to decorate iron oxide or similar nanoparticles with gold nanoparticles to create multifunctional hybrid Fe2O3-Au nanoparticles is straightforward. This approach yields fairly good control over Au nanoparticle dimensions and loading onto Fe2O3. Additionally, the Au metal size, shape, and loading can easily be tuned by changing experimental parameters (e.g., reactant concentrations, reducing agents, surfactants, etc.). An advantage of this procedure is that the reaction can be done in air or water, and, in principle, is amenable to scaling up. The use of such optically tunable Fe2O3-Au nanoparticles for hyperthermia studies is an attractive option as it capitalizes on plasmonic heating of gold nanoparticles tuned to absorb light strongly in the VIS-NIR region. In addition to its plasmonic effects, nanoscale Au provides a unique surface for interesting chemistries and catalysis. The Fe2O3 material provides additional functionality due to its magnetic property. For example, an external magnetic field could be used to collect and recycle the hybrid Fe2O3-Au nanoparticles after a catalytic experiment, or alternatively, the magnetic Fe2O3 can be used for hyperthermia studies through magnetic heat induction. The photothermal experiment described in this report measures bulk temperature change and nanoparticle solution mass loss as functions of time using infrared thermocouples and a balance, respectively. The ease of sample preparation and the use of readily available equipment are distinct advantages of this technique. A caveat is that these photothermal measurements assess the bulk solution temperature and not the surface of the nanoparticle where the heat is transduced and the temperature is likely to be higher.
Introduction
Beginning with their use in ancient dichroic glass,1 gold nanoparticles (AuNPs) have often contributed to the development of new technologies.2,3 More modern examples of these technologies include cloaking devices and particles that can both detect and treat cancer.4,5 AuNPs have many remarkable properties, but the most notable among these is the presence of localized surface plasmon resonances (LSPRs), which occur when incident electromagnetic radiation resonantly drives free electrons into collective oscillations, creating intense and highly confined electromagnetic fields.6 An intriguing aspect of LSPRs is that they are tunable. That is, the resonance energy can be adjusted by modifying the shape and size of the AuNPs or by changing the refractive index of the ambient environment. Another property of AuNPs, and gold in general, is that they are relatively expensive. While this might make gold more attractive from a luxury standpoint, for technological applications, this is a drawback and could be an obstacle to general use. Two potential solutions for this problem are searching for less-expensive alternative materials that exhibit similar properties as gold, or finding a way to combine gold with another material to create a composite material with similar properties but smaller amounts of the precious metal. The latter solution is perhaps more interesting as it allows for the possibility of creating a multifunctional hybrid nanostructure with the physicochemical properties of two or more materials.7
Iron(III) oxide, Fe2O3, is an excellent candidate for one component of such a mixture because it is widely available, inexpensive, and non-toxic. Furthermore, the maghemite phase, γ-Fe2O3, is ferrimagnetic, and the hematite phase, α-Fe2O3, is weakly ferromagnetic. Thus, the combination of gold with Fe2O3 could potentially yield nanoparticles that exhibit plasmonic properties and also interact with external magnetic fields, yet are significantly less expensive than pure gold. Such a hybrid nanostructure could find interesting real world applications. For example, Fe2O3-Au nanoparticles have proven useful for both cancer diagnosis and treatment through magnetic resonance imaging and photothermal therapy.8 In this case, Fe2O3 functions as an MRI contrast agent, while the Au portion locally converts incident light to heat through dissipation of electromagnetic energy absorbed during LSPR. Additionally, Fe2O3-Au nanoparticles have demonstrated plasmonic enhancement of the catalytic conversion of CO into CO2 under visible light illumination, and such structures could also be used for photothermal solar energy conversion.9,10
This report describes the synthesis of Fe2O3-Au nanoparticles using a simple wet chemical method. The hybrid structure consists of a Fe2O3 core that is decorated with smaller AuNPs. Importantly, the obtained Fe2O3-Au nanoparticles retain both magnetic and plasmonic properties of the constituent materials, which creates a multifunctional particle that could be useful for a variety of applications. In order to illustrate the plasmonic applications of these hybrid nanoparticles, photothermal characterization of the nanoparticles using a laser heating system is also described. The photothermal measurements demonstrate that the hybrid Fe2O3-Au nanoparticles are able to heat aqueous solutions as efficiently as pure AuNPs, even with a significantly smaller concentration of the noble metal. These results validate the method of using composite or hybrid materials to reduce costs and achieve greater functionality.
Protocol
1. Nanomaterials Synthesis Protocol
- Prepare a stock solution of Fe2O3 of 25 mM.
Note: All stock solutions are prepared using deionized water unless stated otherwise. - Take a 25 ml conical flask.
- Add 10 ml deionized (DI) water and a stir bar, and place it on a heating block.
- Add 100 µl of Fe2O3 stock solution (25 mM) to this flask.
- Heat the solution while stirring for approximately 5 min.
- Prepare 10 ml 1% sodium citrate by dissolving 0.1 g of sodium citrate to 10 ml of water.
- Add 1 ml of the 1% sodium citrate solution to the 25 ml flask containing the Fe2O3 aqueous solution.
- Bring the solution to a boil (100 °C).
- Add 250 µl of 0.01 M chloroauric acid.
- Continue heating the solution at 100 °C for 10 min. After several minutes (2-3 min), the solution turns red/brownish indicating that Au nanoparticles are being produced.
- Remove the solution from the heating block and allow it to cool off at RT (approximately 20 °C) (1-2 hr).
- Purify the samples by centrifugation for 7 min at 4,700 × g.
- Remove the supernatant from the centrifuged samples.
- Re-disperse the centrifuged nanoparticles in DI water, up to 10 ml.
2. Nanoparticles Characterization
- SEM/EDX characterization:
- Place 1-2 µl of centrifuged nanoparticles on a copper grid and allow it to dry for 1 hr.
- Place sample in a clean container and take it to the SEM/EDX for characterization.11,12
- UV-Vis characterization:
- Turn on the UV-Vis and allow it to warm up for 10-15 min.
- Record a reference DI water spectrum.
- Place 1 ml of the nanoparticle's aqueous solution in a methacrylate cuvette and record the UV-Vis spectra over wavelengths λ = 300 - 1,000 nm.
- Avoid saturation of the signal by keeping the maximum absorbance lesser than ~1.2. If the observed maximum absorbance is larger, reduce the peak height by diluting the sample or using a shorter path length cuvette.
Note: Surface plasmon band of Au (λ ≈ 525 nm) should be easily observed.
- Magnetic manipulation
- Place 3 ml of the red/brownish aqueous samples of magnetic/plasmonic nanostructures in methacrylate cuvettes.
- Place a commercially purchased magnet (~100 Gauss) in the close proximity of the cuvette.
Note: Within minutes, all magnetic/plasmonic nanoparticles are "attached" to the methacrylate cuvette side where the magnet was placed. Solution turned from brown to colorless indicating that the nanoparticles retained their magnetic properties even after Au was deposited on Fe2O3 surface.
- Inductively Coupled Plasma Mass Spectrometry (ICP-MS) analysis.13
- Use aqueous samples of nanoparticle solutions in this analysis.
- Digest purified nanoparticle samples in nitric acid to transform them to an ionic form prior to mass analysis experiments by transferring all samples in tubes with a final volume of 10 ml of 2% nitric acid. Allow 30 min for digestion to take place.
- Create a calibration curve with known concentrations of analytes of interest (e.g., Au, Fe).
- Spike samples with an internal standard solution containing 10 ppb Rh and In and analyze in the semi-quantitative mode of the ICP-MS according to manufacturer's instructions. This technique entails the analysis of a NIST traceable multi-element standard (10 ppb In and 100 ppb Li, Mn, Fe, Co, Sr, Cd, Bi, and U).
- Compare the determined intensities for the standard with the intensities for the other samples to yield approximate concentrations for selected elements. To account for plasma and instrument drifts, all samples should have a minimum of 10 ppb concentration for In that was added to all samples.
- Determine elemental concentration of the analytes of interests for the prepared solutions by following these steps:
- Perform an initial calibration validation sample of the multi-element standard (10 ppb In and 75 ppb Li, Mg, Fe, Co, Sr, Cd, Bi, and U).
- Perform initial calibration blank of deionized water.
- Perform ICP-MS analysis on two sample of interest.
- Continue performing calibration validation sample (10 ppb In and 75 ppb Li, Mg, Fe, Co, Sr, Cd, Bi, and U) of the multi-element standard.
- Continue calibration blank of deionized water.
Note: According to the vendor specifications, the ICP-MS measurements have an uncertainty of 20%. Nanomaterial laboratory work was performed under a fume hood. PPE (lab coat, apron, thin mil nitrile gloves for incidental contact, and goggles) and a face shield should be used if hood sash is above chin level. Minimum PPE required when working with nanoscale materials; disposable lab coat, thin mil nitrile gloves for incidental contact and safety glasses with side shields will be worn in the lab when handling nanomaterials. Nanomaterial bearing waste shall not be put in regular trash or down the drain.
3. Laser Heating Experiment
- Turn on the laser power supply and balance.
Note: The laser wavelength used in this experiment (λ = 532 nm) is chosen to match the LSPR absorbance peak as closely as possible. However, photothermal effects can be induced using any wavelength that overlaps with the absorbance of the nanoparticles. The heating efficiency is just greater when illuminated on resonance. - Position the balance windows so they do not obstruct the laser path or block the infrared (IR) thermocouples. The IR thermocouples are non-contact temperature probes and must have a clear line of sight to the measurement surface. Figure 1 shows a schematic of the experimental setup.
- Remove the protective covers from the IR thermocouples.
- Open the data collection software program and run, naming the measurement, "warmup." The custom software program collects the balance and thermocouple resistance values as a function of time, and when the program is running it logs these values into a data file.
- Run the measurement for at least 20 min to allow the system to warm up.
- While the system is warming up, prepare the sample by pipetting the appropriate amount (3 ml) of the desired solution into a methacrylate cuvette. The amounts used here are 3 ml of solution for standard cuvettes, and 1 ml for semi-micro cuvettes.
- Adjust the laser power to the lowest setting that produces a barely visible beam, which is 1.5 A for the laser system used here. Check to make sure that the laser beam spot is unobstructed and remains at the focal point of the IR thermocouple.
- Place the sample on the balance arm such that the side of the cuvette is perpendicular to the IR measurement beam of the thermocouple and the laser beam spot strikes the center of the solution.
- Reduce the laser power until the beam is no longer visible, but do not turn off the power supply.
- After 20 min the warm-up is complete. Stop the measurement program and exit out of the software.
- Re-zero the balance. Open the data collection software program, click run, and then create a name for the data file. The experiment will run after naming the file and clicking "Save." The exact experimental routine will depend on the information desired, but a model routine is provided here.
- Start the data collection. After 120 sec, turn up the laser power to desired setting (1.2 W for these experiments, which when focused into a ~20 µm spot corresponds with ~3.8 × 10⁵ W/cm2). Collect data for another 1,000 sec, then adjust laser power to the minimum setting and turn off laser power supply. Continue to collect data for another 1,000 sec before halting the measurement.
- After the experimental routine is complete, exit out of the program, turn everything off, and re-cover all equipment. Save the experimental data in an ASCII format and further process and analyze using additional software.
Results
Material composition is an important consideration for hybrid materials. Energy dispersive X-ray analysis (EDX) and Inductively Coupled Plasma Mass Spectrometry (ICP-MS) can provide this information. EDX analysis provides semi-quantitative data (Figure 2) while ICP-MS provides accurate, quantitative information regarding the elements of interest. It is found that the hybrid Fe2O3-Au nanoparticles have Fe and Au concentrations of ρFe = 150 ppb and ρAu = 49 ppb. In comparison, pure Au nanoparticles, which are used as a control for photothermal heating, have much higher Au concentrations of ρAu = 1,100 ppb.
SEM analysis reveals the morphology of the Fe2O3-Au nanoparticles (Figure 3), showing aggregates of rounded, irregular particles that appear functionalized with smaller, bright, and rounded nanoparticles. The larger nanoparticles are identified as Fe2O3, while the smaller, brighter nanoparticles are identified as Au. This type of morphology is often referred to as "decorated" nanoparticles.14 In this case, the surface of the supporting particle, Fe2O3, is adorned with smaller, isolated Au nanoparticles. Statistical analysis of the nanoparticles reveals that Fe2O3 nanoparticles have an average diameter of d = 40 ± 10 nm. The functionalizing Au nanoparticles have a wider range of sizes, with d = 20 ± 20 nm. Dynamic Light Scattering (DLS) measurements can quantify the aggregation behavior, and it is found that the hybrid Fe2O3-Au nanoparticles have an average hydrodynamic radius of dh = 243 nm with population bins at dh = 61 nm (13%) and dh = 310 nm (87%). Additionally, the zeta potential is found to ζ = -16 mV, which might help to limit the aggregation behavior.
The UV-vis-NIR spectrum of the hybrid Fe2O3-Au nanoparticles is shown in Figure 4A. A distinct absorbance peak is observed at wavelength λ ≈ 520 nm, and is attributed to the LSPR mode of the Au nanoparticles functionalizing the Fe2O3. The wavelength of the LSPR is consistent with literature values for AuNPs with similar morphologies.11,12 The plasmonic behavior of the hybrid structures is due to AuNP formation on the Fe2O3 supports. This can be directly observed by in-situ UV-vis spectroscopy. Figure 4B shows the UV-vis absorbance spectra of the reactant solution at various times during the reaction. Initially, there is some slight visible light absorbance attributed to the Fe2O3 nanoparticles dispersed in the solution. As the reaction proceeds, the absorbance increases, and at 1.5 min, a peak begins to form, which becomes better defined as the reaction goes on. This peak results from LSPR absorbance and corresponds with the formation of AuNPs and their deposition on the Fe2O3 support surface. The magnetic behavior of the Fe2O3-Au nanoparticles is readily observed through manipulation with an external magnetic field. Initially, the Fe2O3-Au solution has a brownish color (Figure 5B). However, after placing the solution in an external magnetic field, the solution gradually turns clear over several minutes as the entirety of the magnetic hybrid nanoparticles is collected by the field (Figure 5C). The magnetic collection is reversible, and the multifunctional nanoparticles can be re-dispersed by agitating the solution, as shown in Figures 5D and 5E.
Photothermal heating measurements are shown in Figure 6A, which plots the bulk temperature change in irradiated solution, ΔT, as a function of time for the hybrid Fe2O3-Au nanoparticles, AuNPs, and pure deionized water (DI H2O). The Fe2O3-Au and Au nanoparticles exhibit an almost identical temperature profile, with temperatures increasing by more than 40 °C. Clearly, the plasmonic absorbances of both nanoparticles types are able to transduce light into heat very efficiently, but the Fe2O3-Au do so with a considerably lower concentration of Au, as discussed above. On the other hand, the DI H2O experiment shows no change in temperature, which demonstrates that the temperature rise in the nanoparticle solutions is solely due to the dissipation of absorbed electromagnetic energy in the nanoparticles. ΔT in Figure 6A describes the bulk change temperature, and temperatures in the irradiated region and near the nanoparticle surfaces can be much higher.13 The change in the mass of the solution, Δm, that arises from steam generation is one indicator of these higher temperatures. Figure 6B plots Δm versus time for the hybrid Fe2O3-Au nanoparticles and for DI H2O. Δm for the nanoparticle solution is much greater than the background evaporation rate, indicating sufficiently high surface temperatures to generate steam at a significant rate.

Figure 1. Schematic of the laser heating setup. A cuvette is placed on a microgram scale and illuminated by a laser beam from above. Two IR thermocouples measure the temperature of the cuvette and ambient, respectively. All measurements are synchronized and logged in a data collection program. Please click here to view a larger version of this figure.
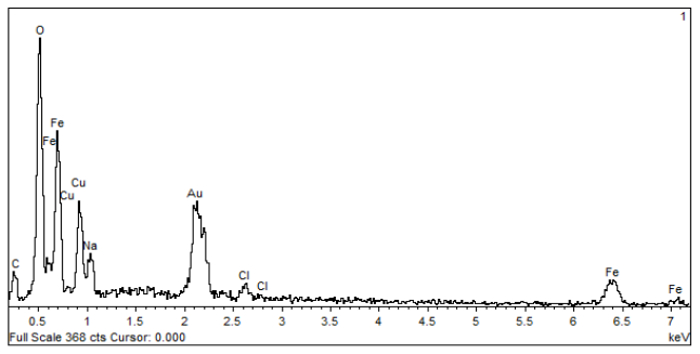
Figure 2. Representative EDX spectrum of the hybrid Fe2O3-Au nanoparticles. The abscissa axis corresponds with the energy and the ordinate axis corresponds with the number of counts. Peaks have been labeled with the corresponding element.Please click here to view a larger version of this figure.
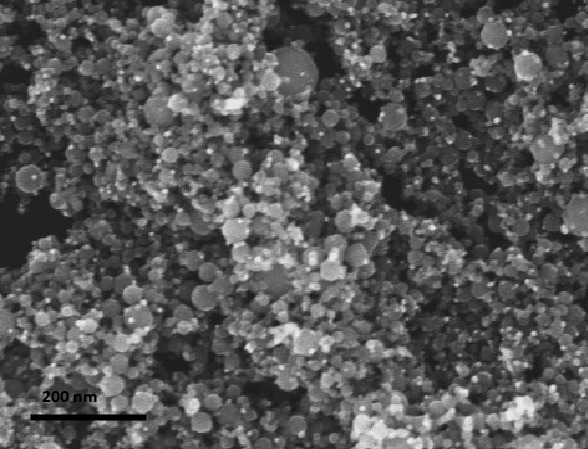
Figure 3. SEM image of the hybrid Fe2O3-Au nanoparticles. The larger, darker regions are Fe2O3 particles, which are decorated with smaller brighter Au nanoparticles. Please click here to view a larger version of this figure.

Figure 4. Optical properties. (A) UV-vis absorbance spectra of the hybrid Fe2O3-Au nanoparticles, showing the broad visible light absorbance of Fe2O3and the plasmonic peak attributed to the Au nanoparticles near 530 nm. (B) The UV-vis absorbance spectra of the reactant solution at various times during the reaction, showing the LSPR absorbance arising from AuNP formation in the solution and on the Fe2O3 nanoparticles. Please click here to view a larger version of this figure.
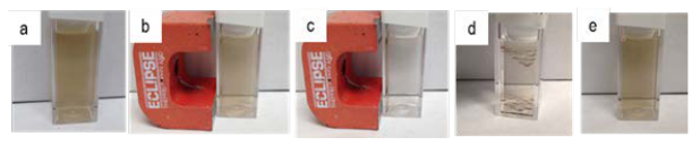
Figure 5. Magnetic Properties. Photographs of Au-Fe2O3 nanoparticles; (A) dispersed in aqueous solution; (B) magnetic manipulation (time = 0 sec); (C) magnetic manipulation (time = 2 min); (D) magnet removed; (E) Au-Fe2O3 nanoparticles following magnetic manipulation, showing that they can be easily re-dispersed in the aqueous solution. Please click here to view a larger version of this figure.
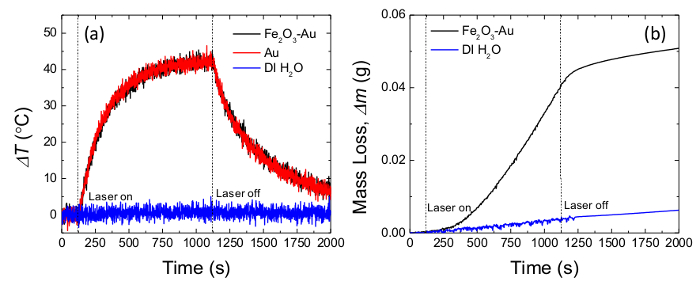
Figure 6. Photothermal experiments. Plots showing the (A) change in solution temperature, ΔT, and (B) mass loss, Δm, as functions of time. Under laser illumination, the nanoparticles (black and red curves) generate sizeable ΔT and Δm values that are significantly larger than those occurring for pure DI H2O under identical conditions (blue curve). Please click here to view a larger version of this figure.
Discussion
The use of optically tunable gold nanoparticles for hyperthermia studies is an attractive option as it capitalizes on plasmonic heating of gold nanoparticles tuned to absorb light strongly in the VIS-NIR region. The plasmonic heating studies described here were examined by using laboratory prepared and commercially available iron oxide-gold hybrid nanomaterials. One of the most widely used methods for manufacturing colloidal gold nanospherical particles involves the reduction of chloroauric acid (HAuCl4) to neutral gold Au(0) by reducing agents, such as sodium citrate, sodium borohydride, etc.15,16 The synthesis of the gold nanoparticles on iron oxide nanoparticles is straightforward. One could easily control the Au metal size, shape, and loading by changing experimental parameters, e.g., reactants concentrations, reducing agents, surfactants, etc.17 This approach yields good control over Au nanoparticle dimensions and uniform nanoparticle loading onto Fe2O3. Other noble metals can also be prepared by this procedure, including Ag, Pt, and Pd.18 A distinct advantage of this procedure is that the reaction procedure can be done in air or water, and, in principle, is amenable to scaling up. Using commercial nanomaterials and/or scalable-wet chemical procedures is ideal for large-scale treatment applications or biological applications because these materials are readily available and more economical than custom synthesized materials and procedures. Surface modifications of these metallic nanostructures are also of interest in the scientific community. A number of organic (surfactants, bifunctional thiols, polymers, amino acids, proteins, DNA) and inorganic materials (silica, other metals, metal oxides, etc.)19 can be further loaded or functionalized onto these surfaces to create nanocomposite materials with various designs, geometries, compositions and multifunctional capabilities, for biological targeting, drug delivery, sensing, imaging, environmental applications, etc.
Additionally, the photothermal technique described here is well-suited to characterize the plasmonic properties of different materials, as bulk temperature and mass measurements are relatively easy to perform using readily available equipment. The ease of sample preparation and measurement is a distinct advantage over other plasmonic techniques/applications. For example, techniques such as surface-enhanced Raman spectroscopy and LSPR sensing are highly sensitive to the preparation of both the substrate and the target,20,21 which makes repeatability and comparison across samples more challenging. One possible drawback to the photothermal measurements described above is that temperature is measured on the bulk scale and not on the surface of the nanoparticle where the heat is transduced. There are thermometry techniques that can provide this local temperature information,22-24 but these require more complicated sample preparation, making them more challenging to implement. Finally, the measurements described here could easily be combined with other techniques (e.g., photocatalytic degradation)9 to assess photothermal effects on different processes.
In summary, we have described the synthesis of hybrid Fe2O3-Au nanoparticles solutions and their photothermal characterization. Even with a 20× smaller concentration of Au, these Fe2O3-Au nanoparticles are able to photothermally heat aqueous solutions as efficiently as AuNPs, demonstrating the advantages of hybrid materials. Furthermore, the hybrid structures retain the properties of both materials, creating a multifunctional structure with magnetic and plasmonic properties. Such structures are interesting for biomedical applications,8 but many additional uses can be envisioned.
Disclosures
The authors have nothing to disclose.
Acknowledgements
The financial support of this work was provided by Department of Energy DOE- Laboratory Directed Research & Development (LDRD) Strategic Initiative Program. We thank Mr. Henry Sessions, and Mr. Charles Shick for providing their time and expertise to assist us with our experiments.
Materials
| Name | Company | Catalog Number | Comments |
|---|---|---|---|
| Gold(III) chloride trihydrate | Sigma-Aldrich | 520918 | ≥99.9% trace metals basis |
| Iron(III) oxide | Sigma-Aldrich | 544884 | nanopowder, <50 nm particle size (BET) |
| Sodium citrate tribasic dihydrate | Sigma-Aldrich | S4641 | ACS reagent, ≥99.0% |
| SEM | Hitachi | S8200 | |
| TEM | Hitachi | H95000 | |
| EDX | Oxford Instruments | SDD - X-Max | |
| DLS | Brookhaven Instruments | NanoBrook Omni | |
| ICP-MS | Agilent | 7500s | |
| UV-Vis-NIR spectrometer | Tec5 MultiSpec | ||
| Laser, λ = 532 nm | Del Mar Photonics | DMPV-532-1 | |
| Microgram Balance | Mettler Toledo | XP205 | |
| Infrared Thermocouples | Omega Engineering | OS801-HT |
References
- Barber, D., Freestone, I. An investigation of the origin of the colour of the Lycurgus Cup by analytical transmission electron microscopy. Archaeometry. 32 (1), 33-45 (1990).
- Ozbay, E. Plasmonics: merging photonics and electronics at nanoscale dimensions. Science. 311 (5758), 189-193 (2006).
- Murphy, C. J., et al. Anisotropic metal nanoparticles: synthesis, assembly, and optical applications. J. Phys. Chem. B. 109 (29), 13857-13870 (2005).
- Luo, Y. L., Shiao, Y. S., Huang, Y. F. Release of photoactivatable drugs from plasmonic nanoparticles for targeted cancer therapy. ACS Nano. 5 (10), 7796-7804 (2011).
- Murph, S. E. H., et al. Manganese-gold nanoparticles as an MRI positive contrast agent in mesenchymal stem cell labeling. J. Nanopart. Res. 14 (4), 1-13 (2012).
- Maier, S. A. Plasmonics: fundamentals and applications: fundamentals and applications. , Springer Science & Business Media. (2007).
- Bigall, N. C., Parak, W. J., Dorfs, D. Fluorescent magnetic and plasmonic-Hybrid multifunctional colloidal nano objects. Nano Today. 7 (4), 282-296 (2012).
- Larson, T. A., Bankson, J., Aaron, J., Sokolov, K. Hybrid plasmonic magnetic nanoparticles as molecular specific agents for MRI/optical imaging and photothermal therapy of cancer cells. Nanotechnology. 18 (32), 325101(2007).
- Hung, W. H., Aykol, M., Valley, D., Hou, W., Cronin, S. B. Plasmon resonant enhancement of carbon monoxide catalysis. Nano Lett. 10 (4), 1314-1318 (2010).
- Neumann, O., et al. Solar vapor generation enabled by nanoparticles. Acs Nano. 7 (1), 42-49 (2012).
- Szirmae, A., Fisher, R. Techniques of Electron Microscopy, Diffraction, and Microprobe Analysis. 372, ASTM Spec. Tech. Publ. (1963).
- Goldstein, J., et al. Scanning electron microscopy and X-ray microanalysis: a text for biologists, materials scientists, and geologists. , Springer Science & Business Media. (2012).
- Kennedy, J. F., Xu, L. Practical guide to ICP-MS, Robert Thomas. Marcel Dekker, INC, New York, USA (2004). Carbohydr. Polym. 62 (4), 393(2005).
- Georgakilas, V., et al. Decorating carbon nanotubes with metal or semiconductor nanoparticles. J. Mater. Chem. 17 (26), 2679-2694 (2007).
- Murph, S. E. H., et al. Tuning of size and shape of Au-Pt nanocatalysts for direct methanol fuel cells. J. Nanopart. Res. 13 (12), 6347-6364 (2011).
- Unrine, J. M., et al. Evidence for bioavailability of Au nanoparticles from soil and biodistribution within earthworms (Eisenia fetida). Environ. Sci. Technol. 44 (21), 8308-8313 (2010).
- Hunyadi Murph, S. E., et al. ACS Symp. Ser. , Oxford University Press. 127-163 (2011).
- Murph, S., Murphy, C. J., Leach, A., Gall, K. A Possible Oriented Attachment Growth Mechanism for Silver Nanowire Formation. Cryst Growth Des. , (2015).
- Hunyadi Murph, S. E., Heroux, K., Turick, C., Thomas, D. Applications of Nanomaterials. Vol. 4 Nanomaterials and Nanostructures, Studium Press LLC. (2012).
- Murphy, C. J., et al. Chemical sensing and imaging with metallic nanorods. Chem. Comm. (5), 544-557 (2008).
- Shanmukh, S., et al. Rapid and sensitive detection of respiratory virus molecular signatures using a silver nanorod array SERS substrate. Nano Lett. 6 (11), 2630-2636 (2006).
- Jaque, D., Vetrone, F. Luminescence nanothermometry. Nanoscale. 4 (15), 4301-4326 (2012).
- Ebrahimi, S., Akhlaghi, Y., Kompany-Zareh, M., Rinnan, Å Nucleic acid based fluorescent nanothermometers. ACS Nano. 8 (10), 10372-10382 (2014).
- Dias, J. T., et al. DNA as a molecular local thermal probe for the analysis of magnetic hyperthermia. Angew. Chem. 125 (44), 11740-11743 (2013).
Reprints and Permissions
