The presence of cancer stem cells (CSCs) in bone sarcomas has recently been linked to their pathogenesis. In this article, we present the isolation of CSCs from primary cell cultures obtained from human biopsies of conventional osteosarcoma (OS) using the ability of CSCs to grow under nonadherent conditions.
Method Article
Establishment of Cancer Stem Cell Cultures from Human Conventional Osteosarcoma
In This Article
Summary
Abstract
The current improvements in therapy against osteosarcoma (OS) have prolonged the lives of cancer patients, but the survival rate of five years remains poor when metastasis has occurred. The Cancer Stem Cell (CSC) theory holds that there is a subset of tumor cells within the tumor that have stem-like characteristics, including the capacity to maintain the tumor and to resist multidrug chemotherapy. Therefore, a better understanding of OS biology and pathogenesis is needed in order to advance the development of targeted therapies to eradicate this particular subset and to reduce morbidity and mortality among patients. Isolating CSCs, establishing cell cultures of CSCs, and studying their biology are important steps to improving our understanding of OS biology and pathogenesis. The establishment of human-derived OS-CSCs from biopsies of OS has been made possible using several methods, including the capacity to create 3-dimensional stem cell cultures under nonadherent conditions. Under these conditions, CSCs are able to create spherical floating colonies formed by daughter stem cells; these colonies are termed "cellular spheres". Here, we describe a method to establish CSC cultures from primary cell cultures of conventional OS obtained from OS biopsies. We clearly describe the several passages required to isolate and characterize CSCs.
Introduction
Sarcomas are a heterogeneous group of rare malignant connective tissue tumors originating predominantly from the embryonic mesoderm1. The different types include bone sarcomas and soft tissue sarcomas. Bone sarcomas, a group of relatively uncommon primary tumors, consist of several subtypes, including osteosarcoma (OS). OS, one of the most common primary tumors of the bone, is a mesenchymal malignancy that exhibits extensive clinical, histological, and molecular heterogeneities2, 3. Unfortunately, OS occurs predominantly in children and in young adults4, 5 and represents 60% of the common histologic subtypes of bone sarcoma in childhood6, 7. OS usually affects the skeletal areas, which are characterized by rapid bone growth (e.g., the metaphysis of long bones). Among the histologically different subtypes of OS, conventional OS, also called medullary or central OS, has a high grade of malignancy and a quota share of 80%8. This 80% is composed of 60% conventional osteoblastic OS, 10% chondroblastic OS, and 10% fibroblastic OS6, 8-10. Other OS subtypes include anaplastic, telangiectatic, giant cell-rich and small cell OS. Despite advances in combined surgery and chemotherapy in OS management, the outcome remains poor, with a long-term survival rate of 65-70% in patients without metastasis11, 12. Distant recurrences frequently occur as pulmonary metastases or, less frequently, as metastases to distant bones and local recurrences13. Metastases are often resistant to conventional treatments. This resistance is the reason why the 10-year disease-free survival is approximately 30% in patients with metastatic disease at diagnosis14, 15.
As with normal tissue, cancer tissue is composed of a heterogeneous collection of cell types. Cells within the tumor seem to correspond to different stages of development. Within any normal tissue resides a subpopulation of cells with the ability to selfrenew, thus providing progenitors and mature cells for tissue homeostasis. Similarly, cancer is composed of a similar heterogeneous population of cells at different stages of development, with different degrees of proliferation and tumorigenic potential. A subset of these cancer cells, termed Cancer stem Cells (CSCs), constitutes a reservoir of selfsustaining cells with the exclusive ability to selfrenew and maintain the malignant potential of tumors, thus generating the different cell lineages that constitute the tumor bulk16. In the 1990s, studies on acute myeloid leukaemia provided the first compelling evidence for the existence of CSC subpopulations17, 18. CSCs have since been isolated from a great number of solid tumors19, thereby becoming one of the most researched topics in cancer research. CSCs may indeed arise from normal stem cells by mutations in genes that make the normal stem cells cancerous20-23. Multiple transforming mutations and interactions with the microenvironment could also contribute to healthy progenitors and mature cells acquiring the selfrenewal capacity and immortality that typify CSCs. There are several hypotheses about this transformation. Healthy progenitors, healthy mature cells, and cancer cells, can dedifferentiate to stem cells, obtaining a stem-like phenotype by activating selfrenewal-associated genes24-28. Despite several recent studies, the origins of CSCs have yet to be discovered.
A particular characteristic of CSCs is that their capacity to resist the multi-therapy approach, which consists of combined surgery and chemotherapy with different drugs. Recent studies have shown that CSCs may also acquire resistance to cytotoxic chemotherapy agents. Possible explanations for this resistance include the overexpression of ATP-binding cassette (ABC) multidrug transporter (i.e., MDR1 and BCRP1), overexpression of chemotherapy metabolizing enzymes such as aldehyde dehydrogenase 1 (ALDH1), and/or changes in cell cycle kinetics30-33. The direct consequence of all these concepts that have been described thus far is that a cancer therapy would be efficient only if the CSC subpopulation were completely eliminated, while local recurrence or distant metastasis could occur if even a single CSC survived.
The discovery of CSCs in human sarcomas34, particularly OS35, or in any other bone and soft tissue cancers, has great clinical importance because it offers a possible explanation as to why many treatments seem to be effective initially, but the patients later relapse. Therefore, the hope for the future battle against conventional OS is to find new and specific targeted therapies based on the development of innovative drugs directed at OS-CSCs thanks to the molecular characterization of this subpopulation and to the study of CSC biology.
In 1992, Reynolds and colleagues, who were investigating whether a subset of stem cells was present in the adult mammalian brain, developed a method to isolate cells suspected to be stem-like cells36, 37. This method is based on the particular ability of these cells to form spherical colonies when grown under nonadherent conditions. Similar techniques were employed by Gibbs and colleagues in 2005 to study a subpopulation of stem-like cells in bone sarcomas38. To isolate and characterize OS-CSCs from primary cell cultures of different types of conventional OS, we decided to adapt this technique for OS cell lines.
Here, we describe this adapted method of the sphere formation assay, termed "sarcosphere assay", which can be used to isolate OS-CSCs from finite primary cell lines derived from human biopsies of conventional OS. We also describe all the techniques used to validate the stem-like CSC phenotype of the cell lines isolated by this assay: 1) evaluation of the expression of genes that characterize pluripotent Embryonic Stem Cells (ESCs) and of the CD133 gene, which is a marker of CSCs; 2) colony-forming unit (CFU) assay; 3) evaluation of the ability of these cells to differentiate into osteoblasts and adipocytes under appropriate differentiation conditions; 4) study of the surface markers of Mesenchymal Stem Cells (MSCs) (i.e., CD44, CD105 and Stro-1) by immunofluorescence staining and by flow cytometric analysis; 5) evaluation of the ALDH activity of these cells.
Protocol
All experimentation using human tissues described herein was approved by the local ethical committee (Rif. N. 141/12). Informed consent for the collection of tissue samples and for the use and storage of the samples was obtained from the donors at AOUC.
1. Preparation for Culture
- Prepare growth culture medium (GM) by adding 10% Foetal Bovine Serum (FBS), 100 IU/ml penicillin and 100 µg/ml streptomycin to Coon's modified Ham's F12 medium. Filter and sterilize GM using a 0.22 µm filter. Store GM up to 1 month at 4 °C.
- Prepare collagenase medium (CM) by adding 20% FBS, 100 IU/ml penicillin, 100 µg/ml streptomycin and 3 mg/ml collagenase type II to Coon's modified Ham's F12 medium. Filter and sterilize CM using a 0.22 µm filter. Store CM up to 1 month at -20 °C.
- Prepare medium for cell freezing (FM) by adding 40% FBS, 100 IU/ml penicillin, 100 µg/ml streptomycin and 6.5% dimethylsulfoxide (DMSO) to Coon's modified Ham's F12 medium. Filter and sterilize FM using a 0.22 µm filter. Store FM up to 1 month at 4 °C.
- Prepare medium for CFU assay (CFUM) by adding 20% FBS, 100 IU/ml penicillin and 100 µg/ml streptomycin to Coon's modified Ham's F12 medium. Filter and sterilize CFUM using a 0.22 µm filter. Store CFUM up to 1 month at 4 °C.
- Prepare trypsin by dissolving 400 mg trypsin, 200 mg EDTA and 1,000 mg D(+)-glucose anhydrous in 1,000 ml Dulbecco's Phosphate-Buffered Saline (DPBS) without Ca2+ and Mg2+.
NOTE: Divide fresh trypsin-EDTA into 50 ml aliquots in 25 cm2 flasks using a 0.22 µm filter and freeze at -20 °C for up to 3 months. Store thawed filter-sterilized aliquots at 4 °C without loss of activity. - Prepare stem cell growth medium (SCGM) by adding 10% FBS, 100 IU/ml penicillin, 100 µg/ml streptomycin, and 10 ng/ml bFGF (25 µg/ml stock) to Coon's modified Ham's F12 medium. Filter SCGM using a 0.22 µm filter and store SCGM up to 2 weeks at 4 °C.
- Prepare 2% methylcellulose (MC) by dissolving MC in ultrapure H2O at 4 °C for 3 d. When MC is completely dissolved, autoclave it and store at 4 °C.
NOTE: After MC is sterilized, it becomes solid. To bring MC to a liquid state, store at 4 °C. - Prepare sarcosphere growth medium (SGM). Prepare this medium fresh (not more than 2 weeks before use) by adding 100 IU/ml penicillin, 100 µg/ml human bFGF (25 µg/ml stock), 20 nM progesterone (10 µM stock), 100 µM putrescine, 30 nM sodium selenite (30 µM stock), 25 µg/ml transferrin (25 mg/ml stock), 20 µg/ml insulin (20 mg/ml stock), and 10 ng/mL human EGF (10 µg/mL stock) to 2X Coon's modified Ham's F12 medium. Filter and sterilize SGM using a 0.22 µm filter. Store for up to 2 weeks at 4 °C.
- Prepare osteogenic medium (OM) by adding 10% FBS (South American origin), 100 IU/ml penicillin, 100 µg/ml streptomycin, 10 nM dexamethasone (100 µM stock), 0.2 mM sodium L-ascorbyl-2-phosphate (1 M stock), 10 mM β-glycerophosphate (5 mg/ml stock) and 1 µg/ml calcein (200 µg/ml stock) to Coon's modified Ham's F12 medium. Filter and sterilize OM using a 0.22 µm filter. Store at 4 °C.
NOTE: Store dexamethasone stock solutions under liquid nitrogen to maintain their activity. Prepare fresh OM every 2 weeks to maintain the activity of dexamethasone in order to maintain the differentiation potential of the medium. - Prepare erythrocyte lysis buffer (ELB) by dissolving 1.66 mg NH4Cl, 0.2 mg K2HPO4 and 0.007 mg EDTA in 200 ml distilled water (dH2O). Filter and sterilize ELB using a 0.22 µm filter. Store at 4 °C.
- Prepare adipogenic medium (AM) by adding 10% FBS (South America origin), 100 IU/ml penicillin, 100 µg/ml streptomycin, 1 µM dexamethasone (1 mM stock), 1 µM bovine insulin (10 mM stock), 0.5 mM isobutylmethylxanthine (IBMX) (500 mM stock), and 100 µM indomethacin (200 mM) to Coon's modified Ham's F12 medium. Filter and sterilize AM using a 0.22 µm filter. Store at 4 °C.
NOTE: Store dexamethasone stock solutions under liquid nitrogen to maintain their activity. Prepare fresh AM every 2 weeks to maintain the activity of dexamethasone in order to maintain the differentiation potential of the medium. - Prepare 2% Bovine Serum Albumin (BSA) in DPBS (BSA/DPBS). Dissolve 10 g BSA in 500 ml DPBS and prepare the stock solution by aliquotting 50 ml stock solution in 50 ml conical tubes. Store at -20 °C.
- Prepare a solution of 4% paraformaldehyde (PFA) in DPBS (PFA/DPBS). In a chemical hood, dilute paraformaldehyde in DPBS and prepare the stock solution by aliquotting 50 ml stock solution in 50 ml conical tubes. Store at 4 °C.
2. Establishing Primary OS Cell Cultures and OS Finite Cell Lines (OSA)
NOTE: Primary OS cell cultures were prepared from fresh samples of conventional OS biopsies collected at the "Unità Ortopedia Oncologica e Ricostruttiva", AOUC Careggi, Florence. All biopsies, which were obtained by needle aspiration or surgical resection of a small portion of the tumor (Figure 1A, B), were immediately placed in culture medium supplemented with 100 IU/ml penicillin and 100 µg/ml streptomycin (pH 7.4) and transported to the laboratory where they were processed. All described manipulations were conducted under aseptic conditions using a laminar flow hood.
- Isolation of OS cells
- Place the biopsy in a 100 mm Petri dish with a small volume of GM. With a sterile lancet and Perry tweezers, mince the OS tissue samples by cutting them into pieces as small as possible (0.5 - 1 mm) (Figure 2A, B) .
- Cover the tissue fragments with 10 ml CM for the enzymatic digestion (Figure 2B) and incubate for 3 h in a 37 °C, 5% CO2 incubator. Gently remove the suspension of fragments using a pipette and transfer it to a 15 ml conical tube for immediate centrifugation (400 x g for 5 min) to pellet the fragments.
NOTE: After centrifugation, if the biopsies are rich in erythrocytes, a red deposit composed of erythrocytes can be seen over the fragments. Therefore, before proceeding to mechanical dispersion, treat the sample with erythrocyte lysis buffer. Discard the supernatant by aspiration and add 5 ml ELB. - Suspend pellet fragments for 1 min and centrifuge the suspension at 400 x g for 2 min. Remove the supernatant by aspiration. Add 5 ml GM and mechanically disperse the fragments using a 10 ml serological pipette (opening size, 1.5 mm internal Ø) 10 - 20 times.
- Centrifuge the suspension at 400 x g for 5 min. Remove the supernatant by aspiration, suspend the cell pellet with 10 ml GM, and then transfer the resulting cell suspension into a 100 mm Petri dish. Incubate the Petri dish in a 37 °C, 5% CO2 incubator and replace the GM with fresh complete GM every 3 d.
NOTE: Quite often, OS tissue samples obtained by needle aspiration are very small and contain bone fragments, which are not digested by enzymatic digestion with collagenase. Therefore, after the supernatant has been removed, attempt to separate cells from bone tissue by mashing pellet fragments with a pipette.
- Subculture
NOTE: To establish an OSA, when cells reach approximate confluence, remove them from their culture vessel, dilute, and place in a fresh plate to enable further growth. This subculture procedure is achieved using the enzymatic procedure termed trypsinization.- Remove the medium by aspiration. To dissociate the cell monolayer, add 2 - 3 ml trypsin at RT (max 18 - 20 °C), shake gently once, and remove the trypsin immediately by aspiration. Repeat twice. Incubate the cells at 37 °C for 3 - 4 min until they begin to detach.
NOTE: Good trypsinization can be seen by the experienced user as small holes forming in the slightly opaque monolayer when the dish is held to the light. This dissociation can also be monitored using an inverted microscope; this approach is recommended for beginners. - Stop the trypsin reaction by adding 10 ml GM and wash the dish well using a pipette to detach all the cells. Transfer 1 ml of the suspension to a new 100 mm Petri dish and add 9 ml GM (1/10 split of cells).
NOTE: The remaining cell suspension can be used for cell expansion (transfer to another 100 mm Petri dish), can be cryopreserved (see Section 2.3), or can be counted and plated in experimental dishes or wells for proliferation assays or other purposes (see below).
- Remove the medium by aspiration. To dissociate the cell monolayer, add 2 - 3 ml trypsin at RT (max 18 - 20 °C), shake gently once, and remove the trypsin immediately by aspiration. Repeat twice. Incubate the cells at 37 °C for 3 - 4 min until they begin to detach.
- Cryopreservation of OS primary cultures and OSA
NOTE: Freeze one confluent 100 mm Petri dish into 4-5 cryovials. The process of cryopreservation must be performed quickly because DMSO, which protects cell membranes during freezing, is toxic to cells at non-freezing temperatures.- Dissociate cell cultures from the monolayer by trypsinization (see Section 2.2), pellet cells by centrifugation at 400 x g for 5 min, remove the supernatant by aspiration, and then quickly suspend the cell pellet in FM.
- Aliquot 1 ml of this suspension per cryogenic vial. Immediately place the filled vials in a freezer box with a jacket of 2-propanol and store immediately at -80 °C O/N. Transfer cryovials to liquid nitrogen the following day for long-term storage.
- Defrost OS cell lines and primary cultures
- Defrost OS cell lines from liquid nitrogen storage, thawing cryovials rapidly by placing them in a laboratory water bath at 37 °C. Transfer the contents of the cryovials into a 15 ml conical tube and add approximately 10 ml of GM (See Section 2.3 to remove DMSO). Remove the supernatant by aspiration and suspend the cell pellet in 10 ml GM. Plate the cell suspension in a 100 mm Petri dish and incubate in a 37 °C, 5% CO2 incubator.
3. Sarcosphere Assay to Isolate OS-CSCs
NOTE: This experiment is performed on OSA. The duration of this experiment is related to the capacity of the cells to form these sphere colonies (sarcospheres), and the range of time is 7, 14, 21, and 28 d.
- Establishment of sarcosphere assay
- Prepare the haemocytometer chamber and all reagents in advance.
- Remove the medium by aspiration and dissociate the cells from the monolayer by trypsinization (see Section 2.2). Mix the cell suspension thoroughly, pipetting to disperse any clumps, and collect 10 µL using a 20 µL pipette tip.
- Transfer the 10 µL cell suspension immediately to the haemocytometer chamber edge, expel the suspension, and allow it to be drawn under the coverslip by capillary action.
- Observe the haemocytometer chamber under phase contrast. Select a 10X objective and focus on the grid lines in the chamber. Count the cells lying in this 1 mm2 area using the subdivisions (also bound by three parallel lines) and single grid lines as an aid for counting.
- Measure the concentration and apply the following equation: 1 ml = n*104/z (n: the whole number of cells in all the counted squares 1 mm2; z: the number of counted squares 1 mm2). Calculate the volume of the cell suspension necessary to plate a total amount of 240,000 cells divided into 40,000 cells for each well in the 6-well ultra-low attachment plate.
NOTE: Be sure to plate the correct number of cells by plating cells into one extra well. Therefore, the total amount of cells to be plated is 280,000 cells. - Prepare 35 ml SGM by adding 50% of 2% MC (SGM-MC) in a 25 cm2 flask. Prepare the total volume of SGM considering 5 ml extra in order to plate one extra well.
- Add the calculated volume of the cell suspension to the SGM-MC prepared in the flask and mix gently using a pipette to disperse any clumps. Plate the cells in a 6-well ultra-low attachment plate and use an inverted microscope to observe how the cells appear after being plated.
- Incubate the cells in a 37 °C, 5% CO2 incubator. Every 3 d, add fresh aliquots of bFGF and EGF to each well to refresh the concentration of the growth factors. Add 2 µL bFGF and 5 µL EGF to maintain both at the final concentration of 10 ng/ml in each well.
- Isolation of sarcospheres
NOTE: Monitor the good progress of the sarcosphere assay at 7, 14, 21, and 28 d to decide when it is necessary to isolate the sarcospheres that formed.- Prepare all the reagents and equipment in the laminar flow hood (Figure 3A, B). Assemble the filtration unit by placing a net filter of 25 mm diameter and a 40 µm mesh into a membrane filter holder; sterilize by autoclaving (Figure 4A-E).
- For each well, transfer the medium containing the sarcospheres to a syringe with a sterile membrane filter holder using a sterile pipette with a 1,000 µL tip. After completely removing the medium containing the sarcospheres, wash the well by adding 5 ml GM to be sure to transfer all the spheres to a syringe. Use the microscope to confirm whether all the sarcospheres have been recovered. If not, proceed by repeating this step .
- Filter the suspension with a membrane filter holder only by gravity without pressure in order to prevent damaging the spheres and to avoid having sarcospheres crossing through the filter, thereby avoiding the loss of spheres. Remove air bubbles by gently using a sterile glass Pasteur pipette.
NOTE: Sometimes the filtration is blocked by the presence of an air bubble in the membrane filter holder. - Wash the filtration unit by adding 10 ml GM to the syringe and letting it filter without pressure to be sure to eliminate the single cells. Take apart the filter unit from the syringe and put it into a Petri dish.
- Remove the net filter from the membrane filter holder using Perry tweezers and wash it by shaking it gently with the tweezers in a 60 mm Petri dish to release the sarcospheres from the tangle of the membrane. Then, place the membrane in a well and confirm by microscopic observation that there are no more spheres tangled in the membrane. If spheres are still tangled in the membrane, proceed with another wash as described in step 3.2.4.
- Observe the released sarcospheres using a microscope. Incubate the released sarcospheres in a 37 °C, 5% CO2 incubator. Repeat all steps for each well of a 6-well ultra-low attachment plate.
4. OS-CSC Lines
NOTE: OS-CSCs are obtained from the sarcospheres that exhibit adherent expansion by reintroducing and reculturing these cells in a monolayer after they are plated in small 60 mm Petri dishes no longer under ultra-low attachment conditions.
- OS-CSC cultures
- To enable further growth, subculture cells when they reach approximately 90% confluence in a 60 mm Petri dish. Repeat step 2.2.1 to establish OS-CSC cultures.
- Stop trypsinization by adding 4 ml SCGM and wash the dish well, using a pipette to detach all the cells. Transfer the cell suspension to a new 100 mm Petri dish and add 6 ml SCGM. When OS-CSCs reach 90% confluence, subculture by repeating section 2.2.
NOTE: For in vitro analysis to characterize the stem cell-like phenotype of isolated OS-CSCs, cells can be plated in different types of plates. - Preserve the established OS-CSC lines by cryopreservation (repeat all steps of section 2.3). Defrost the cryopreserved OS-CSCs by repeating all steps of section 2.4.
5. In vitro Analysis to Characterize OS-CSCs:
- Preparation of cells for immunofluorescence
NOTE: Cells are fixed in paraformaldehyde when they reach the right grade of confluence in each well of a 24-well plate. The grade of confluence is related to the type of experiments.- Plate OS-CSCs in a 24-well plate to study the surface Mesenchymal Stem Cells (MSC) markers by immunofluorescence. Fix cells in each well when they reach 50 - 60% confluence. Remove the SCGM by aspiration and wash twice in a DPBS 24-well plate.
- Under a chemical hood, add 500 µL 4% PFA/DPBS to each well. Incubate at RT for 10 min. Remove the PFA/DPBS and wash 3x with ultrapure dH2O. Allow the 24-well plate to dry in the fume hood.
- Immunofluorescence for MSC markers
NOTE: Immunofluorescence staining of the OS-CSCs fixed in 4% PFA/DPBS can be used to investigate the MSC-like phenotype of OS-CSCs using antibodies directed against CD44, Stro-1 and CD105. The following method is used routinely by the authors.- In a chemical hood, permeabilize cells that have been fixed in 4% PFA/DPBS by adding 500 µL 0.2% Triton X-100/DPBS to each well. Incubate the cells at 37°C for 30 min. Gently wash the cells 3x with DPBS. Add 300 µL RNase diluted 1/1,000 with 2% BSA/DPBS to the cells and incubate at 37 °C for 30 min.
- Gently wash the cells 3x with 2% BSA/DPBS. Stain the cells for MSC markers. Add the primary antibody only to the wells chosen as positive controls for each antibody.
- Add 300 µL anti-CD105 diluted 1/10 with 2% BSA/DPBS, 300 µL anti-CD44 diluted 1/10 with 2% BSA/DPBS, 300 µL anti-Stro-1 diluted 1/10 with 2% BSA/DPBS and only 200 µL 2% BSA/DPBS to the wells chosen as negative controls for each antibody.
- Incubate the cells in a humid environment at 4 °C O/N. Wash the wells 3x with DPBS and then twice with 2% BSA/DPBS.
- Reveal primary antibodies by adding specific secondary antibodies.
- Add 300 µL anti-rabbit IgG (donkey anti-rabbit IgG [H + L]) diluted 1/100 with 2% BSA/DPBS into each well chosen as positive and negative control for CD44 and CD105. Add 300 µL FITC anti-mouse IG (FITC-rabbit anti-mouse IgG [H + L]) diluted 1/100 with 2% BSA/DPBS into each well chosen as positive and negative control for Stro-1. Incubate cells in the dark at RT for 60 min. Wash the wells 6x with DPBS.
- Stain MSC marker-positive cells for cytoskeletal actin by adding 300 µL phalloidin diluted 1/100 with 2% BSA/DPBS into each well stained for MSC marker immunofluorescence.
- Incubate the cells for 40 min at RT. Wash the wells 3x with DPBS and then wash them twice with ultrapure dH2O. Proceed to the counterstaining of the nuclei after the immunofluorescence staining described above. Prepare propidium iodide solution 10-5 M in DPBS (stock 1.5 x 10⁻³ M) in a fume hood.
- Add 200 µL propidium iodide solution to each well colored as described above. Incubate the cells for 2 - 3 min at RT. Wash the wells twice with ultrapure dH2O.
NOTE: Repeat all the steps of sections 5.1 - 5.2 on the cell line HCT8, a primary continuous differentiated colon cancer cell line that is used as a negative control.
- Add 200 µL propidium iodide solution to each well colored as described above. Incubate the cells for 2 - 3 min at RT. Wash the wells twice with ultrapure dH2O.
- Osteogenic differentiation assay
NOTE: Osteogenic differentiation lasts for 20 d.- Plate OS-CSCs in 24-well plates at a cell density of 1 x 10⁴ cells/cm2 in SCCGM. Allow the cells to grow in SCGM until they reach 80 - 90% confluency in each well.
- Start osteogenic differentiation by changing the SCGM to OM. Allow the cells to grow in OM and refresh medium every 3 - 4 d. Stop the osteogenic differentiation assay at 10 d to evaluate the presence of alkaline phosphatase (ALP).
- Fix cells in 4% PFA/DPBS (See section 5.1). Evaluate the osteoblastic phenotype by cytochemical staining for ALP and for HA using Alizarin Red S staining.
- ALP cytochemical staining
NOTE: Prepare the dye mixture in a chemical hood immediately before starting the staining.- Dissolve 40 mg Fast Blue BB or Fast Red Violet LB salt in 50 ml Tris-HCl, pH 9 (Solution A). Dissolve 5 mg naphthol-AS-MX phosphate sodium salt in 1 ml DMSO (Solution B). Add Solution B entirely to Solution A and mix well, obtaining Solution C. Wash cells twice with DPBS.
- Add 500 µL - 1 ml Solution C to each well and incubate at 37 °C and 5% CO2. Monitor the course of staining every 10 min by observing the cells under the microscope.
- Stop the staining when ALP-positive cells become intensely colored (blue with the Fast Blue BB salt or red with Fast Red Violet LB salt), which usually occurs within 30 min. Wash the cells 3x with ultrapure dH2O to remove all residues of Solution C. If a precipitate of the stain is present, wash the cells quickly once with absolute ethanol.
- Proceed to the counterstaining of the nuclei after the ALP staining as described in the steps 5.2.5 and 5.2.5.1.
- Alizarin Red S cytochemical staining
NOTE: Prepare the dye mixture before starting the experiment.- Prepare the 2% Alizarin Red S (2 g Alizarin Red S in 100 ml of ultrapure H2O). Add 2.5% NH3 to 2% Alizarin Red S to reach pH 6.0. Store 2% Alizarin Red S solution at 4 °C. Wash the cells once with DPBS.
- Add Alizarin Red S to the cells for only a few sec.
- Wash the wells with ultrapure dH2O to control the degree of staining; if the HA deposits are not intensely colored, repeat step 5.3.5.2. Stop the staining when HA deposits become intensely red colored, which usually occurs within few minutes. Wash the wells with ultrapure dH2O.
- Adipogenic differentiation
NOTE: Assay duration depends on the OS-CSC lines. The assay can last 14 - 30 d.- Plate OS-CSCs in 24-well plates at a cell density of 1 x 10⁴ cells/cm2 in SCGM. Allow the cells to grow in SCGM until they reach 80 - 90% confluency in each well. Initiate adipogenic differentiation by changing the SCGM to AM. Allow the cells to grow in AM and refresh the AM twice a week.
- Stop the adipogenic differentiation assay when lipid vesicles are visible. Evaluate the adipogenic phenotype by Oil Red O staining and by haematoxylin counterstaining for nuclei.
- Haematoxylin counterstaining for nuclei
NOTE: Prepare the dye mixture before starting the experiment.- Prepare the 5% haematoxylin solution, called Emallume Carazzi39. Store the solution at 4 °C. Add Emallume Carazzi for only 2 min. Wash wells with ultrapure dH2O.
- CFU assay
NOTE: This experiment must be performed in triplicates.- Plate OS-CSCs in 100 mm Petri dishes at a cell density of 450 cells/cm2 in CFUM. Incubate the cells in a 37°C, 5% CO2 incubator for 4 weeks. Refresh CFUM twice a week.
- Stain the CFUs with toluidine blue. Count the colored colonies using an inverted microscope. Calculate CFU efficiency according to the following formula: (number of colonies formed/number of cells seeded)*100.
- ALDH activity analysis
NOTE: ALDH activity has been evaluated using an ALDH Activity Colorimetric Assay Kit on the two OS-CSC lines and on a finite fibroblast line, which was used as a negative control. This kit quantifies the ALDH enzymatic activity by absorbance reading at 450 nm. All tests have been performed in triplicates.- Dissociate cell cultures from the monolayer by trypsinization (see Section 2.2). Pellet cells by centrifugation at 400 x g for 5 min. Follow manufacturer's protocol.
- Flow cytometric analysis:
NOTE: Single cell suspensions are required for optimal staining of samples for flow cytometry. A single cell suspension must be prepared for each antibody to be tested. Dissociate cell cultures from the monolayer by trypsinization (see Section 2.2).- Place the cell suspension in a conical tube, perform a cell count using the Bürker Counting Chamber, centrifuge cells at 400 x g and resuspend in an appropriate volume of separation buffer to obtain a cell suspension at a final cell concentration of 1 x 10⁵ cells/ml.
- Centrifuge the cell suspension for 5 min at 4 °C. Discard the supernatant and wash the pellet with separation buffer. Repeat this step twice.
- Stain cells for MSC markers (i.e., CD44, CD105 and Stro-1)40.
- Analyze positively stained cell suspensions in a flow cytometer. Analyze the marked samples within 1 d. Incubate these samples at 4 °C until analysis.
- RT-PCR
- Extraction and isolation of RNA
- Add 1 ml lysis reagent to the cellular frozen packed samples of OS-CSCs and lyse the cells directly in the tube by pipetting the pellet up and down several times.
- Centrifuge the samples at 12,000 x g for 1 min at 4 °C. Gently remove the supernatant. Transfer the supernatant to a new tube, add 200 µL chloroform, and cap the tube securely. Shake the tube vigorously for 15 sec and incubate the sample for 5 min at RT.
- Centrifuge the samples at 12,000 x g for 15 min at 4 °C. The mixture separates into three different phases. The RNA is exclusively in the colorless upper aqueous phase.
- Being particularly careful, remove only the aqueous phase and transfer this phase into a new tube to proceed with RNA isolation. Add 500 µL isopropanol to the tube containing the aqueous phase. Shake the tube gently by hand. Incubate the sample at RT for 10 min. Centrifuge the sample at 12,000 x g for 10 min at 4 °C.
NOTE: After the sample is centrifuged, it is possible see the RNA, which forms a gel-like pellet on the side and on the bottom of the tube. - Remove the supernatant from the tube, being careful to leave the pellet of the RNA on the bottom. Add 1 ml 75% ethanol to the tube. Vortex the tube by hand for a few sec and then centrifuge the tube at 7500 x g for 5 min at 4 °C.
- Discard the ethanol and air dry the RNA pellet. When the pellet is dry, resuspend the RNA pellet in RNase-free water (10 - 50 µL) by pipetting the solution up and down several times.
- Determine the yield and purity of the RNA by measuring the absorbance at 260 nm and 280 nm using a spectrophotometer. Evaluate the integrity of the total RNA on standard 1% agarose gel. Store the RNA at -80 °C.
- Reverse polymerase chain reaction
- Synthesize first-strand cDNAs from 500 ng RNA samples using a reverse transcription kit. Thaw RNA samples on ice and thaw the necessary solutions included in the kit at RT. Proceed to synthesize cDNAs following manufacturer's protocol.
- Semi-quantitative reverse transcriptase-polymerase chain reaction (RT-PCR)
- Perform all PCRs using 1 µL cDNA for each sample as a template in a final reaction volume of 24 µL. Use the primer sequences listed in Table 1 for the amplification of Nanog, Oct 3/4, SOX2 and CD133 genes.
- Separate the RT-PCR products by 1.8% agarose gel electrophoresis and stain with ethidium bromide. Photograph under UV illumination.
- Extraction and isolation of RNA
Results
OS samples obtained by needle aspiration or surgical resection of a small portion of the tumor (Figure 1A, B) permit the isolation of only one OSA if treated precisely, as described in the Protocol section (Figure 2A, B). Unfortunately, the number of cells isolated from the biopsies is low, with an output range from 30 - 50%. The output depends on the type and the dimension of biopsies (Figure 5A, B). These cells must be treated precisely. Consequently, approximately one month is necessary for the primary cultures to reach confluency in a 100 mm Petri dish. After this time, OSA are obtained from two OS samples marked OSA5 and OSA6 (Figure 6A, B). Then, it is necessary to subculture the primary cell line to obtain an adequate number of cells to perform the characterization analysis and to cryopreserve the cell lines. At the 3rd passage of subculture, when both OSA primary cell lines reach confluency, they are plated in 6-well ultra-low attachment plates for the sarcosphere assay. This type of plate is used because it permits us to maintain cells in a suspended state, to prevent the stem cells from attachment-mediated differentiation, to prevent the anchorage-dependent cells from dividing, and finally, to reduce attachment to the substrate. Hence, their use permits us to create a stressful condition for the cancer cells, which is necessary for the selection of CSCs. At 24 hr after the start of the assay, cells appear isolated from one another (Figure 7). After 7 d of monitoring the progression of the assay, small spherical colonies have started to form and are visible (Figure 8). At 28 d, several large spherical colonies that have formed in each well can be observed (Figure 9A, B). After the sarcospheres have been cultured for 28 d, these large spherical colonies can be isolated. Figure 10 shows the steps for isolating sarcospheres from 6-well ultra-low attachment plates and reculturing them under adherent conditions. Figure 11 shows the floating spherical colonies after isolation. The large spherical colonies plated in normal attachment plates show adherent expansion after isolation (Figure 12A, B). Cells that expand from the single sarcospheres are probably cancer cells with a stem cell-like phenotype. Hence, after isolation, OS-CSCs were probably obtained. These cells are named OSA5-CSCs and OSA6-CSCs (Figure 13A, B).
At this point, it is necessary to proceed with the characterization of the stem cell-like phenotype for the two OS-CSC lines obtained, as described above. The analyses for the characterization of the stem cell-like phenotype were performed on the 4th passage of subculture after the sarcospheres for each OS-CSC line were isolated. The two cell lines, OSA5-CSCs and OSA6-CSCs, showed strong positivity for the surface MSC markers (CD105 and CD44) (Figure 14A, B and Figure 15A, B), while they showed moderate positivity for the surface MSC marker Stro-1 (Figure 16A, B). Our observations have been confirmed by negative results obtained with the commercial and differentiated colon cancer cell line HCT8 (Figure 14C, Figure 15C, Figure 16C). A total lack of specific and nonspecific staining for these surface markers in the HCT8 cell line was observed.
To evaluate the MSC phenotype of the two OS-CSCs, we also performed flow cytometric analyses. Both the OS-CSC lines expressed high levels of CD44 and CD105. However, of the cells in both cell lines, only 1.14% expressed Stro-1. Therefore, this result confirmed the moderate presence of Stro-1 as demonstrated by immunofluorescence staining. In contrast, 99.62% of the OSA5-CSCs expressed CD44 and 87.38% of these cells expressed CD105; 99.88% of the OSA6-CSCs expressed CD44 in and 95.79% of these cells expressed CD105. Additionally, both cell lines are CD45-.
We assessed the expression of 3 ESC markers (Nanog, Oct 3/4, Sox2) and of the CD133 gene, another CSCs marker, by RT-PCR. We noticed that all of these genes were expressed in both OS-CSC lines (Figure 17). The adipogenic and osteogenic differentiation assays showed the capacity of both isolated OSA-CSC lines to differentiate into osteoblasts (Figure 18A - D and Figure 19A - D) and into adipocytes (Figure 20A - D).
Furthermore, the CFU assay (Figure 21) showed a good rate of clonogenic efficiency, with 13% for OSA5-CSCs and 14% for OSA6-CSC. Several recent studies have shown that high levels of ALDH activity are characteristic of various types of cancer. This parameter could be used as a cancer stem cell marker and is correlated with a poor prognosis. The ALDH activity assay showed that both OS-CSC lines have high levels of ALDH activity (Figure 22), whereas ALDH activity was observed at the lower quantifiable limit in the fibroblast line that was used as a negative control in this assay.

Figure 1. Examples of OS Biopsy Samples. (A). Biopsy sample obtained by needle aspiration. (B). Biopsy sample obtained by surgical resection of a part of the tumor. Please click here to view a larger version of this figure.
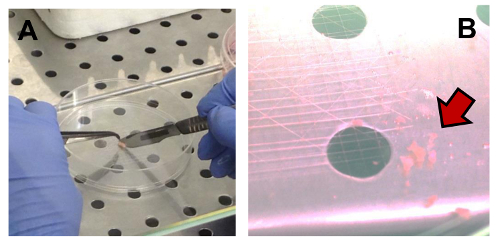
Figure 2. Mechanical Disaggregation of an OS Sample. (A) Fragmentation of a sample using Perry tweezers and a lancet. (B) Fragments suspended in CM (indicated by the arrow). Please click here to view a larger version of this figure.
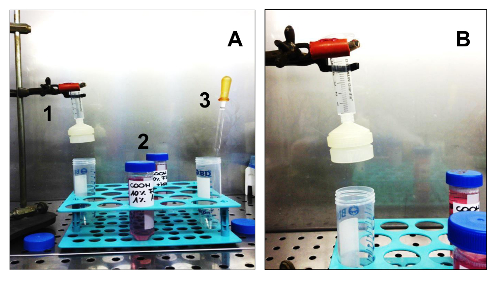
Figure 3. Equipment and Consumables Needed to Isolate Sarcospheres. (A). All the equipment necessary for cell isolation. 1. A sterile syringe with a sterile membrane filter holder; 2. Two different media: GM and SCGM; 3. A sterile glass Pasteur pipette. (B) Detail of the syringe assembled on a support, with the membrane filter holder. Please click here to view a larger version of this figure.
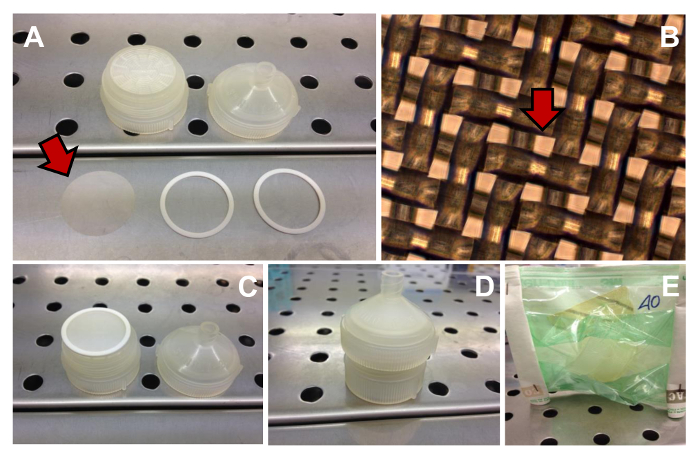
Figure 4. Filtration Unit. Several components needed to assemble the filtration unit (A) (the net filter is indicated by the arrow). Phase contrast observation of the 40 µm meshes (one mesh is indicated by the arrow) of the net filter (B). Original magnification: 10X. The filtration unit assembled (C - D). Filtration unit sterilized (E). Please click here to view a larger version of this figure.
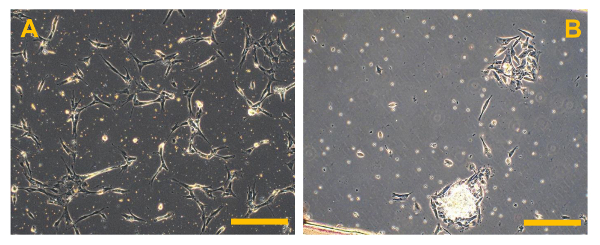
Figure 5. Primary Cell Cultures of Conventional OS. Phase contrast observation of primary cell cultures of high grade OS. In (A), several bright bone fragments are visible, while in (B), several small rounded and floating erythrocytes are present. Original magnification: 10X. Bar size: 100 µm. Please click here to view a larger version of this figure.
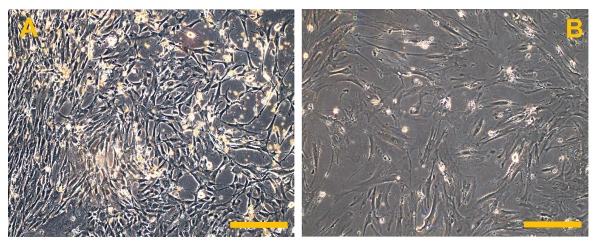
Figure 6. Conventional Osteosarcoma Finite Cell Lines (OSA). (A) OSA5 and (B) OSA6. Observation in phase contrast. Original magnification: 10X. Bar size: 100 µm. Please click here to view a larger version of this figure.
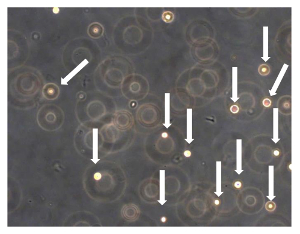
Figure 7. Sarcosphere Assay of OSA5 and OSA6. After 24 h from the start of the assay, cells were floating and isolated from each other (cells are indicated by arrows). Observation in phase contrast. Original magnification: 20X. Please click here to view a larger version of this figure.
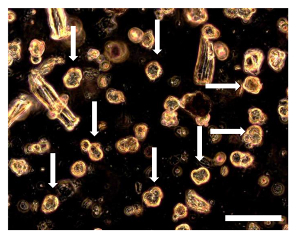
Figure 8. Sarcosphere Assay of OSA5 and OSA6 at 7 D. 7 d into the assay, several small spherical colonies surrounded by single cells could be observed. The sarcospheres (some of these sarcospheres are indicated by arrows) appear floating in the medium or slightly settled down into the bottom of the well. Observation in phase contrast. Original magnification: 20X. Bar size: 100 µm. Please click here to view a larger version of this figure.
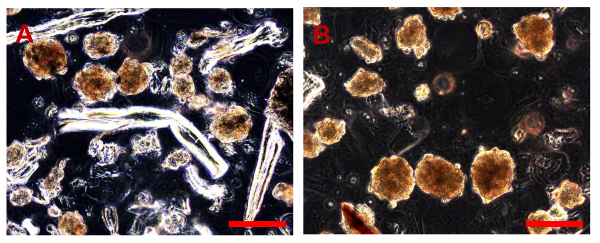
Figure 9. Sarcosphere Assay of OSA5 and OSA6 at 28 D. After 28 d, several large amber sarcospheres are observed in each well of the plates for each OSA cell line, OSA5 (A) and OSA6 (B). Bar size: 100 µm. Please click here to view a larger version of this figure.
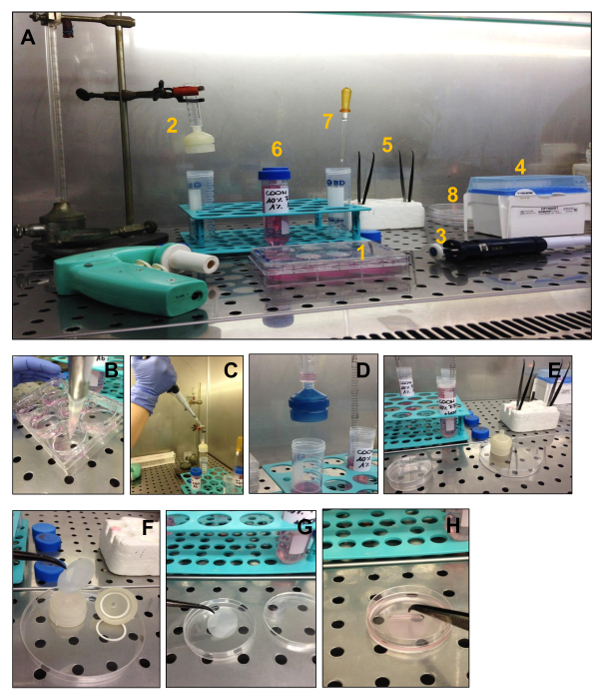
Figure 10. Passages for the Isolation of Sarcospheres. The steps for isolating sarcospheres from 6-well ultra-low attachment plates and their reculturing under adherent conditions are shown. (A) All the equipment needed for the isolation: 1. One 6-well ultra-low plate with formed sarcospheres in each well, 2. syringe with the net filter holder, 3. pipette, 4. 1,000 µL sterile tips, 5. 2 sterile Perry tweezers, 6. 2 different culture media, 7. sterile Pasteur pipette 8. Petri dishes. (B) Collection of sarcospheres. The medium contained in each well is collected using a pipette with a sterile 1,000 µL tip. (C) Collect the suspension in the syringe. The collected suspension is transferred to the syringe to start the natural filtration process using the membrane filter holder. (D) Natural filtration. (E) Disassembling the membrane filter holder from the syringe. After all the suspension is filtered, the net filter holder is taken apart and put in a Petri dish; (F) Disassembling the membrane filter holder. Sarcospheres are contained in the pores of the net filter in the net filter holder, so they must be freed using the Perry tweezers. (G, H) Removal of sarcospheres from the membrane filter. Please click here to view a larger version of this figure.
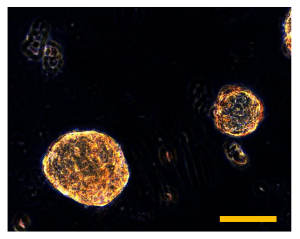
Figure 11. Sarcosphere Isolation. Isolated sarcospheres float in the medium in the 60 mm Petri dish. Observation in phase-contrast. Original magnification: 40X. Bar size: 100 µm. Please click here to view a larger version of this figure.
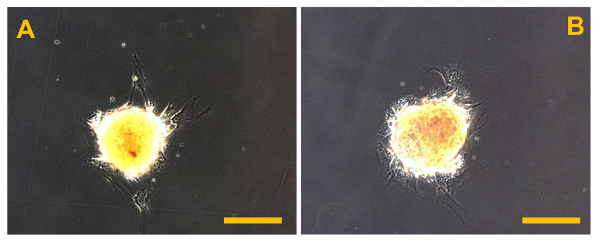
Figure 12. Sarcosphere After Isolation. Sarcospheres from OSA5 (A) and OSA6 (B) cell lines at the beginning of adherent expansion following reintroduction and reculturing in a monolayer under adherent conditions at 48 h after isolation. Observation in phase-contrast. Original magnification: 20X. Bar size: 100 µm. Please click here to view a larger version of this figure.
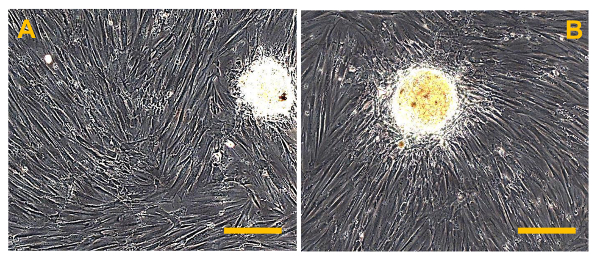
Figure 13. Sarcospheres at 7 D After Isolation. Sarcospheres from OSA5 (A) and OSA6 (B) cell lines showed adherent expansion following reintroduction and reculturing in a monolayer under adherent conditions at 7 d after isolation. Observation in phase-contrast. Original magnification: 20X. Bar size: 100 µm. Please click here to view a larger version of this figure.
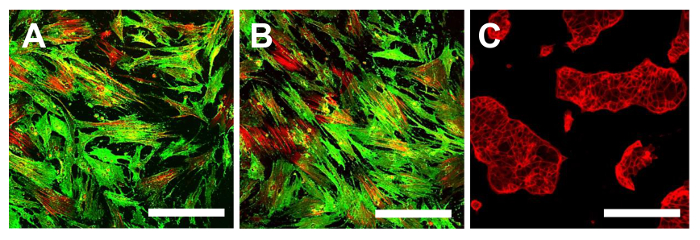
Figure 14. Immunofluorescence Staining for CD105. Immunofluorescence staining for CD105 in the OSA-CSC lines OSA5-CSCs (A) and OSA6-CSCs (B) and in the continuous cell line HCT8 (C), which was used as a negative control. LSCM in conventional color: green for CD105 and red for cytoskeleton. Original magnification: 10X. Bar size: 100 µm. Please click here to view a larger version of this figure.
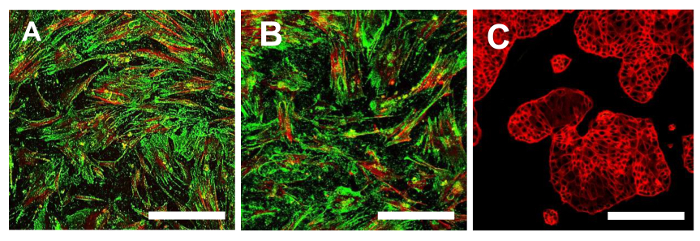
Figure 15. Immunofluorescence Staining for CD44. Immunofluorescence staining for CD44 in the OSA-CSC lines OSA5-CSCs (A) and OSA6-CSCs (B) and in the continuous cell line HCT8 (C), which was used as a negative control. LSCM in conventional colors: green for CD44 and red for cytoskeleton. Original magnification: 10X. Bar size: 100 µm. Please click here to view a larger version of this figure.
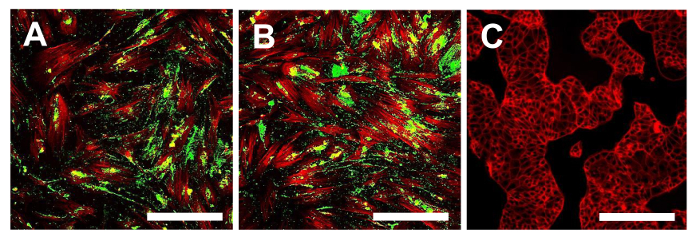
Figure 16. Immunofluorescence staining of Stro1. Immunofluorescence staining for Stro-1 in the OSA-CSC lines OSA5-CSCs (A) and OSA6-CSCs (B) and in the continuous cell line HCT8 (C), which was used as a negative control. LSCM in conventional colors: green for Stro-1 and red for cytoskeleton. Original magnification: 10X. Bar size: 100 µm. Please click here to view a larger version of this figure.
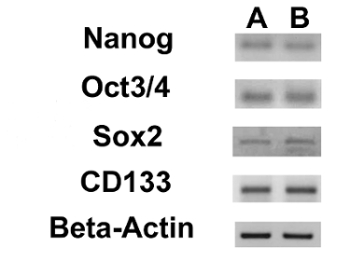
Figure 17. Expression of Nuclear ESC Markers and of the CD133 Gene. RT-PCR showing the expression of Nanog, Oct 3/4, Sox2 and CD133 in OSA5-CSCs (A) and in OSA6-CSCs (B). Please click here to view a larger version of this figure.
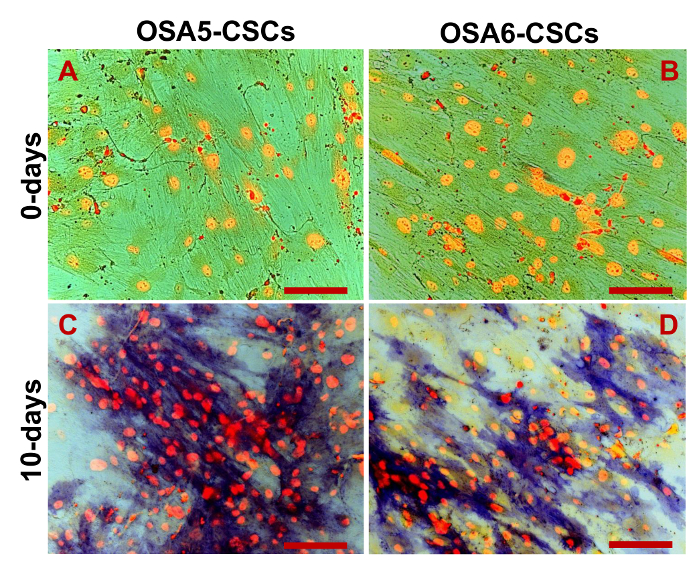
Figure 18. Osteogenic Differentiation Assay - ALP. Osteogenic differentiation at 0 d (A, B) and after 10 d (C, D) of induction as determined by cytochemical staining for ALP using Fast Blue BB. In blue, ALP+ cells; in red, the nucleus counterstained with propidium iodide. Composite observation in brightfield and in fluorescence. Original magnification: 20X. Bar size: 100 µm. Please click here to view a larger version of this figure.
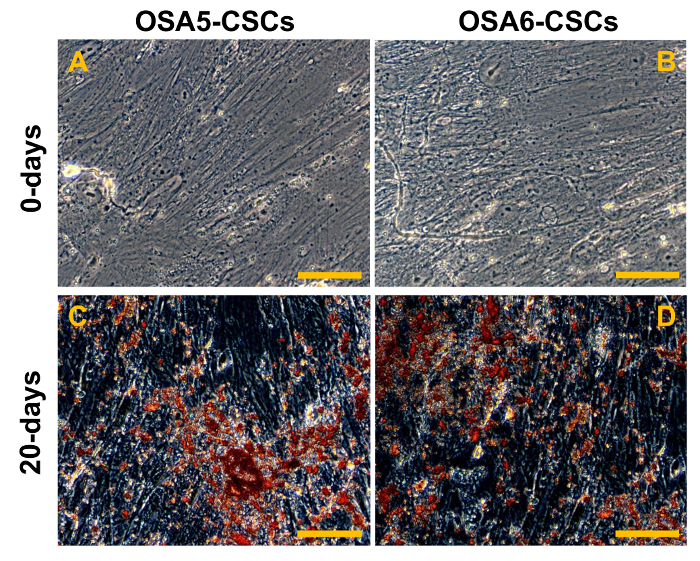
Figure 19. Osteogenic Differentiation Assay - HA. Osteogenic differentiation at 0 d (A, B) and after 20 d (C, D) of induction as determined by cytochemical staining for hydroxyapatite (HA) with Alizarin Red S. The cells are contrasted in blue/grey, and the grainy deposits of HA are stained in red. Observation in phase contrast. Original magnification: 40X. Bar size: 100 µm. Please click here to view a larger version of this figure.
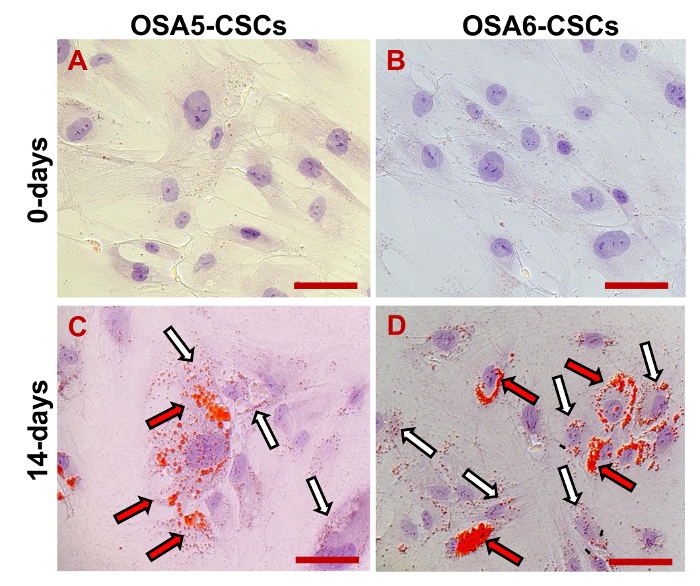
Figure 20. Adipogenic Differentiation Assay. Adipogenic differentiation at 0 d (A, B) and after 14 d (C, D) of induction as determined by cytochemical staining with Oil Red O. In red, the lipidic vesicles (the larger vesicles are indicated by the black/red arrows; the smaller vesicles are indicated by the white/black arrows); in blue/violet, the nuclei counterstained by haematoxylin. Observation in brightfield. Original magnification: 40X. Bar size: 100 µM. Please click here to view a larger version of this figure.
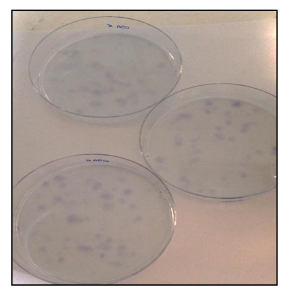
Figure 21. CFU Assay. CFU assay of OSA-CSC lines stained with toluidine blue. Please click here to view a larger version of this figure.
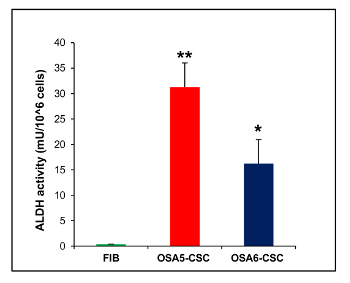
Figure 22. ALDH Activity Assay. The ALDH colorimetric assay detected high levels of ALDH activity in the two OS-CSC lines, OSA5-CSCs and OSA6-CSCs, whereas the assay detected the absence of this activity in the finite differentiated cell line of fibroblasts, FIB. Error bars: SD. **: p < 0.001 vs FIB; *: p < 0.01 vs FIB. Please click here to view a larger version of this figure.
| Gene | Oligonucleotides | Sequence (5¹-3¹) | Amplicon size (bp) | Tₐ (°C) | |
| Nanog | Forward primer Reverse primer | CCCAGCTGTGTGTACTCAAT GGTTCAGGATGTTGGAGAGTT | 87 | 60 | |
| Oct 3/2 | Forward primer Reverse primer | GGGAGGAGCTAGGGAAAGA TCCTTCCTTAGTGAATGAAGAACT | 77 | 60 | |
| Sox2 | Forward primer Reverse primer | TGCAGTACAACTCCATGACC GGACTTGACCACCGAACC | 125 | 55 | |
| CD133 | Forward primer Reverse primer | CCAGAAGCCGGGTCATAAAT ATTCACTCAAGGCACCATCC | 127 | 56 | |
| bp, base pairs of amplicon size; Tₐ, annealing temperature | |||||
Table 1. Detailed List of Primer Sequences for Nanog, Oct 3/4, Sox2 and CD133 with the Amplicon Size and the Annealing Temperature
Discussion
CSCs have several properties that permit the identification of this particular cellular subset in the tumor bulk. On the basis of these characteristics, such as acquired resistance to cytotoxic chemotherapy agents for the overexpression of ATP-binding cassette multidrug efflux transporters28, 32, 33, or for the upregulation of the expression of detoxification enzymes such as ALDH32, for the expression of a particular surface marker, such as CD133, CD44, CD34, CD90, and others30, 34, 35, 41, several different methods to isolate CSCs have been developed42-44. One of these techniques is the sphere formation assay, which is based on the capacity of CSCs to grow under non-adherent conditions.
The ability of tissue stem cells and CSCs to form spheres was first described in studies on the identification of neural stem cells by Reynolds et al.37. Subsequently, Gibbs et al.38 used these studies to begin isolating CSCs from solid tumors, in particular, from bone sarcomas. We have decided to use the sphere formation assay method illustrated by Gibbs et al. to isolate CSCs from OSA cell lines obtained from conventional OS biopsies. We adapted the original method to improve the results of this assay and to facilitate its reproducibility for other cancer cell lines. With reference to the establishment of the sphere formation assay, we verified that plating 40,000 cells/well is a good practice for maintaining cells in isolation at the beginning of the assay. This trick is very important to avoid the possibility that the spherical colonies originate from cellular aggregation and not from the particular and exclusive capacity of a single CSC to grow under non-adherent conditions and form a spherical colony. This ability is a particularly critical point of this assay.
We also certified that to obtain a good rate of sphere formation, it is sufficient to refresh aliquots of growth factors every 3 d and not every day as described in the original method. In this study, we also established and extensively described a good method for isolating the spherical colonies that formed when cultured under non-adherent conditions. This step is critical in this assay because it is very important to try to isolate as many of the spheres as possible that are formed in each well without damaging them. It is also important to isolate only the spheres and not the single cells, which could remain in suspension for the duration of the assay. To overcome these critical points, we have developed a particular isolation method, which, as shown above, gave good results for CSC isolation. Obviously, there is the possibility that not all the spheres that formed can be recovered, but the loss percentage is very low. Indeed, we also have the possibility to use a filter with 40 µm pores to isolate spheres after they become large (formed approximately 100 - 200 cells).
This isolation stops sphere formation but allows the single cells, part of the methylcellulose residue, and the smallest spheres to be filtered. This elimination is performed by thorough filtration as described in the protocol.
Moreover, the selection of the largest spherical colonies through the 40 µm mesh with the consequent loss of the smallest spherical colonies allows one to select the CSCs with the highest capacity to form spherical colonies and with greater stemness. All of these modifications were performed to improve the assay and to help researchers studying CSCs to understand and reproduce the most critical step of the original method of the sphere formation assay.
Among the studies regarding in vitro methods for isolating CSCs, this study aimed to show how this adapted sphere formation assay could be a good method for isolating CSCs from OSA cell lines. The adaptations to the original method and the detailed isolation technique described improve its efficacy. In a short time, good number of CSCs can be obtained and used for several experiments. Therefore, it is possible to rapidly confirm the stem-like phenotypes and, in particular, to study the double stem-like phenotype that characterizes OS-CSCs. Thus, this modified assay could be a good technique for isolating CSCs and studying their biology. In the future, this method, with additional adaptations, may also be used to isolate CSCs from other finite cancer cell lines obtained by biopsies of rare solid tumors.
The possibility of isolating CSCs from rare solid tumors, such as OS, not only permits the improvement of studies about this particular cancer but also extends to studies of different types of cancer to develop better methods for their isolation and to future studies of the biology of this important cellular subset. Therefore, as we have done in this study, it is important to improve the methods of CSC isolation through the study of CSC biology, with the final goal of finding molecular targets and developing a very specific anticancer therapy directed against this particular cellular subset, which is probably responsible for the maintenance of the primary tumor, the development of its recurrence, and the origin of metastases in several organs. The study of CSC biology is also important for finding therapies that could be incisive in the cure of cancers, such as OS, for which the survival rate after neoadjuvant treatment remains very poor.
Disclosures
The authors declare that they have no competing financial interest.
Acknowledgements
This study was supported by ITT (Istituto Toscano Tumori) Grant Proposal 2010.
Materials
| Name | Company | Catalog Number | Comments |
|---|---|---|---|
| Dulbecco's Phosphate Buffered Saline with Ca2+ and Mg2+ (DPBS) | LONZA | BE17-513F | _ |
| Dulbecco's Phosphate Buffered Saline without Ca2+ and Mg2+ (DPBS) | LONZA | BE17-512F | _ |
| Porcine Trypsin 1:250 | BD Difco | 215310 | Solvent: DPBS. Stock concentration: Powder |
| Ethylenediamine tetraacetic acid disodium salt dihydrate(EDTA) | Sigma-Aldrich | E4884 | Solvent: DPBS. Stock concentration: Powder |
| Collagenase from Clostridium histolyticum | Sigma-Aldrich | C0130 | Solvent: Buffer Solution, pH 7.4. Stock concentration: Powder |
| Dimethyl sulphoxide (DMSO) | BDH Chemicals-VWR | 10323 | _ |
| Nutrient Mixture F-12 Ham | Sigma-Aldrich | F6636 | Solvent: Ultrapure dH2O. Stock concentration: Powder |
| 2-Phospho-L-ascorbic acid trisodium salt | Sigma-Aldrich | 49752 | Solvent: DPBS. Stock concentration: 5 mg/mL |
| β-Glycerol phosphate disodium salt pentahydrate | Sigma-Aldrich | 50020 | Solvent: DPBS. Stock concentration: 1 M |
| Insulin. Human Recombinant | Sigma-Aldrich | 91077 | Solvent: NaOH 0.1 M. Stock concentration: 10 mM |
| 3-Isobutyl-1-methylxanthine | Sigma-Aldrich | I5879 | Solvent: DMSO. Stock concentration: 500 mM |
| Indomethacin | Sigma-Aldrich | I7378 | Solvent: DMSO. Stock concentration: 200 mM |
| Dexamethasone | Sigma-Aldrich | D4902 | Solvent: DMSO. Stock concentration: 1 mM / 100 µM. Store in liquid nitrogen to maintain the biological activity |
| Fetal Bovine Serum (FBS) | Sigma-Aldrich | F7524 | _ |
| Fetal Bovine Serum South America | EUROCLONE | ECS0180L | _ |
| Penicillin-Streptomycin (PEN-STREP) 10,000 U/mL | LONZA | DE17-602E | _ |
| Methyl cellulose | Sigma-Aldrich | 274429 | Solvent: Ultrapure dH2O. Stock concentration: 2% |
| Putresceine dihydrochloride | Sigma-Aldrich | P5780 | Solvent: Ultrapure dH2O. Stock concentration: Powder |
| apo-Transferrin | Sigma-Aldrich | T-1147 | Solvent: DPBS. Stock concentration: 25 mg/mL |
| Human Epidermal Growth Factor (EFGF) | Sigma-Aldrich | E5036 | Solvent: DPBS pH 7.4. Stock concentration: 10 µg/mL |
| Fibroblast Growth Factor-Basic Human | Sigma-Aldrich | F0291 | Solvent: DPBS + 0.2% BSA. Stock concentration: 25 µg/mL |
| Selenous Acid | Sigma-Aldrich | 211176 | Solvent: DPBS. Stock concentration: 30 mM |
| Progesterone | Sigma-Aldrich | P8783 | Solvent: ETOH. Stock concentration: 10 mM |
| Toluidine Blue O | Sigma-Aldrich | 198161 | Solvent: Ultrapure dH2O. Stock concentration: Powder |
| Oil Red O | ICN Biochemicals | 155984 | Solvent: 2-Propanol. Stock concentration: Powder |
| Naphtol AS-MX Phosphate Disodium Salt | Sigma-Aldrich | N5000 | Solvent: DMSO. Stock concentration: Powder |
| Fast Blue BB Salt | Sigma-Aldrich | F3378 | Solvent: Tris HCL, pH 9.0. Stock concentration: Powder |
| Fast Red Violet LB Salt | Sigma-Aldrich | F3381 | Solvent: Tris HCL, pH 9.1. Stock concentration: Powder |
| Bovine Serum Albumin, Fraction V (BSA) | Sigma-Aldrich | A-4503 | Solvent: DPBS. Stock concentration: 2% |
| Alizarin Red S | ICN Biochemicals | 100375 | Solvent: Ultrapure dH2O. Stock concentration: Powder |
| Formaldehyde solution | Sigma-Aldrich | 533998 | 4% |
| Triton-100X | MERCK | 11869 | Solvent: DPBS. Stock concentration: 0.2%. Danger - Use only under chemical hood |
| Calcein | MERCK | 2315 | Solvent: DPBS . Stock concentration: 200 µg/mL |
| 2-Propanol | MERCK | 109634 | Danger - Use only under chemical hood |
| Ab-CD105 (Mouse monoclonal [SN6] to CD105 (FITC) | Abcam | ab11415 | Liquid. Application: Flow Cytometry (Flow Cyt) |
| Ab-CD44 (Mouse monoclonal [F10-44-2] to CD44 (PE/Cy7®) ) | Abcam | ab46793 | Liquid. Application: Flow Cytometry (Flow Cyt) |
| Ab-CD45 (Mouse monoclonal [MEM-28] to CD45 (PerCP)) | Abcam | ab65952 | Liquid. Application: Flow Cytometry (Flow Cyt) |
| Ab-CD105 (Human CD105 Purified Antibody) | Invitrogen | MHCD10500 | Solvent: DPBS. Stock concentration: Lyophilized. Application: Immunofluorescence staining (IF) |
| Ab-CD44 (Anti-CD44 Antibody) | Abcam | EPR1013Y(ab51037) | Solvent: DPBS. Stock concentration: Lyophilized. Application: Immunofluorescence staining (IF) |
| Ab-Stro-1 (Mouse anti-STRO-1) | Invitrogen | 398401 | Solvent: DPBS. Stock concentration: Lyophilized. Application: Flow Cytometry (Flow Cyt) Immunofluorescence staining (IF) |
| Alexa Fluor 488 (Anti-Rabbit IgG (Alexa Fluor 488 Donkey Anti-Rabbit IgG (H+L)) | Invitrogen | A-21206 | Solvent: DPBS. Stock concentration: Lyophilized. Application: Immunofluorescence staining (IF) |
| FITC Anti-Mouse IG (FITC-Rabbit Anti Mouse IgG (H+L)) | Invitrogen | 61-6511 | Solvent: DPBS. Stock concentration: Lyophilized. Application: Flow Cytometry (Flow Cyt) Immunofluorescence staining (IF) |
| Alexa Fluor 635 Phalloidin | Invitrogen | A34054 | Solvent: DPBS. Stock concentration: Lyophilized. Application: Immunofluorescence staining (IF) |
| AutoMACS™Running Buffer MACS Separation Buffer | Miltenyi | 130,091,221 | Liquid. Store at 4 °C |
| QIAzol®Lysis Reagent | QIAGEN | 79306 | Danger - Use only under chemical hood |
| QUANTITECT® Reverse Transcription Kit | QIAGEN | 205314 | _ |
| Chlorophorm | Sigma-Aldrich | C2432 | Liquid. Danger - Use only under chemical hood |
| Laminar flow hood | GELAIRE | BSB6A | _ |
| Chemical hood | ARREDI TECNICI Villa | Modello DYNAMICA | _ |
| Centrifuge | EPPENDORF | 5415R | _ |
| Laser Scanning Confocal Microscopy LSM 5109 Meta | ZEISS | _ | _ |
| iCycler PCR Thermalcycler | BIORAD | _ | _ |
| CyFlow®SPACE | (PARTEC) | _ | _ |
| Inverted Micrposcope Axiovert 200M | ZEISS | _ | _ |
| Freezing container , | Nalgene | _ | _ |
| Original Pipet-Aid | pbiBrand | _ | _ |
| Micropipettes | EPPENDORF | _ | _ |
| Glass Pasteur Pipette | SIGMA | _ | _ |
| VICTOR3™ | PERKIN ELMER | _ | _ |
| Conical tubes (15 and 50 mL) | BD FALCON | 352096 (for 15 mL) 352070 (for 50 mL) | _ |
| 24-Well Clear Flat Bottom TC-Treated Multiwell-Cell-Culture-Plate | BD FALCON | 353047 | _ |
| 6-Well Clear Flat Bottom Ultra Low Attachment Multiple-Well-Plates | CORNING | 3471 | _ |
| Serological pipettes (5 and 10 mL) | BD FALCON | 357543 (for 5 mL) 357551 (for 10mL) | _ |
| Syringe (5mL) | B|BRAUN | 4617053V | _ |
| Petri dish 100X20 mm | BD FALCON | 353003 | _ |
| Röhren Tubes (3.5 mL, 55x12mm, PS) | SARSTEDT | 55,484 | _ |
| Petri dish 60X15 mm | BD FALCON | 353004 | _ |
| Cryovials 1.5 mL | NALGENE | 5000-1020 | _ |
| Cell-Culture Flasks 25 cm² | BD FALCON | 353014 | _ |
| Nylon Net Filter, Hydrophilic | MERCK | NY4104700 | _ |
| Swinnex Filter Holder | MERCK | SX0002500 | _ |
| Perry tweezer | _ | _ | _ |
| Lancet | _ | _ | _ |
| Dounce | _ | _ | _ |
References
- Reddick, R. L., Michelitch, H. J., Levine, A. M., Triche, T. J. Osteogenic sarcoma: a study of the ultrastructure. Cancer. 45 (1), 64-71 (1980).
- Gatta, G., et al. Childhood cancer survival trends in Europe: a EUROCARE Working Group study. J. Clin. Oncol. 23 (16), 3742-3751 (2005).
- Olstad, O. K., et al. Molecular heterogeneity in human osteosarcoma demonstrated by enriched mRNAs isolated by directional tag PCR subtraction cloning. Anticancer. Res. 23 (3B), 2201-2216 (2003).
- Geller, D. S., Gorlick, R. Osteosarcoma: a review of diagnosis, management, and treatment strategies. Clin Adv Hematol Oncol. 8 (10), 705-718 (2010).
- Tang, N., Song, W. X., Luo, J., Haydon, R. C., He, T. C. Osteosarcoma development and stem cell differentiation. Clin. Orthop. Relat. Res. 466 (9), 2114-2130 (2008).
- Kempf-Bielack, B., et al. Osteosarcoma relapse after combined modality therapy: an analysis of unselected patients in the Cooperative Osteosarcoma Study Group (COSS). J. Clin. Oncol. 23 (3), 559-568 (2005).
- Meyers, P. A., et al. Osteosarcoma: a randomized, prospective trial of the addition of ifosfamide and/or muramyl tripeptide to cisplatin, doxorubicin, and high-dose methotrexate. J. Clin. Oncol. 23 (9), 2004-2011 (2005).
- Gorlick, R., et al. Biology of childhood osteogenic sarcoma and potential targets for therapeutic development: meeting summary. Clin. Cancer Res. 9 (15), 5442-5453 (2003).
- Hayden, J. B., Hoang, B. H. Osteosarcoma: basic science and clinical implications. Orthop. Clin. North Am. 37 (1), 1-7 (2006).
- Thomas, D., Kansara, M. Epigenetic modifications in osteogenic differentiation and transformation. J. Cell. Biochem. 98 (4), 757-769 (2006).
- Araki, N., et al. Involvement of the retinoblastoma gene in primary osteosarcomas and other bone and soft-tissue tumors. Clin. Orthop. Relat. Res. 270 (270), 271-277 (1991).
- Chou, A. J., Gorlick, R. Chemotherapy resistance in osteosarcoma: current challenges and future directions. Expert. Rev. Anticancer Ther. 6 (7), 1075-1085 (2006).
- Arndt, C. A. S., Crist, W. M. Common musculoskeletal tumorsof childhood and adolescence. N. Engl. J. Med. 341 (5), 342-352 (1999).
- Longhi, A., Errani, C., De Paolis, M., Mercuri, M., Bacci, G. Primary bone osteosarcoma in the pediatric age: state of the art. Cancer. Treat. Rev. 32 (6), 423-436 (2006).
- Bacci, G., et al. Long-term outcome for patients with nonmetastatic osteosarcoma of the extremity treated at the istituto ortopedico rizzoli according to the istituto ortopedico rizzoli/osteosarcoma-2 protocol: an updated report. J. Clin. Oncol. 18 (24), 4016-4027 (2000).
- Clarke, M. F., et al. Cancer stem cells-perspectives on current status and future directions: AACR workshop on cancer stem cells. Cancer. Res. 66 (19), 9339-9344 (2006).
- Lapidot, T., et al. A cell initiating human acute myeloid leukaemia after transplantation into SCID mice. Nature. 367 (6464), 645-648 (1994).
- Bonnet, D., Dick, J. E. Human acute myeloid leukemia is organized as a hierarchy that originates from a primitive hematopoietic cell. Nat. Med. 3 (7), 730-737 (1997).
- Visvader, J. E., Lindeman, G. J. Cancer stem cells in solid tumors: accumulating evidence and unresolved questions. Nat. Rev. Cancer. 8 (10), 755-768 (2008).
- Bapat, S. A. Evolution of cancer stem cells. Semin. Cancer Biol. 17 (3), 204-213 (2007).
- Rubio, D., et al. Spontaneous human adult stem cell transformation. Cancer. Res. 65 (8), 3035-3039 (2005).
- Burns, J. S., et al. Tumorigenic heterogeneity in cancer stem cells evolved from long-term cultures of telomerase-immortalized human mesenchymal stem cells. Cancer. Res. 65 (8), 3126-3135 (2005).
- Zhang, M., Rosen, J. M. Stem cells in the etiology and treatment of cancer. Curr. Opin. Genet. Dev. 16 (1), 60-64 (2006).
- Li, Y., et al. Evidence that transgenes encoding components of the Wnt signaling pathway preferentially induce mammary cancers from progenitor cells. Proc. Natl Acad. Sci. USA. 100 (26), 15853-15858 (2003).
- Sell, S. Cellular origin of cancer: dedifferentiation or stem cell maturation arrest? Environ Health Perspect. 101 (Suppl 5), 15-26 (1993).
- Wernig, M., et al. In vitro reprogramming of fibroblasts into a pluripotent ES-cell-like state. Nature. 448 (7151), 318-324 (2007).
- Niwa, H., Miyazaki, J., Smith, A. G. Quantitative expression of oct-3/4 defines differentiation, dedifferentiation or self-renewal of ES cells. Nat. Genet. 24 (4), 372-376 (2000).
- Hochedlinger, K., Jaenisch, R. Nuclear reprogramming and pluripotency. Nature. 441 (7097), 1061-1067 (2006).
- Dean, M., Fojo, T., Bates, S. Tumor stem cells and drug resistance. Nat. Rev. Cancer. 5 (4), 275-284 (2005).
- Ma, S., Lee, T. K., Zheng, B. J., Chan, K. W., Guan, X. Y. CD133+ HCC cancer stem cells confer chemoresistance by preferential expression of the Akt/PKB survival pathway. Oncogene. 27 (12), 1749-1758 (2008).
- Wu, C., et al. Side population cells isolated from mesenchymal neoplasms have tumor initiating potential. Cancer. Res. 67 (17), 8216-8222 (2007).
- Ma, I., Allan, A. L. The role of human aldehyde dehydrogenase in normal and cancer stem cells. Stem. Cell. Rev. 7 (2), 292-306 (2011).
- Awad, O., et al. High ALDH activity identifies chemotherapy-resistant Ewing's sarcoma stem cells that retain sensitivity to EWS-FLI1 inhibition. PLoS One. 5 (11), e13943(2010).
- Fujii, H., et al. Sphere-forming stem-like cell populations with drug resistance in human sarcoma cell lines. Int. J. Oncol. 34 (5), 1381-1386 (2009).
- Di Fiore, R., et al. Genetic and molecular characterization of the human osteosarcoma 3AB-OS cancer stem cell line: a possible model for studying osteosarcoma origin and stemness. J. Cell. Physiol. 228 (6), 1189-1201 (2013).
- Reynolds, B. A., Tetzlaff, W., Weiss, S. A multipotent EGF-responsive striatal embryonicprogenitor cell produces neurons and astrocytes. J. Neurosci. 12 (11), 4565-4574 (1992).
- Reynolds, B. A., Weiss, S. Generation of neurons and astrocytes from isolated cells of the adult mammalian central nervous system. Science. 255 (5052), 1707-1710 (1992).
- Gibbs, C. P., et al. Stem-like cells in bone sarcomas: implications for tumorigenesis. Neoplasia. 7 (11), 967-976 (2005).
- Beccari, N., Mazzi, V. Manuale di tecnica microscopic. Casa Editrice Dr. Francesco Vallardi Società Editrice Libraria. , 99-100 (1966).
- Majumdar, M. K., Thiede, M. A., Mosca, J. D., Moorman, M., Gerson, S. L. Phenotypic and functional comparison of cultures of marrow-derived mesenchymal stem cells (MSCs) and stromal cells. J. Cell. Physiol. 176 (1), 57-66 (1998).
- Tirino, V., et al. Human primary bone sarcomas contain CD133+ cancer stem cells displaying high tumorigenicity in vivo. FASEB J. 25 (6), 2022-2030 (2011).
- Tirino, V., et al. Cancer stem cells in solid tumors: an overview and new approaches for their isolation and characterization. FASEB J. 27 (1), 13-24 (2013).
- Martins-Neves, S. R., et al. Therapeutic implications of an enriched cancer stem-like cell population in a human osteosarcoma cell line. BMC Cancer. 12 (1), 139(2012).
- Tang, Q. L., et al. Enrichment of osteosarcoma stem cells by chemotherapy. Chin. J. Cancer. 30 (6), 426-432 (2011).
Reprints and Permissions
