This paper presents a sensitive method called Circle-Seq for purifying extrachromosomal circular DNA (eccDNA). The method encompasses column purification, removal of remaining linear chromosomal DNA, rolling-circle amplification and high-throughput sequencing. Circle-Seq is applicable to genome-scale screening of eukaryotic eccDNA and studying genome instability and copy-number variation.
Method Article
Genome-wide Purification of Extrachromosomal Circular DNA from Eukaryotic Cells
In This Article
Summary
Abstract
Extrachromosomal circular DNAs (eccDNAs) are common genetic elements in Saccharomyces cerevisiae and are reported in other eukaryotes as well. EccDNAs contribute to genetic variation among somatic cells in multicellular organisms and to evolution of unicellular eukaryotes. Sensitive methods for detecting eccDNA are needed to clarify how these elements affect genome stability and how environmental and biological factors induce their formation in eukaryotic cells. This video presents a sensitive eccDNA-purification method called Circle-Seq. The method encompasses column purification of circular DNA, removal of remaining linear chromosomal DNA, rolling-circle amplification of eccDNA, deep sequencing, and mapping. Extensive exonuclease treatment was required for sufficient linear chromosomal DNA degradation. The rolling-circle amplification step by φ29 polymerase enriched for circular DNA over linear DNA. Validation of the Circle-Seq method on three S. cerevisiae CEN.PK populations of 1010 cells detected hundreds of eccDNA profiles in sizes larger than 1 kilobase. Repeated findings of ASP3-1, COS111, CUP1, RSC30, HXT6, HXT7 genes on circular DNA in both S288c and CEN.PK suggests that DNA circularization is conserved between strains at these loci. In sum, the Circle-Seq method has broad applicability for genome-scale screening for eccDNA in eukaryotes as well as for detecting specific eccDNA types.
Introduction
Detecting early or transient chromosomal amplification is difficult because it requires identifying alterations in single DNA molecules in large populations of cells. Chromosomal copy-number variations (CNVs) are generally detected well after their establishment, leaving only the final CNV structure as evidence of the mechanism that generated the variation1,2. Detecting and recovering extrachromosomal circular DNA (eccDNA) in earlier stages of CNV formation might elucidate ongoing processes in genomic rearrangements.
Previously, de novo discovery of eccDNA was by electron micrographs3, Giemsa staining of metaphase chromosomes4, or two-dimensional gel electrophoresis5. These methods provide little or no information about the sequence of the circular DNA. Targeted techniques such as Southern blotting6,7, inverse PCR8, or fluorescence in situ hybridization9 provide evidence only about specific eccDNA elements. None of these methods provide the sequence of all existing eccDNA types in a cell population.
Genomic divergence in a pool of cells can be characterized by genome sequencing and/or tiling arrays10,11. Detecting a deletion or amplification by conventional DNA purification methods usually requires that a mutated allele represent at least 0.1-1% of the cell population12,13. Acentric eccDNAs are expected to be even more transient in a cell culture due to their lack of centromeres and potential absence of DNA synthesis at replication. Thus, since most eccDNAs presumably are in low amounts and their sequences resemble the genome, alternative DNA extraction methods are needed to detect eccDNAs.
Several circular DNA purification techniques exploit the structural differences between chromosomes and circular DNA. For instance, high-speed ultracentrifugation in cesium-chloride gradients is used to isolate 350-3000 basepairs (bp) large eccDNAs from the human HeLa cancer cell line14. However, high-velocity can break or nick the backbone of supercoiled circular DNA structures, altering the sedimentation velocity15 and the eccDNA yield. Dutta and coworkers developed a method for de novo, genome-scale identification of circular DNA from mouse tissues as well as from cultures of chicken and human cells16,17. Their method is extraction of nuclei from homogenized tissue by sucrose ultracentrifugation followed by plasmid purification and several rounds of enzymatic reactions and DNA extractions. Their protocol primarily identifies 200-400 bp eccDNAs, called microDNAs. Dutta and coworkers also attempted purification of microDNAs from Saccharomyces cerevisiae but were unable to record microDNA from this yeast species16.
We have developed a novel method for de novo detection of eccDNA from yeast called Circle-Seq. This method enables genome-scale surveys for circular DNA molecules large enough to carry whole genes and as large as the 86 kilobase (kb) mitochondrial DNA (mtDNA). The Circle-Seq method was developed from a well-established prokaryotic plasmid purification method18,19, optimized for eukaryotic yeast cells and combined with deep sequencing. Using the Circle-Seq approach, 1756 different eccDNAs, all larger than 1 kb, were detected from ten S. cerevisiae S288c populations20. A size cut-off was chosen to focus on eccDNA that were large enough to carry whole genes. Circle-Seq was highly sensitive; it detected a single eccDNA within thousands of cells20. In the current study, Circle-Seq was used to isolate and identify 294 eccDNAs from three biological replicates of another S. cerevisiae yeast strain, CEN.PK. The data reveals that eccDNA is a common genetic element in S. cerevisiae strains.
Protocol
NOTE: An overview of the circular DNA purification and sequencing method (Circle-Seq) is illustrated in Figure 1.
1. Cultivation, Cell Harvest and Plasma Membrane Disruption
- Inoculate yeast cells (for example Saccharomyces cerevisiae) from an O/N culture into 50 ml complete nutrient medium of yeast peptone dextrose (YPD). Inoculate at a low initial cell density of 1-3 x 10⁵ cells/ml or an optical density of approximately 0.01 OD600.
- Incubate the cells at 30°C with agitation at 150 rounds per minutes (rpm) until cells reach maximum cell density of approximately 1 x 10¹⁰ cells, approximately after 24 to 48 hr or a optical density at OD600 > 10.0.
NOTE: The cultivation time is not crucial as lower cell concentrations can be used.
- Incubate the cells at 30°C with agitation at 150 rounds per minutes (rpm) until cells reach maximum cell density of approximately 1 x 10¹⁰ cells, approximately after 24 to 48 hr or a optical density at OD600 > 10.0.
- Transfer the outgrown culture to a 50 ml conical tube, pellet the cells by centrifugation at 800 x g for 3 min and discard the supernatant.
- Wash the pellet with 25 ml buffer solution of 10 mM Tris-Cl, 1 mM EDTA, pH 8.0, re-pellet the cells by centrifugation at 800 x g for 3 min and discard the supernatant.
- Resuspend the cell pellet in 1.2 ml resuspension buffer supplied from a plasmid column-purification kit.
- Optional step: Add highly diluted plasmids as controls for purification of circular DNA elements20.
NOTE: In the current dataset, a 7.7 µl plasmid mixture was applied for each sample containing 1010 cells. The plasmid stock mixture consisted of three plasmids in different concentrations; pBR322 at 38 ng/sample, pUC19 at 0.5 ng/sample, and pUG72 at 0.01 ng/sample. - Transfer the cell suspension into two 2 ml micro-centrifuge tubes, each supplemented with 0.5 mm glass beads at a 1:3 ratio of the total suspension volume.
- Vortex each tube at maximum speed for 10 min to disrupt plasma cell membranes. Pellet the beads by centrifugation at 268 x g for 30 sec and transfer the 1.2 ml combined supernatant from the two microcentrifuge tubes to a new tube.
NOTE: Alternative to step 1.6-1.7, use zymolyase to disrupt cells in 0.6 ml resuspension buffer solution. Ten units of zymolyase can disrupt 5 x 10⁷ cells within 1.5 hr at 35°C.
2. EccDNA Enrichment by Column Chromatography
- Follow the protocol from a kit for column purification of plasmids. In brief, treat each sample with 1.2 ml alkaline solution, mix gently and incubate 3 min at RT.
- Add 1.2 ml neutralization buffer, mix gently and centrifuge at 9650 x g for 5 min.
- Load the solution onto a column equilibrated with 1 ml equilibration solution and allow the liquid to flow through the column by gravity.
- Wash the column with 4 ml washing solution. When the solution has passed through the resin, carefully add 0.3 ml elution solution to replace most of the 0.35 ml column void volume.
- Elute DNA into a new collection tube with 1 ml elution solution and precipitate the DNA by adding 0.8 ml precipitation mixture. Centrifuge at 9650 x g for 10 min.
- Wash the DNA pellet with 0.5 ml 70% ethanol, centrifuge at 9650 x g for 5 min, air dry for 5 to 15 min and dissolve the purified DNA in 25 µl sterile water.
NOTE: Only short term storage of DNA in water is recommended. Preferentially, proceed directly to step 3.
3. Digestion of Remaining Linear Chromosomal DNA
- Optional step: To facilitate specific digestion of linear DNA by exonuclease, treat the purified DNA with a rare-cutting endonuclease such as NotI. For 5 µg DNA, use 1 unit NotI, 5 µl 10x digestion buffer and sterile water to a total volume of 50 µl. Incubate the reaction at 37°C for 16 hr and heat inactivate the endonuclease at 80°C for 5 min.
- Add 20 units exonuclease (2 µl), 4 µl ATP (25 mM), 34 µl sterile water and 10 µl 10x reaction buffer directly to the 50 µl endonuclease-cleaved DNA to reach a 1x reaction volume of 100 µl, using the ATP-dependent exonuclease kit.
- Perform hydrolysis of linear single-stranded and double-stranded DNA at 37°C for 5 days or more. Add an additional 4 µl ATP (25 mM), 0.6 µl 10x reaction buffer and 20 units exonuclease every 24 hr to continue the enzymatic DNA digestion at a 1x reaction volume.
- After removal of linear DNA, sample 2 µl from the exonuclease treated solution to confirm elimination of chromosomal linear DNA by quantitative polymerase chain reaction (qPCR), using a chromosomal marker such as the actin gene ACT120.
- Each 20 µl qPCR reaction volume contains 2 µl exonuclease-treated sample, 150 nM ACT1 primers 5'-TCCGTCTGGATTGGTGGTTCTA-3' and 5'-TGGACCACTTTCGTCGTATTC-3', 2% (volume/volume) dimethyl sulfoxide, and 10 µl green fluorescent master mix.
- Use the reaction condition; 3 min at 95°C, followed by 45 cycles of 15 sec at 95°C and 30 sec at 60°C.
NOTE: ACT1 is a particularly suitable marker for linear DNA since copy number variations in this gene are deleterious21-23 so eccDNA should not carry ACT1. - Alternatives to analysis of DNA digestion by qPCR are standard PCR (4.3) or propidium iodide staining (4.4).
- Use 2 µl exonuclease-treated sample as PCR template with ACT1 primers 5'-TGGATTCTGGTATGTTCTAGC-3' and 5'-GAACGACGTGAGTAACACC-3'. As positive ACT1 control, use 50-100 ng genomic S. cerevisiae DNA as template. PCR reaction conditions; 3 min at 95°C, followed by 35 cycles of 30 sec at 95°C, 30 sec at 56°C and 1 min at 72°C.
- Run PCR reactions by gel electrophoresis on 1% agarose with 0.5 µg/ml ethidium bromide. Look for a 0.8 kb ACT1 band.
- The absence or presence of linear DNA can also be examined by propidium iodide staining before and after DNA amplification.
- Mix each DNA sample in a 1:1 volume with a 1:1,000 H2O-diluted solution of 20 mM propidium iodide stock. Leave solution in darkness for 10-20 min at RT and analyze DNA staining by fluorescence microscopy at 100x magnification using a red excitation fluorescence filter at 663-738 nm and an exposure-time of 5 to 30 sec. As DNA-staining control, use ø29-amplified genomic DNA from yeast and/or ø29-amplified plasmid.
- Heat inactivate the exonuclease solution at 70°C for 30 min.
4. DNA Amplification
- Amplify the purified and enriched eccDNA from step 3.5) with ø29 DNA polymerase24-26 according to the protocol of the polymerase manufacturer.
- In brief, mix 5 µl enriched eccDNA with 5 µl denaturation buffer.
- After 3 min at RT, add 10 µl neutralization buffer. Mix gently and add 30 µl master mix containing 29 µl reaction buffer and 1 µl ø29 DNA polymerase. Incubate the reaction at 30°C for 16 hr or more (up to 72 hr). Heat inactivate the ø29 DNA polymerase at 65°C for 3 min.
5. Sequencing and Data Analysis
- Shear the amplified eccDNA with a focused ultrasonicator to an average target peak size of 300 bp. Use the following settings for a 130 µl DNA sample: 450W peak intensity power, 60 sec treatment, 30% duty factor, 200 cycles per burst, temperature 7°C.
- Add barcode index labels and adapters to the fragmented reads for synthesis of libraries for sequencing, using an appropriate method for library preparation.
- Run deep sequencing, for example as 141-nucleotide single-end reads on a high-throughput sequencing platform.
- Map reads to the yeast reference genome under investigation and allow reads to map to multiple regions. For example, use a freely available workflow system27,28 and short-read aligner mapping software29.
- Identify reads from regions of putative eccDNAs using contiguous reads, for example, more than seven contiguous reads (>1 kb) without gaps20.
NOTE: Software is available27,28 for exploring mapped reads at genomic regions of interest.
Results
To validate the Circle-Seq method, three S. cerevisiae CEN.PK populations of 1 x 10¹⁰ cells were screened after cells were grown separately in YPD for ten generations. Chromosomal linear DNA elimination was confirmed by the absence of a qPCR ACT1 signal as described previously20 (data not shown). Purified and enriched eccDNA was sequenced up to 68 million reads (141-nucleotide single-end reads) and mapped to the CEN.PK113-7D reference genome (version 19 June 2012). Recordings of putative eccDNAs from the three samples named C1, C2 and C4 were assigned to genomic regions mapped by contiguous reads longer than 1 kb. Based on 10,000 Monte Carlo simulations, the significance of each region mapped by contiguous reads longer than 1 kb was estimated. From this 79, 159 and 56 regions were annotated as likely eccDNA sequences (p < 0.1, Dataset 1). The number of recorded contiguous reads > 1 kb increased as a function of sequence depth suggesting that even more eccDNA elements would have been recorded if samples had been sequenced further (Figure 2). As expected, the Circle-Seq method extracted numerous reads from a number of known circular DNA elements including the 2µ plasmid, mitochondrial DNA, ribosomal RNA genes on chromosome XII, and the three internal control plasmids pBR322, pUC19 and pUG72 that were spiked into samples just before column purification (Figure 3).
The video shows an example of contiguous reads that mapped to the HXT7_ARS432_HXT6 locus on chromosome IV. Previously, the [HXT6/7circle] was detected by Circle-Seq in ten S288c populations (each with 1 x 10¹⁰ cells) and the circular DNA structure was confirmed by inverse PCR analysis20. The [HXT6/7circle] was also recorded in each of the three CEN.PK populations (Figure 4A). Moreover, most of the common eccDNA genes among replicate samples of CEN.PK overlapped eccDNA genes from the S288c datasets (Figure 4B).
To test the specificity of the Circle-Seq protocol for circular DNA purification, two samples, each with 30 µg genomic DNA, were tested. One sample was supplemented with 100 ng plasmid DNA and eccDNA from both samples were purified by the Circle-Seq protocol. After column separation, the DNA yield was 1.27% (380 ng) for the sample without plasmid (GD) and 1.60% (480 ng) for the sample with plasmid (GD+P). The efficiency of exonuclease treatment was tested for linear DNA content after 29 hr and 72 hr using PCR against ACT1. No samples contained amplified ACT1 (data not shown). A fraction of each exonuclease-treated sample was further amplified by the ø29 polymerase and the products of enzymatic reactions were analyzed by propidium iodide staining (Figure 5A-F) and agarose gel electrophoresis (Figure 5G). Samples after exonuclease treatment showed minimal propidium iodine-stain (Figure 5A-B). The ø29-amplified sample with only genomic DNA revealed thread-like structures (Figure 5C) similar to the control sample (Figure 5E). The ø29-amplified sample that had added plasmid revealed foci (Figure 5D) resembling the plasmid control (Figure 5F). The images indicated that ø29 polymerase enriched for circular DNA over linear DNA. Most linear chromosomal DNA was removed from samples after 29 hr exonuclease treatment (Figure 5A-B, G). However, extensive exonuclease treatment for more than 100 hr and using more than 100 units was needed to remove all chromosomal linear DNA, as ø29-amplified samples still showed a background of thread-like structures after 72 hr exonuclease treatment (Figure 5C-D).
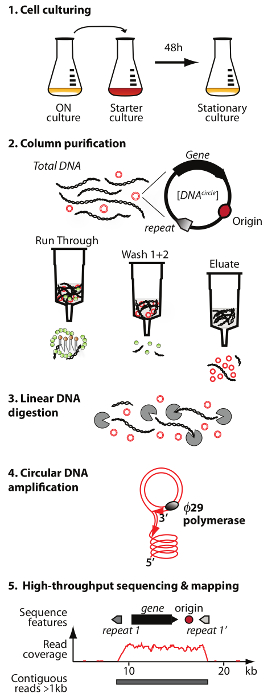
Figure 1. Outline of the Circle-Seq method. The protocol has 5 steps: 1) cell culturing, 2) purification and enrichment of eccDNA by column chromatography, 3) digestion of remaining linear chromosomal DNA in the eluate fraction, 4) amplification of DNA by ø29 DNA polymerase, and 5) sequencing of highly enriched eccDNA and mapping of reads to the S. cerevisiae reference genome. Please click here to view a larger version of this figure.
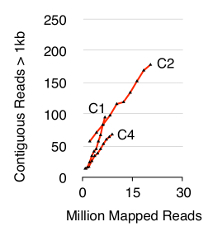
Figure 2. Contiguous reads > 1 kb as function of sequence depth. EccDNA from 1 x 10¹⁰ cells increase as a function of sequence depth (in millions of mapped reads). Shown: biological triplicates from haploid CEN.PK S. cerevisiae populations (C1, C2, C4) separated by 1010 cell divisions. Please click here to view a larger version of this figure.
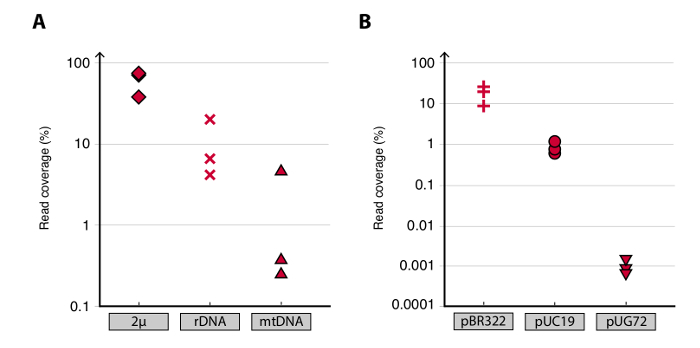
Figure 3. Detection of known circular DNA elements. (A-B) Scatter plots of read coverage (read density) in percent for plasmids in CEN.PK biological replicates C1, C2 and C4. (A) Mapped reads to the endogenous yeast plasmids were: 2µ; [rDNAcircle] (ribosomal RNA genes from chromosome XII); and mtDNA (the mitochondrial DNA). (B) Unique reads mapped to control plasmids. Control plasmids were spiked into samples before column purification. Plasmid ratios per cell were: pBR322 (plus signs) 1:1, pUC19 (circles) 1:50, and pUG72 (triangles) 1:2,500.
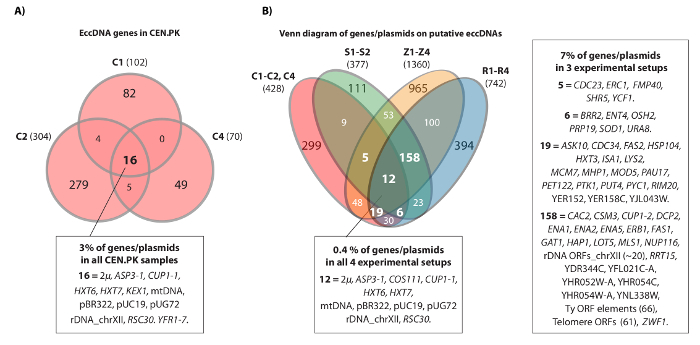
Figure 4. Common eccDNA elements in CEN.PK and S288c. (A) Venn diagram displaying overlap among the 476 genes on 294 eccDNA elements in the three CEN.PK samples (C1, C2, C4). The 16 common overlapping eccDNA genes/plasmids are annotated (all gene names are in Dataset 1). (B) Venn diagram of all recorded genes on putative eccDNAs from the three CEN.PK samples (C1, C2, C4), compared to all recorded genes on putative eccDNAs from 10 S288c samples: S1-S2, R1-R4, Z1-Z4 (see reference20). Shown are 13 biological replicates (S1-S2, R1-R4, Z1-Z4, C1-C3) with genes/plasmids and putative eccDNA regions that overlapped a minimum of 2 strain backgrounds and either 3 or more experimental setups. C samples, CEN.PK; R and Z samples, S288c BY4741; S samples, S288c M3750. Please click here to view a larger version of this figure.
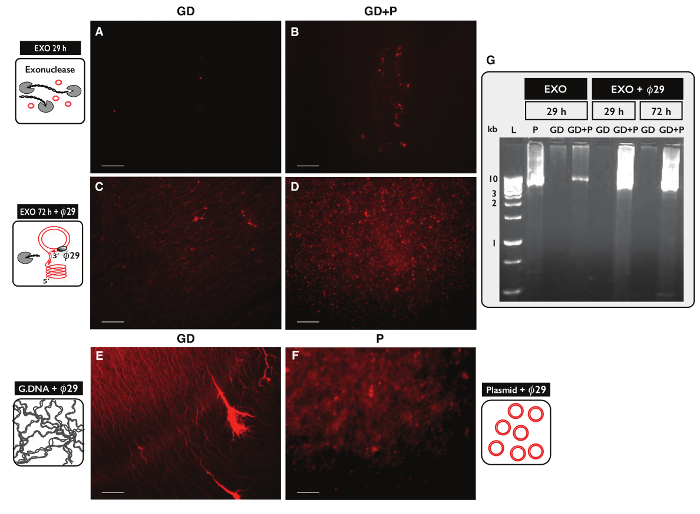
Figure 5. Visualization of DNA samples after exonuclease and ø29 treatment. (A-F) Propidium iodide staining of DNA. Scale bar, 10 µm. (A, C and E) Samples with genomic DNA (GD); (B and D) samples with GD plus plasmid (GD+P). (A-B) After 29 hr exonuclease treatment (EXO 29 h); (C-D) after 72 hr exonuclease treatment followed by ø29 polymerase amplification (EXO 72 h + ø29). (E) Genomic DNA control after e: ø29 polymerase amplification; (F) plasmid control (5.5 kb) after 29 polymerase amplification; (Gø) agarose gel-eletrophoresis. From left: L, 1 kb markers; P, plasmid control (5.5 kb) after EXO 29 hr; GD, after EXO 29 hr (sample as in A); GD+P, after EXO 29 hr (sample as B); GD and GD+P, after EXO 29 hr + ø29; GD and GD+P, after EXO 72 hr + ø29 (sample as in C-D). See Table S1 for extra details. Please click here to view a larger version of this figure.
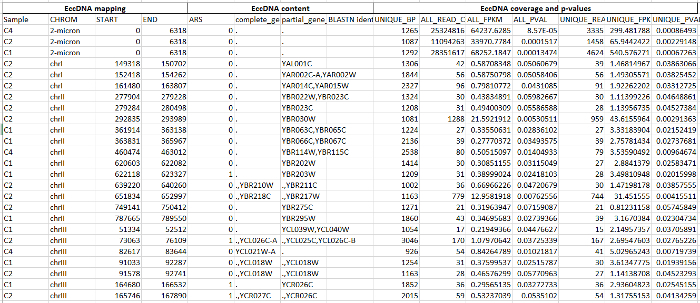
Dataset 1. Potential DNA circularization regions in CEN.PK. Please click here to download this file.
Shown are sequence data and analyses for 348 regions. Columns are A-D, eccDNA mapping. A (first column from left), sample from which putative eccDNA was identified; B, chromosome; C-D, start and end coordinates of putative eccDNAs. E-H, eccDNA content. E, autonomously replicating sequence (ARS) in the region; F, complete gene in the region; G, part of gene included in the region; H, BLASTN-identified gene. I-O, EccDNA coverage and p-values. I, longest region with a uniquely annotated sequence in bp; J, number of all mapped reads; K, coverage of all mapped reads by fragments per kb from a million mapped reads (FPKM); L, p-value for putative eccDNA compared to occurrence by chance from Monte Carlo simulations; M, number of uniquely mapped reads; N-O; as K and L using only uniquely mapped reads (UFPKM). Parameters for mapping of reads and Monte Carlo simulations were as described20.
Discussion
The Circle-Seq method allows genome-scale detection of eccDNA from yeast cells with sequence-level resolution. The method is a mild eccDNA purification that does not require intensive vortex or pipetting and uses column separation by gravity to limit eccDNA breakage that would lead to exonuclease digestion in the subsequent step. These features of the method may be crucial for detecting large eccDNAs that contain gene sequences. Circle-Seq detected numerous eccDNAs including full genes (Dataset 1). It also detected the 86-kb yeast mitochondrial DNA. Thus, this protocol facilitates purification of large circular DNA elements. Keeping the number of DNA extraction steps to a minimum reduces the risk of eccDNA loss and maximizes yield. Based on results for control, spiked-in plasmids, Circle-Seq is highly sensitive, detecting a single circular DNA from 2,500 cells. Furthermore, removing abundant endogenous plasmids such as 2µ plasmid or mitochondrial DNA might significantly enhance sensitivity. Curing of 2µ from yeast cultures has been described30. Alternatively, 2µ and mitochondrial DNA removal might be achieved with a rare-cutting endonuclease, such as SwaI. However, the restriction enzyme step could target other eccDNAs of interest and limit the total eccDNA yield.
Critical steps for eccDNA detection were removal of linear DNA (step 3) and DNA sequencing (step 5) to a proper depth. To record the majority of eccDNAs from a cell population, deep sequencing might be required20. Paired-end sequencing should provide even greater confidence of eccDNA detection, as circular DNA junctions are expected to yield paired-end reads that map discordantly. These discrepancies support the discovery of circular DNA structures and can potentially be used as an additional eccDNA-detection filter.
The Circle-Seq method was validated using three independent S. cerevisiae CEN.PK populations. Detected sequences included previously reported eccDNAs, endogenous plasmids and spiked-in plasmids and hundreds of putative eccDNAs (Dataset 1). These findings support previous Circle-Seq datasets from S. cerevisiae S288c20. The discovery of several eccDNAs common to CEN.PK and S288c populations indicates that these loci have a propensity to exist as circular elements (Figure 4). We have previously shown that the [GAP1circle] is enriched under nitrogen limited conditions in the CEN.PK background8, though evidence of [GAP1circle] in other strain backgrounds has not been found. Finding of eccDNA from the CUP1-1 RSC30, ASP3-1, COS111, and HXT6 HXT7 loci in both S288c and CEN.PK suggests that a predisposition for DNA circularization is conserved between the yeast strains. It remains to be shown if [HXT6/7circle], [ASP3-1circle], [COS111circle], and [CUP1-1 RSC30circle] confer selective advantages to cells or if their existence is merely an effect of high rates of DNA circularization.
Taken together, the results indicate that Circle-Seq is well suited for detecting kilobase-sized eccDNAs and has advantages for identifying eccDNAs with complete genes. Circle-Seq is a highly sensitive method that enables whole genome-scale screens of eccDNAs from yeast. The Circle-Seq method could open a new field of research aimed at elucidating the role of eccDNA in generating gene deletions and amplifications. Given that DNA architecture and structure are largely conserved from eukaryotic yeast to higher eukaryotes, the Circle-Seq method should, in principle, be applicable to all eukaryotic cells, with slight modifications. At present, the method does not appear to have any limitations, although its ability to purify megabase-sized eccDNAs has yet to be shown. In addition, the use of ø29 DNA polymerase, which uses a rolling-circle amplification method31, creates a bias towards smaller eccDNAs making eccDNA quantification more difficult. Circle-Seq detects eccDNAs large enough to carry full genes, making it suitable for studies on double minutes—circular DNA from human somatic cells. Double minutes can contribute to cancer when proto-oncogenes are amplified on these elements32-37. Studies of eccDNAs in germline cells could be used to measure germline mutation rates and assess sperm quality, for example in livestock. Thus, Circle-Seq has the potential to yield insights into the rate at which genetic variation arises in the form of copy number variation, and lead to a novel understanding of diseases that involve gene copy-number variation38-40.
Disclosures
The authors declare that they have no competing financial interests.
Acknowledgements
Thanks to Kenn D. Møller and Claus Sternberg (DTU) for technical assistance and to Tue S. Jørgensen for quantitative PCR analysis.
Materials
| Name | Company | Catalog Number | Comments |
|---|---|---|---|
| Bacto peptone | BD Difco | 211677 | Alternative product can be used. |
| Brilliant III SYBR Green PCR Master Mix | Agilent Technologies | 600882 | For qPCR analysis. Alternative product can be used. |
| Dextrose (D-glucose) | Carl Roth | HN06.4 | Alternative product can be used. |
| Disruptor Beads, 0.5 mm | Scientific Industries, Inc. | SI-BG05 | Glass beads to disrupt plasma cell membranes. Alternative product can be used. |
| Ethidium bromide | Carl Roth | 2218.2 | Agarose gel stain for detecting DNA/RNA. |
| GeneJet plasmid miniprep kit | Thermo Fisher | K0502 | Plasmid purifcation from bacteria. Alternative product can be used. |
| NotI, FastDigest | Life Technologies - Thermo Fisher Scientific, USA | FD0594 | Endonuclease. Alternative product can be used. |
| Plasmid Mini AX kit | A&A Biotechnology, Poland | 010-50 | Plasmid purifcation kit used to purify eccDNA. |
| Plasmid-Safe ATP-dependent DNase kit | Epicentre, USA | E3105K | ATP-dependent exonuclease kit. Alternative product can be used. |
| Propidium iodide | Sigma-Aldrich, USA | 81845 | Alternative product can be used. |
| pUG6 plasmid | EUROSCARF, Germany | P30114 | Marker gene: loxP-PAgTEF1-kanMX-TAgTEF1-loxP. |
| QIAGEN genomic-tip 100/G | Qiagen, USA | 13343 | Genomic DNA purifcation from yeast. Alternative product can be used. |
| REPLI-g Mini Kit protocol | Qiagen, USA | 150023 | Amplification of eccDNA by the phi29 polymerase. |
| Yeast extract | BD Difco | 210929 | Alternative product can be used. |
| Zymolyase 100T (Lyticase, Yeast Lytic Enzyme) | Nordic BioSite, Sweden | Z1004-3 | Alternative product can be used. |
| Data access to sequence files | European Nucleotide Archive | EccDNA dataset from Saccharomyces cerevisiae CEN.PK113-7D. Study accession number PRJEB9684. 2nd accession number is ERP010820. Locus tag prefix is BN2032. | |
| Name | Company | Catalog Number | Comments |
| Strains | |||
| Saccharomyces cerevisiae CEN.PK113-7D | Genotype MATa MAL2-8c SUC2 | ||
| Saccharomyces cerevisiae yeast deletion library pool | EUROSCARF, Germany | S288c BY4741 pool of 4400 viable single-gene deletion mutants disrubted by KanMX module. Genotypes MATa his3Δ1 leu2Δ0 met15Δ0 ura3Δ0 genexxx::KanMX. | |
| Name | Company | Catalog Number | Comments |
| Equipments | |||
| DNA Spectrophotometer | NanoDrop 1000 Spectrophotometer, Thermo Fisher | Measuring DNA concentration. Alternative product can be used. | |
| Fluorescence microscopy | Nikon Optronics Magnafire. Red excitation fluorescence filter, 663-738 nm. | Alternative product can be used. | |
| Robotic library-build system | Apollo 324, IntegenX Inc. | DNA library preparation. Alternative product can be used. | |
| Sequencing platform | Illumina HiSeq 2000 platform, Illumina Inc. | DNA sequencing. Alternative product can be used. | |
| Ultrasonicator | Covaris LE220, microTUBE AFA Fiber tubes | Alternative product can be used. | |
| Name | Company | Catalog Number | Comments |
| Methods | |||
| 2% YPD media | Mix 10 g Dextrose, 10 g Yeast extract, 20 g Bacto peptone and add H2O to a total volume of 1000 ml and autoclave. | ||
| Circle-Seq test on genomic DNA | Genomic DNA was purified (Qiagen) from a pool of the yeast deletion library (Euroscarf). The DNA concentration was measured by nanodrop and 30 µg genomic DNA was pipetted into two micro centrifuge tubes. One micro centrifuge tube was supplemented with 100 nanogram plasmid (pUG6). The DNA samples were purified by Circle-Seq, omitting the protocol steps 1.1-1.3 and 1.5-1.7. The eluted DNA concentrations were measured by nanodrop and the entire DNA yield from sample GD and GD+P was treated with exonuclease for a period of 29 hours. A 10% fraction was collected for phi29-amplification and PCR analysis, while the remaining DNA was subjected to 72 hour exonuclease treatment. The samples were analyzed for linear DNA content by PCR, using the ACT1 gene as chromosomal marker. A 5% fraction of each of the exonuclease treated samples was amplified by the phi29 DNA polymerase for 16 hours (Qiagen). The presence of DNA in each sample was examined by loading an equal amount (7 µl) in wells on an 0.5 µg/ml ethidium-bromide 0.9% agarose gel after running gel-electrophoresis. | ||
| Mapping software | Bowtie2 aligner, John Hopkins University | Ultrafast short read alignment. Reference: 29. | |
| Propidium iodide stain | Images of propidium iodine stained DNA were captured by fluorescence microscopy at 100x magnification (100x/1.30 oil, Nikon) in the RFP channel (red excitation fluorescence filter, 663-738 nm) using identical exposition time (5 seconds). | ||
| Workflow bioinformatic system | Galaxy, Open source. | A free web-based platform for data intensive biomedical research. References: 27-28. |
References
- Kugelberg, E., Kofoid, E., et al. The Tandem Inversion Duplication in Salmonella enterica.: Selection Drives Unstable Precursors to Final Mutation Types. Genetics. 185 (1), 65-80 (2010).
- Reams, A. B., Kofoid, E., Savageau, M., Roth, J. R. Duplication Frequency in a Population of Salmonella enterica. Rapidly Approaches Steady State With or Without Recombination. Genetics. 184 (4), 1077-1094 (2010).
- Smith, C. A., Vinograd, J. Small polydisperse circular DNA of HeLa cells. Journal of Molecular Biology. 69 (2), 163-178 (1972).
- Carroll, S. M., DeRose, M. L., et al. Double Minute Chromosomes Can Be Produced from Precursors Derived from a Chromosomal Deletion. Molecular and cellular biology. 8 (4), 1525-1533 (1988).
- Cohen, S., Yacobi, K., Segal, D. Extrachromosomal Circular DNA of Tandemly Repeated Genomic Sequences in Drosophila. Genome research. 13 (6A), 1133-1145 (2003).
- Horowitz, H., Haber, J. E. Identification of Autonomously Replicating Circular Subtelomeric Y' Elements in Saccharomyces cerevisiae. Molecular and cellular biology. 5 (9), 2369-2380 (1985).
- Moore, I. K., Martin, M. P., Dorsey, M. J., Paquin, C. E. Formation of Circular Amplifications in Saccharomyces cerevisiae by a Breakage-Fusion-Bridge Mechanism. Environmental and molecular mutagenesis. 36 (2), 113-120 (2000).
- Gresham, D., Usaite, R., Germann, S. M., Lisby, M., Botstein, D., Regenberg, B. Adaptation to diverse nitrogen-limited environments by deletion or extrachromosomal element formation of the GAP1 locus. Proceedings of the National Academy of Sciences of the United States of America. 107 (43), 18551-18556 (2010).
- Windle, B., Draper, B. W., Yin, Y. X., O'Gorman, S., Wahl, G. M. A central role for chromosome breakage in gene amplification, deletion formation, and amplicon integration. Genes & development. 5 (2), 160-174 (1991).
- Gresham, D., Ruderfer, D. M., et al. Genome-Wide Detection of Polymorphisms at Nucleotide Resolution with a Single DNA Microarray. Science. 311 (5769), 1932-1936 (2006).
- Kidd, J. M., Cooper, G. M., et al. Mapping and sequencing of structural variation from eight human genomes. Nature. 453 (7191), 56-64 (2008).
- Gresham, D., Desai, M. M., Botstein, D., Dunham, M. J. The Repertoire and Dynamics of Evolutionary Adaptations to Controlled Nutrient-Limited Environments in Yeast. PLoS Genetics. 4 (12), 1-19 (2008).
- Lang, G. I., Botstein, D., Desai, M. M. Genetic Variation and the Fate of Beneficial Mutations in Asexual Populations. Genetics. 188 (3), 647-661 (2011).
- van Loon, N., Miller, D., Murnane, J. P. Formation of extrachromosomal circular DNA in HeLa cells by nonhomologous recombination. Nucleic Acids Research. 22 (13), 2447-2452 (1994).
- Vinograd, J., Lebowitz, J. Physical and Topological Properties of Circular Dna. Journal of General Physiology. 49 (6P2), 103(1966).
- Shibata, Y., Kumar, P., et al. Extrachromosomal MicroDNAs and Chromosomal Microdeletions in Normal Tissues. Science. 336 (6077), 82-86 (2012).
- Dillon, L. W., Kumar, P., et al. Production of Extrachromosomal MicroDNAs Is Linked to Mismatch Repair Pathways and Transcriptional Activity. Cell Reports. 11 (11), 1749-1759 (2015).
- Li, L. L., Norman, A., Hansen, L. H., Sørensen, S. J. Metamobilomics - our knowledge on the pool of plasmid encoded traits in natural environments using high-throughput sequencing. Clinical microbiology and infection : the official publication of the European Society of Clinical Microbiology and Infectious Diseases. 18, 5-7 (2012).
- Brown Kav, A., Sasson, G., Jami, E., Doron-Faigenboim, A., Benhar, I., Mizrahi, I. Insights into the bovine rumen plasmidome. Proceedings of the National Academy of Sciences of the United States of America. 109 (14), 5452-5457 (2012).
- Møller, H. D., Parsons, L., Jørgensen, T. S., Botstein, D., Regenberg, B. Extrachromosomal circular DNA is common in yeast. Proceedings of the National Academy of Sciences of the United States of America. , 201508825(2015).
- Drubin, D. G., Miller, K. G., Botstein, D. Yeast Actin-Binding Proteins - Evidence for a Role in Morphogenesis. The Journal of cell biology. 107 (6), 2551-2561 (1988).
- Magdolen, V., Drubin, D. G., Mages, G., Bandlow, W. High levels of profilin suppress the lethality caused by overproduction of actin in yeast cells. FEBS letters. 316 (1), 41-47 (1993).
- Sandrock, T. M., Brower, S. M., Toenjes, K. A., Adams, A. Suppressor analysis of fimbrin (Sac6p) overexpression in yeast. Genetics. 151 (4), 1287-1297 (1999).
- Blanco, L., Bernad, A., Lázaro, J. M., Martìn, G., Garmendia, C., Salas, M. Highly Efficient DNA Synthesis by the Phage ø29 DNA Polymerase. The Journal of biological chemistry. 264 (15), 8935-8940 (1989).
- Dean, F. B. Rapid Amplification of Plasmid and Phage DNA Using Phi29 DNA Polymerase and Multiply-Primed Rolling Circle Amplification. Genome research. 11 (6), 1095-1099 (2001).
- Hutchison, C. A., Smith, H. O., Pfannkoch, C., Venter, J. C. Cell-free cloning using ø29 DNA polymerase. Proceedings of the National Academy of Sciences of the United States of America. 102 (48), 17332-17336 (2005).
- Goecks, J., Nekrutenko, A., Taylor, J., Galaxy Team, T. Galaxy: a comprehensive approach for supporting accessible, reproducible, and transparent computational research in the life sciences. Genome Biology. 11 (8), 86(2010).
- Giardine, B., Riemer, C., et al. Galaxy: A platform for interactive large-scale genome analysis. Genome research. 15 (10), 1451-1455 (2005).
- Langmead, B., Salzberg, S. L. Fast gapped-read alignment with Bowtie 2. Nature Methods. 9 (4), 357(2012).
- Tsalik, E. L., Gartenberg, M. R. Curing Saccharomyces cerevisiae of the 2 micron plasmid by targeted DNA damage. Yeast. 14 (9), Chichester, England 847-852 (1998).
- Norman, A., Riber, L., Luo, W., Li, L. L., Hansen, L. H., Sørensen, S. J. An Improved Method for Including Upper Size Range Plasmids in Metamobilomes. PLoS ONE. 9 (8), e104405(2014).
- Storlazzi, C. T., Lonoce, A., et al. Gene amplification as double minutes or homogeneously staining regions in solid tumors: Origin and structure. Genome research. 20 (9), 1198-1206 (2010).
- Von Hoff, D. D., Needham-VanDevanter, D. R., Yucel, J., Windle, B. E., Wahl, G. M. Amplified human MYC localized to replicating submicroscopic circular DNA molecules. Proceedings of the National Academy of Sciences of the United States of America. 85 (13), 4804-4808 (1988).
- Raymond, E., Faivre, S., et al. Effects of hydroxyurea on extrachromosomal DNA in patients with advanced ovarian carcinomas. Clinical cancer research : an official journal of the American Association for Cancer Research. 7 (5), 1171-1180 (2001).
- Shimizu, N. Extrachromosomal Double Minutes and Chromosomal Homogeneously Staining Regions as Probes for Chromosome Research. Cytogenetic and genome research. 124 (3-4), 3-4 (2009).
- Eckhardt, S. G., Dai, A., Davidson, K. K., Forseth, B. J., Wahl, G. M., Von Hoff, D. D. Induction of differentiation in HL60 cells by the reduction of extrachromosomally amplified c-myc. Proceedings of the National Academy of Sciences of the United States of America. 91 (14), 6674-6678 (1994).
- Vogt, N., Lefèvre, S. -H., et al. Molecular structure of double-minute chromosomes bearing amplified copies of the epidermal growth factor receptor gene in gliomas. Proceedings of the National Academy of Sciences of the United States of America. 101 (31), 11368-11373 (2004).
- Ahn, K., Gotay, N., et al. High rate of disease-related copy number variations in childhood onset schizophrenia. Molecular psychiatry. 19 (5), 568-572 (2013).
- Girirajan, S., Johnson, R. L., et al. Global increases in both common and rare copy number load associated with autism. Human molecular genetics. 22 (14), 2870-2880 (2013).
- Vogt, N., Gibaud, A., Lemoine, F., de la Grange, P., Debatisse, M., Malfoy, B. Amplicon rearrangements during the extrachromosomal and intrachromosomal amplification process in a glioma. Nucleic Acids Research. , (2014).
Reprints and Permissions
