An efficient and simple methodology for computer-based analysis of nematode swimming behavior in liquid is described. The method requires little to no investment for C. elegans laboratories. The hardware used is standard, and the computer software for the behavioral analysis (CeleST) is an open source one.
Method Article
Automated Analysis of C. elegans Swim Behavior Using CeleST Software
In This Article
Summary
Abstract
Dissecting the neuronal and neuromuscular circuits that regulate behavior remains a major challenge in biology. The nematode Caenorhabditis elegans has proven to be an invaluable model organism in helping to tackle this challenge, from inspiring technological approaches, building the human brain connectome, to actually shedding light on the specific molecular drivers of basic functional patterns. The bulk of the behavioral studies in C. elegans have been performed on solid substrates. In liquid, animals exhibit behavioral patterns that include movement at a range of speeds in 3D, as well as partial body movements, such as a posterior curl without anterior shape change, which introduce new challenges for quantitation. The steps of a simple procedure, and use of a software that enables high-resolution analysis of C. elegans swim behavior, are presented here. The software, named CeleST, uses a specialized computer program that tracks multiple animals simultaneously and provides novel measures of C. elegans locomotion in liquid (swimming). The measures are mostly grounded in animal posture and based on mathematics used in computer vision and pattern recognition, without computational requirements for threshold cut-offs. The software tool can be used to both assess overall swimming prowess in hundreds of animals from combined small batch trials and to reveal novel phenotypes even in well-characterized genetic mutants. The preparation of specimens for analysis with CeleST is simple and low-tech, enabling wide adaptation by the scientific community. Use of the computational approach described here should therefore contribute to the greater understanding of behavior and behavioral circuits in the C. elegans model.
Introduction
Defining how genetics, epigenetics, experience, and environment influence behavior is a major challenge in modern biology. Simple, genetically amenable models that can be computationally tracked and measured can make critical contributions toward this goal. The nematode Caenorhabditis elegans is one such model. The purpose of this article is to demonstrate how C. elegans swimming locomotion can be tracked and quantitated to extract information on eight novel features with biological relevance.
C. elegans has a relatively short lifespan of about 2 - 3 w and a reproductive period of approximately 4 d at 20 °C1,2. In standard laboratory cultures, this microscopic nematode is grown on Petri plates containing Nematode Growth Media (NGM) that are spread with a bacterial food source3,4. WT N2 animals move actively in elegant sinusoidal waves on agar-filled plates; they change movement rates when roaming (food seeking), dwelling (browsing), or recovering from a meal (inactive satiety quiescence)5. Impairment6 or age7-12 can also dramatically alter movement on plates.
Genes that modulate behavior, healthspan or aging, can be functionally characterized by analyzing C. elegans movement patterns or locomotion. One approach to measure healthspan is to classify aging adults into three categories (e.g., A, B, and C) according to their locomotion on plates, with vigorous physical activity being class A and paralysis being class C7,8,13. Although such qualitative sorting is useful to reveal differences in physical fitness, the categories are broad without clear boundaries and thus their scoring is subject to experimenter bias.
A growing number of trackers have elevated the objectivity, sophistication, and precision of the analysis of C. elegans movement on solid media14-18. C. elegans locomotion on plates is mostly restricted to the plane in which the animal makes contact with the solid surface of the media. (C. elegans can also induce exploration by lifting the head away from the rest of the body that is still in contact with a solid surface, positioning the body in multiple planes. However, this behavior is unusual.) When placed in liquid, this nematode initiates an undulatory movement, or swimming, that features more extensive dimensional movement, a greater range of speed and depth of motion, and an increased incidence with age of anterior moving differently from posterior as compared to animals on solid surfaces. As a quick analysis of physical fitness and response to new environment, an experimenter can place an individual animal into a liquid drop and score its frequency of body bends under the dissecting scope. Video recording can facilitate present and future scorings of the swimming vigor of the animal. However, the manual approach limits the number of features that can be scored, and is fully constrained to scoring one animal at a time.
Locomotion in liquid has been less explored than locomotion on solid media. Indeed, there are few software options that are robust and easy to implement in the laboratory to measure locomotion in liquid19-24. The software CeleST (C. elegans Swim Test) offers simplicity of use and mathematical-based measures that deliver data (curvature scores) directly relevant to the nature of the motion8; (detailed description of features and advantages in Restif et al.8). Moreover, computational analysis enables the elucidation of phenotypic features that are impossible for the human eye to score. Here, data that exemplify the resolution of this analysis approach are presented and an easy to implement protocol to record swim trials for subsequent CeleST analysis is described.
Protocol
1. Nematode Growth and Handling
- Grow C. elegans on standard Petri plates containing NGM spotted with OP50-1 Escherichia coli as food source1-3.
- Keep cultures in an incubator that maintains the desired temperature. C. elegans grows well from 15 to 25 °C, with 20 °C being the standard growth temperature.
NOTE: Swimming is a robust phenotype, however swim vigor can be affected by environmental factors including contamination on plates and overheating of cultures and slides. Strong efforts to maintain stable conditions should be made. - Use a homemade nematode pick made of a platinum wire flame-sealed into a glass rod to handle transfer of single animals4.
2. Set up for Swim Analysis
- Use an integrated system consisting of a stereomicroscope, digital CCD camera, and digital video recording software. The CeleST software can be used on a separate computer.
- Cover the microscope with a dark cloth (e.g., felt) to prevent glare in the swim drop area on the microscope slide and improve image quality.
- Adjust the microscope's working distance and magnification to full view of the swim area, and the base mirror to get sharp contrast of the animals against the background. Set the illumination to dark-field to visualize the bodies of the adults as white against the black background, which works very well for computational visualization and tracking with the swim analysis software.
- Take care to keep the work area, microscope slide, and swim drop very clean. Debris can interfere with the analysis by occluding the free swimming of adults, and thin threads of fiber can be detected as nonmoving animals during tracking.
3. Animal Preparation for Analysis of Physical Fitness in Liquid
- Pipette 60 µL of 1x M9 buffer into a 10 mm ring preprinted on a microscope slide. Make sure the drop entirely covers the inside area of the ring. The software extracts more swimming information using this drop size contained on a slide than it would if utilizing multiwell plates.
- Pick single adult nematodes and transfer them into the drop of 1x M9 buffer, minimizing the transport of bacteria that can cloud the liquid. Minimize bacteria by first placing the animals for transfer to a side of the plate that does not contain much bacterial lawn, letting them crawl, and then gently lifting them up.
- When transferring the nematodes into the drop, use a dissecting scope close to the analysis station to reduce the length of swim time, which can affect the behavior of the animals25.
- Place only 4 adults in the drop if they move vigorously and cross paths often. As guidance to minimize overlapping swimmers (which confounds computational analysis), consider placing 4 animals per drop when they are as active as young, healthy WT adults and 5 animals per drop when they are older and show less vigor.
NOTE: Healthy WT nematodes instinctively start swimming soon after being placed in liquid. With the aid of a nematode pick, gently separate the adults in the drop if they clump.
4. Analysis of Physical Fitness in Liquid — Video Recording of Swimming
- Position the slide loaded with adults on the base of the microscope to record their swimming. 30 s videos capture details of an individual animal's behavior in liquid (Video 1), and sampling of large numbers of such records is easily accomplished when aided by CeleST software8,26; however, longer swim periods may be ideal for other specific behavioral studies25. Importantly, make sure to maintain the same magnification throughout all recordings since magnification differences affect swimming analysis and will bias comparison.
NOTE: These steps are provided as guidance using the digital video recording software listed in the Table of Materials; VirtualDub open access software might substitute, although we have not tested this.- Use the following settings as guidance for successful swim analysis: image size of 696 x 520 pixels, image resolution of 0.02 mm/pixel, and a rate of 18 frames/s. Higher resolution versions of these settings may facilitate tracking but will not affect the measures calculated by the program.
NOTE: The swim zone provided by the 60 µL drop of 1x M9 buffer on the microscope slide does not have much depth, which minimizes upward and downward swimming motion.
- Use the following settings as guidance for successful swim analysis: image size of 696 x 520 pixels, image resolution of 0.02 mm/pixel, and a rate of 18 frames/s. Higher resolution versions of these settings may facilitate tracking but will not affect the measures calculated by the program.
- Under Settings, go to 'Recording', set 'Limit Sequence Size' to '545 frames on disk'. Under the same heading, check the 'Use Recording Manager' box. Click the 'Edit current recording script...' button, and under 'Commands', select 'Grab Frame', and under 'Stop Conditions', enter 'Stop after 0:00:30.00'.
- To record, select 'New Sequence in RAM' under the home heading, then press the red 'Record' button. The software will grab 545 frames over 30 s with the digital camera and hold them in RAM memory.
5. Analysis of Physical Fitness in Liquid — Video Treatment
- Fragment the video into a sequence of image frames by clicking the home heading and selecting 'Export full sequence to…' in the video recording software.
NOTE: The digital video recording software can save the frames as .bmp, .jpg, .tif, or .png, all of which can be read by the swim analysis program presented here. Note that .tif files use more storage space, but some formats such as .jpg may degrade image quality. - Launch the swim analysis program from MATLAB by clicking the run button.
- On the home screen of the swim analysis program, use the 'Add one video' or 'Add multiple videos' buttons to upload sequences of image frames one at a time or in groups while attaching relevant labels such as genotype, date, trial and duration. The software creates a database of the labeled sequences.
- Enable simultaneous tracking of multiple animals in the uploaded sequences by clicking '1. Process videos'. In the new screen, select the desired videos in the left box and click, 'Add to the list'. For each video, click its name in the top right list to display the first image of the video in the bottom right. Demarcate the swim zone by selecting 3 points inside the ring, and initiate processing by clicking 'Process all the videos listed above'. View progress of the processing at the center bottom.
- Once completed, 'Close' the video processing screen.
6. Analysis of Physical Fitness in Liquid — Measurement
- Click on '2. Compute measures' to open a new screen where the processed videos can be uploaded, one at a time, to validate or reject the tracking of single animals. Videos that have been processed will appear in the list on the left where the video name can be clicked to upload that video.
- Use this manual step to focus on areas of missed tracking (red blocks) in contrast to successful tracking (green blocks).
NOTE: Alternatively, one can rely on the automated output of valid tracking since the software has a robust tracking system (94.1% validity as observed in 2,020 animals from 404 videos8).- Find the 'Validity of the segmented body' in the first color bar across the screen in the bottom half. The percentage of 'Valid frames' is in green, and the percentage of 'Rejected frames' is in red. ≥80% of valid frames imply that the tracking information used to compute measures comes from at least 432 frames out of 540 in a 30 s swim trial recorded at 18 frames/s.
- Easily navigate and modify blocks of valid/rejected frames utilizing the 'Next block', 'Switch validity', 'Split block', and 'Isolate frame' options. In the rare event that 2 animals crossed paths in an uncrowded swim zone, switch their identification numbers over a specific frame range with the 'Switch' button.
- View the bar graphs in the bottom half of the screen for additional information on tracking and overlapping performances. The length of the segmented body (animal's body length per frame) correlates with overlapping incidences.
- If any bright spots on the video interfere with the analysis, adjust bright areas in the swim zone by selecting the 'Glare zones' function.
- Click on 'Save and Compute measures' to save the validity input before uploading another processed video. At this stage the software computes, in the background (not shown to the user), curvature maps of the swim performance of individual animals and the parameters indicated below (Video 2).
NOTE: The parameters measured that are focused on here are described in Table 1. The Wave initiation rate, body wave number, asymmetry, stretch, and curling are calculated based on the curvature maps that the software computes for the animals; the Travel speed, Brush stroke, and Activity index parameters are not based on curvature maps. - Click 'Close' to exit the 'Compute measures' screen.
7. Analysis of Physical Fitness in Liquid — Output of Results
Note: The software can report on multiple measures of the swim motion, which cover from overt to very subtle behavioral traits not readily scored by eye (Videos 3 and 4). Here the focus is on 8 parameters that typically show a good dynamic range: Wave initiation rate, Body wave number, Asymmetry, Stretch, Curling, Travel speed, Brush stroke, and Activity index.
- On the home screen of the program, click on '3. Display results' to obtain the analysis output.
- Create sample groups for statistical treatment by selecting the desired analyzed sequences of frames in the left box and moving them into a new or existing sample group by clicking the 'Add to the selected sample' or 'Add to new Sample' buttons.
- Click 'Show graphs for these samples' to go to a second screen that displays the graphs and key statistics of the samples for each of the 8 parameters by selection on the top of the screen.
- If desired, adjust the representation of the bar graphs at the top left of the screen using the 'Colors', '# of histograms', and '# of worms' selectors.
- Use '2D histograms' to plot combinations of any two parameters via the 'Measure on the X axis' and 'Measure on the Y axis' drop down menus on the left of the screen. Click 'Close' to exit and return to the 'Display results' screen.
- Use the 'Export…' button on the top left of the screen to save detailed numerical data as .csv file to open and further manipulate in a spreadsheet program.
- 'Close' the 'Display results' screen to go back to the home screen and click 'Quit' to ensure saving of the database containing the analyzed video sequences.
Results
By analyzing locomotion in liquid (swimming), phenotypes that are not readily apparent on solid media (crawling) can be elucidated. To quantitate swimming locomotion we developed specific software that measures ten novel parameters of swimming behavior8. The eight most useful of these parameters are described in detail in Table 1. These parameters are named Wave initiation rate, Body wave number, Asymmetry, Stretch, Curling, Travel speed, Brush stroke, and Activity index. Studies exemplifying the power of the software have defined the functional decline of hundreds of aging adults with WT, behavioral or longevity mutant backgrounds8, and have analyzed the well-studied longevity mutants age-1(hx546) and daƒ-16(mgDƒ50), which harbor mutations that disrupt the normal insulin signaling pathway. The gene age-1 encodes for a phosphatidylinositide 3-kinase (PIK3) catalytic subunit, and, when it harbors the mutation hx546, causes lifespan extension and stress resistance27-29. The gene daƒ-16 encodes for a forkhead box O (FOXO) transcription factor that shortens lifespan and impairs the stress response when deleted30-33.
Certain parameters of swimming such as Wave initiation rate, Travel speed, Brush stroke and Activity index gradually declined with age even in favorable genetic backgrounds (Figure 1). In line with current knowledge, long-lived age-1(hx546) mutants showed a more vigorous physical performance than WT at advanced and extremely old ages. Also as anticipated, short-lived daƒ-16(mgDƒ50) mutants displayed compromised performance, especially at extremely old ages. Remarkably, it was only under the scrutiny of the CeleST computer vision and mathematical algorithm package that the superior swim performance of age-1(hx546) mutants was detectable at the onset of adulthood. The fact that age-1(hx546) results in enhanced physical performance at young adult life suggests that this mutation affects normal development and/or young adult phenotype in a way not previously appreciated (Figure 1).
Body wave number, Asymmetry, Stretch, and Curling parameters trended up with age in WT and aging mutant adults (Figure 2). Interestingly, the resolution level of the software revealed finer behavioral traits like the sustained symmetry of age-1(hx546) mutants throughout their lifespan and the inability of extreme old daƒ-16(mgDƒ50) mutants to stretch and curl up to the extent that same-age WT and age-1(hx546) adults do.
In addition to the overall inevitable loss of physical performance due to age, each individual adult displays a unique progression pattern through the aging process, even when genetics and environment are virtually homogeneous7. (By controlling genetics and environment, the possible confounding effects of these factors are minimized, unveiling the significant contribution of stochasticity to age-related degeneration.) A synchronized C. elegans population of similar genetic background kept in a controlled environment still contains a mix of different classes of individuals according to their aging peculiarities. Although all start as healthy adults, some rapidly lose their physical fitness (bad agers, class C) while others maintain vigor for longer period of time (graceful agers, class A). Bad agers thus appear to have a considerably shorter healthspan than graceful agers.
As further detailed in our study8, graceful agers maintained youthful physical fitness as observed by comparison with the swim profile of much younger adults (Figures 3, 4 and 5). This sustained fitness is comparable to the physical performance of long-lived age-1(hx546) mutants at post-reproductive age (D 11) (Figures 1 and 2). On the contrary, bad agers dramatically lost much of their physical capacity soon after reproduction, performing at levels similar to those of extreme old and progeric daƒ-16(mgDƒ50) adults (Figures 1 - 4). These similarities can be drawn by gross comparison, however particular signatures are readily noticeable at a closer look. For instance, although there is some correlation between the extent of both stretch and curling in extreme old wild types and aging mutants (Figure 2), this relation is not observed in bad agers (Figures 4 and 5), which show higher propensity to curl up but not to stretch in the samples tested. The software we present thus adds dimension to the analysis of physical fitness or locomotory capacity by providing the tools for more sophisticated studies that were not tractable before. In summary, CeleST provides comprehensive readouts in the form of eight novel measures highlighted here, which define the behavioral fingerprint of specific genetic, epigenetic, and environmental backgrounds, enabling the identification of unique and common parameter patterns that can be the signatures of specific conditions (environmental, pharmacological, nutritional), biological processes, or organism states such as healthspan.
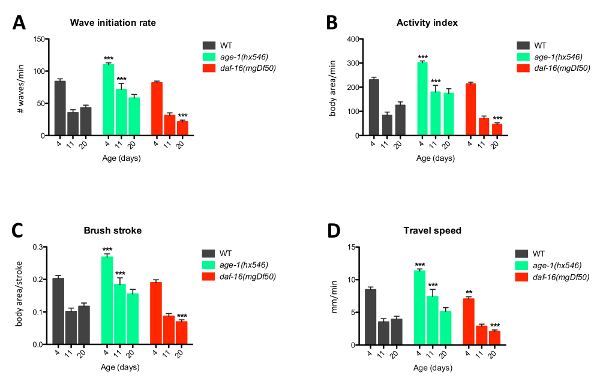
Figure 1: CeleST Software Reports on Wave Initiation Rate (A), Activity Index (B), Brush Stroke (C) and Travel Speed (D) for WT, age-1(hx546), and daƒ-16(mgDƒ50) Adults on D 4 (young adulthood), 11 (post-reproduction) and 20 (extreme old). '#' in y axis means 'number'. WTs are colored in grey, age-1 in green and daƒ-16 in red. Error bars are the standard error of the mean (SEM). Same-age WT and aging mutants were compared for statistical significance using one-way ANOVA followed by Dunnett's multiple comparison test. **, p = 0.001 - <0.01; ***, p = 0.0001 - <0.001. n = 62 in each data point from four independent trials. Note that here, and for Figure 2, each individual 30 s video is made with 4 animals, and for each trial we score a total of 16 animals from 4 swim videos, this is done for 4 biological replicates for each data point shown. Please click here to view a larger version of this figure.
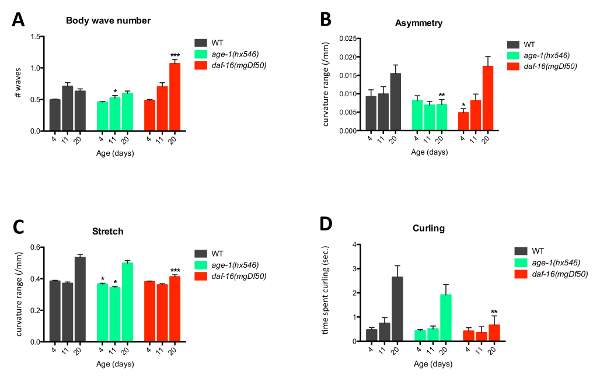
Figure 2: Software Reports on Body Wave Number (A), Asymmetry (B), Stretch (C), and Curling (D) for WT, age-1(hx546) and daƒ-16(mgDƒ50) Adults on D 4 (young adulthood), 11 (post-reproduction) and 20 (extreme old). '#' in y axis means 'number'. WT are colored in grey, age-1 in green, and daf-16 in red. Error bars are the standard error of the mean (SEM). Same-age WT and aging mutants were compared for statistical significance using one-way ANOVA followed by Dunnett's multiple comparison test. *, p = 0.01 - <0.05; **, p = 0.001 - <0.01; ***, p = 0.0001 - <0.001. n = 62 in each data point from four independent, 30 s swim trials. Please click here to view a larger version of this figure.
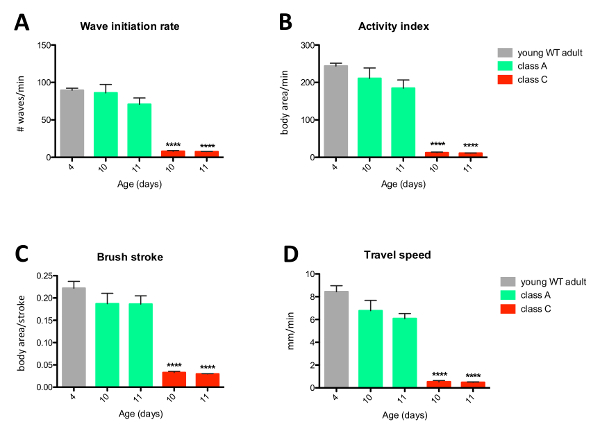
Figure 3: Software Reports on Wave Initiation Rate (A), Activity Index (B), Brush Stroke (C), and Travel Speed (D) for young WT adults (D 4), and Same-age Graceful and Bad Agers (D10 and 11). '#' in y axis means 'number'. Young WTs are colored in grey, class A graceful agers in green, and class C bad agers in red. Error bars are the standard error of the mean (SEM). Class A graceful agers and class C bad agers were compared to D 4 young adults using one-way ANOVA followed by Dunnett's multiple comparison test. ****, p <0.0001. n = 27 in each data point from two independent, 30 s swim trials. Graph is slightly modified from Restif et al. (2014)8, which was published under the Creative Commons Attribution (CC BY) license http://creativecommons.org/licenses/by/4.0/. Please click here to view a larger version of this figure.
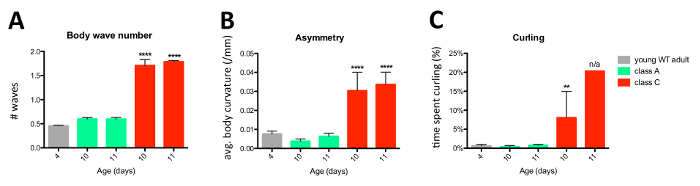
Figure 4: Software Reports on Body Wave Number (A), Asymmetry (B), and Curling (C) for Young WT Adults (D 4), and Same-age graceful and Bad Agers (D 10 and 11). '#' in y axis means 'number'. Young WTs are colored in grey, class A graceful agers in green and class C bad agers in red. Error bars are the standard error of the mean (SEM). Class A graceful agers and class C bad agers were compared to D 4 young adults using one-way ANOVA followed by Dunnett's multiple comparison test. **, p = 0.001 - <0.01; ****, p <0.0001; n/a, non applicable since only one animal out of the total sample size curled. n = 27 in each data point from two independent, 30 s swim trials. Graph is slightly modified from Restif et al. (2014)8, which was published under the Creative Commons Attribution (CC BY) license http:/creativecommons.org/licenses/by/4.0/. Please click here to view a larger version of this figure.
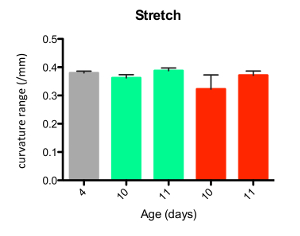
Figure 5: Software Report on Stretch for Young WT adults (D 4), and Same-age Graceful and Bad Agers (D 10 and 11). Young WTs are colored in grey, class A graceful agers in green and class C bad agers in red. Error bars are the standard error of the mean (SEM). Class A graceful agers and class C bad agers were compared to D 4 young adults using one-way ANOVA followed by Dunnett's multiple comparison test. n = 27 in each data point from two independent trials. Graph is slightly modified from Restif et al. (2014)8, which was published under the Creative Commons Attribution (CC BY) license http:/creativecommons.org/licenses/by/4.0/. Please click here to view a larger version of this figure.
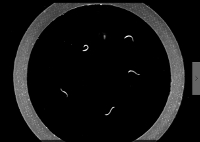
Video 1: Swimming of a Representative group of C. elegans adults. Please click here to view this video. (Right-click to download.)
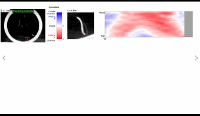
Video 2: CeleST Software Computation of individual Curvature Maps of the Swim Performances of the tested Animals. Curvature maps are computed in the background; they do not appear in the software interface with the user. Please click here to view this video. (Right-click to download.)
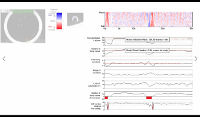
Video 3: Software calculation of swim Measures based on Individual Curvature Maps. Please click here to view this video. (Right-click to download.)
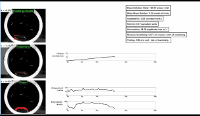
Video 4: Software Calculation of Swim Measures that do not Rely on Curvature Maps. Please click here to view this video. (Right-click to download.)
Discussion
The use of C. elegans as a model system continues to increase due to its genetic malleability, experimental tractability and anatomy annotated to meticulous detail. For instance, the neuronal structure and connectivity of the C. elegans hermaphrodite is clearly mapped out34-36, greatly facilitating investigations of specific neuronal circuits that control particular behaviors. 302 neurons constitute the adult hermaphrodite's nervous system, which process a broad range of sensory inputs into basic behavioral outputs like locomotion. The structure of the more complex male nervous system has also been described37, enabling sex-specific circuitry to be addressed.37
C. elegans behavior has been extensively studied on standard culture plates containing solid media. Since WT C. elegans moves in predictable sinusoidal waves on agar-filled plates, deviations from the overall pattern can be detected by eye and scored manually. This approach, however, is subject to the experimenter's criterion and is labor intensive. Hardware and software tools designed to track and measure C. elegans locomotion on solid media remove the subjectivity bias and allow for large-scale studies, permitting more sophisticated biological questions to be addressed. The recent behavioral database created by the Schafer lab16 is an excellent example of the analytical extension and depth that has been achieved with a computational system for locomotion on plates.
When WT C. elegans is placed in liquid, the animal quickly adapts its motion to the new environment, initiating a swim. C. elegans swimming utilizes a greater range of motion than crawling and can be more irregular8. Software like CeleST is intended to fill the gap for detailed analysis of C. elegans behavior in liquid, permitting quantitation of motion-associated parameters that are not readily measured by the un-aided eye, or that can be accomplished more rapidly than manual scoring. In 8 hard h an individual could process up to 200 videos, ~1,000 records per day.
The software defines swimming assessing parameters that serve as a comprehensive fingerprint of physical fitness and behavior. In addition to enriching understanding of the complex facets of C. elegans behavior in liquid and their underlying molecular pathways, this software can be used to explore multiple aspects of biology including pharmacological responses, aging, and distinct behavior. Presented here, the overview of the quantified changes that occur in the physical performance of C. elegans adults as they age is one example of such application of the software (for a more detailed account, see Restif et al.8). In the context of aging, some measured parameters declined while others increased or did not consistently change in wild type. Trends were confirmed to a large extent by the computational profile of longevity mutants, and the relative profiles of graceful and bad ager cohorts of same-age populations kept in uniform environmental conditions. The high resolution of the software can also reveal subtle phenotypes previously unknown in extensively characterized mutants (e.g., age-1(hx546) in Figure 1).
There are a few particularly critical steps of the protocol described. Maintaining a constant temperature environment between the swim environment and the strain plate culture is important for swim reproducibility, so experimenters are highly encouraged to go to great pains to avoid random temperature changes. Swim media should be at the same temperature as the plates. Likewise, careful attention to the drop size for the swim will help ensure reproducibility. Finally, it is prudent to think in advance about the offloading of the large video files that accumulate. Processing images on a site apart from the video capture computer is recommended.
The use of the software presented here for swim analysis has certain limitations. First, although the programs can simultaneously track multiple animals, if more than five animals are jointly analyzed, there is an increased chance that the animals will swim across each other in the video images. When the program cannot unambiguously determine which animal was which, it censors those data frames. Although this program feature ensures that data for individual animals are of high quality, it limits the throughput. Second, the images should be fairly clean, that is free of dust, smudges and glare from lights, as associated signals can also confound the image analysis. As noted in protocol section 2.1.1, a very low-tech investment that can greatly aid image capture by eliminating complications with fluctuations in environmental lighting is to cover the stage area with a dark cloth that does not allow ambient light to reach the stage. Third, the program is optimized for animals at adult stage. Young larvae swim very fast and have small bodies, which increases program error. Fourth, some of the software utilizes MATLAB, and when there are version upgrades and/or operating system upgrades, some program links may be disrupted. Currently, the software is optimized for use on MATLAB 2015b and Mac OS version 10.10, but we expect soon to post a software version that is more robust against such changes. Finally, the video data files can become large fast, and require storage space to be allotted.
In summary, presented here is a simple methodology that can be easily implemented by any laboratory without much investment to create videos of C. elegans swimming for CeleST analysis. Features of the software package include extensive automation from tracking through analysis, simultaneous multi-animal tracking, and use of mathematical bases (i.e., curvature measures) for quantitation of most locomotion parameters. The software is open source, with code and demos publicly available as detailed in Restif et al.8. Although the program features advanced computer vision analysis for tracking, other published tracking systems (e.g., Greenblum et al., 201438) are compatible with the parameter analysis of the software presented here. Future improvements will be directed toward converting the software into a more robust package that does not restrict use to the specific versions of the operating systems mentioned above (also indicated in the Table of Materials).
Disclosures
The authors have nothing to disclose.
Acknowledgements
CeleST development was supported by NIH grants R21AG027513 and U01AG045864. Data and some short video representations are adapted from Restif et al. (2014)8, which were published under the Creative Commons Attribution (CC BY) license http://creativecommons.org/licenses/by/4.0/. We thank Ricardo Laranjeiro for manuscript help.
Materials
| Name | Company | Catalog Number | Comments |
|---|---|---|---|
| REAGENT | |||
| N2 | Caenorhabditis Genetics Center (CGC) | C. elegans WT (ancestral). | |
| OP50 Escherichia coli | Caenorhabditis Genetics Center (CGC) | Biosafety Level: BSL-1. | |
| OP50-1 Escherichia Coli | Caenorhabditis Genetics Center (CGC) | Streptomycin resistant strain of OP50. Biosafety Level: BSL-1. | |
| Streptomycin sulfate salt | Sigma-Aldrich | S6501 | |
| Printed Microscope Slides | Thermo Fisher Scientific | Gold Seal Fluorescent Antibody Microslides: 3032-002 | have two etched 10 mm diameter circles delineated by white ceramic ink |
| Nematode Growth Medium (NGM) | For 1 L: 17 g Agar, 3 g NaCl, 2.5 g Peptone, 1 mL 1 M CaCl2, 1 mL 5 mg/mL Cholesterol in ethanol, 25 mL 1 M KPO4 buffer, 1 mL 1 M MgSO4, H2O to 1 L. Sterilize by autoclaving. | Stiernagle, T. Maintenance of C. elegans. WormBook, 1-11, doi:10.1895/wormbook.1.101.1 (2006) | |
| M9 buffer | For 1 L: 3 g KH2PO4, 6 g Na2HPO4, 5 g NaCl, 1 mL 1 M MgSO4, H2O to 1 L. Sterilize by autoclaving. | Stiernagle, T. Maintenance of C. elegans. WormBook, 1-11, doi:10.1895/wormbook.1.101.1 (2006) | |
| EQUIPMENT | |||
| CeleST | Driscoll Lab, Rutgers University | C. elegans Swim Test | Open Source, see http://celestmod.github.io/CeleST/ and http://celest.mbb.rutgers.edu/ |
| MATLAB | www.mathworks.com/downloads | MatLab version 2015b (best) | The CeleST version demonstrated here has best functionality with Mac OS 10.10 and MatLab 2015b. MATLAB 2015B introduced changes to how MATLAB handled graphics, including a new coding convention and syntax. These changes resolved an issue that couldn't be resolved elegantly (primarily because the internals of MATLAB really needed the major graphics overhaul implemented in MATLAB 2015B). For this reason, CeleST should always be run on MATLAB 2015B or later versions. However for users without access to MATLAB version 2015B or later (or MATLAB at all), we have created a CeleST program that doesn't need MATLAB on the computer at al. An installer is downloaded by the prospective user and then it installs itself onto the computer through a couple prompts like most programs. |
| Mac OS | www.apple.com | Version 10.10 | Currently, CeleST has been ported to the major operating systems (Windows, Mac, and Linux). The current code can be run on any of the operating systems and there are versions for each operating system that don't even require users to have MATLAB to use CeleST (this version requires a large download). The Windows version has been tested the least and is most prone to bugs as such. Linux has been moderately tested. And Mac has been and continues to be tested extensively (primarily because it's the operating system in our lab). |
| Stereomicroscope | Zeiss | Stemi 2000-C | |
| Transmitted Light Base | Diagnostic Instruments | TLB 3.1 | |
| Digital CCD Camera | QImaging | Rolera-XR Mono Fast 1394 (ROL-XR-F-M-12) | |
| Digital Video Recording Software | Norpix | Streampix Version 3.17.2 |
References
- Brenner, S. The genetics of Caenorhabditis elegans. Genetics. 77 (1), 71-94 (1974).
- Jove Science Education Database. Essentials of Biology 1: yeast, Drosophila and C. elegans. An Introduction to Caenorhabditis elegans. , JoVE. Cambridge, MA. Available from: http://www.jove.com/science-education/5103/an-introduction-to-caenorhabditis-elegans (2016).
- Stiernagle, T. Maintenance of C. elegans. WormBook. , 1-11 (2006).
- Gallagher, T., Kim, J., Oldenbroek, M., Kerr, R., You, Y. J. ASI regulates satiety quiescence in C. elegans. J Neurosci. 33 (23), 9716-9724 (2013).
- Brown, A. E., Yemini, E. I., Grundy, L. J., Jucikas, T., Schafer, W. R. A dictionary of behavioral motifs reveals clusters of genes affecting Caenorhabditis elegans locomotion. Proc Natl Acad Sci U S A. 110 (2), 791-796 (2013).
- Herndon, L. A., et al. Stochastic and genetic factors influence tissue-specific decline in ageing C. elegans. Nature. 419 (6909), 808-814 (2002).
- Restif, C., et al. CeleST: computer vision software for quantitative analysis of C. elegans swim behavior reveals novel features of locomotion. PLoS Comput Biol. 10 (7), e1003702(2014).
- Ibanez-Ventoso, C., et al. Modulated microRNA expression during adult lifespan in Caenorhabditis elegans. Aging Cell. 5 (3), 235-246 (2006).
- Hahm, J. H., et al. C. elegans maximum velocity correlates with healthspan and is maintained in worms with an insulin receptor mutation. Nat Commun. 6, 8919(2015).
- Hsu, A. L., Feng, Z., Hsieh, M. Y., Xu, X. Z. Identification by machine vision of the rate of motor activity decline as a lifespan predictor in C. elegans. Neurobiol Aging. 30 (9), 1498-1503 (2009).
- Liu, J., et al. Functional aging in the nervous system contributes to age-dependent motor activity decline in C. elegans. Cell Metab. 18 (3), 392-402 (2013).
- Gerstbrein, B., Stamatas, G., Kollias, N., Driscoll, M. In vivo spectrofluorimetry reveals endogenous biomarkers that report healthspan and dietary restriction in Caenorhabditis elegans. Aging Cell. 4 (3), 127-137 (2005).
- Husson, S. J., Costa, W. S., Schmitt, C., Gottschalk, A. Keeping track of worm trackers. WormBook. , 1-17 (2012).
- Yemini, E., Jucikas, T., Grundy, L. J., Brown, A. E., Schafer, W. R. A database of Caenorhabditis elegans behavioral phenotypes. Nat Methods. 10 (9), 877-879 (2013).
- Wang, S. J., Wang, Z. W. Track-a-worm, an open-source system for quantitative assessment of C. elegans locomotory and bending behavior. PLoS One. 8 (7), e69653(2013).
- Likitlersuang, J., Stephens, G., Palanski, K., Ryu, W. S. C. elegans tracking and behavioral measurement. J Vis Exp. (69), e4094(2012).
- Tsechpenakis, G., Bianchi, L., Metaxas, D., Driscoll, M. A novel computational approach for simultaneous tracking and feature extraction of C. elegans populations in fluid environments. IEEE Trans Biomed Eng. 55 (5), 1539-1549 (2008).
- Krajacic, P., Shen, X., Purohit, P. K., Arratia, P., Lamitina, T. Biomechanical profiling of Caenorhabditis elegans motility. Genetics. 191 (3), 1015-1021 (2012).
- Pierce-Shimomura, J. T., et al. Genetic analysis of crawling and swimming locomotory patterns in C. elegans. Proc Natl Acad Sci U S A. 105 (52), 20982-20987 (2008).
- Schreiber, M. A., Pierce-Shimomura, J. T., Chan, S., Parry, D., McIntire, S. L. Manipulation of behavioral decline in Caenorhabditis elegans with the Rag GTPase raga-1. PLoS Genet. 6 (5), e1000972(2010).
- Fang-Yen, C., et al. Biomechanical analysis of gait adaptation in the nematode Caenorhabditis elegans. Proc Natl Acad Sci U S A. 107 (47), 20323-20328 (2010).
- Buckingham, S. D., Partridge, F. A., Sattelle, D. B. Automated, high-throughput, motility analysis in Caenorhabditis elegans and parasitic nematodes: Applications in the search for new anthelmintics. Int J Parasitol Drugs Drug Resist. 4 (3), 226-232 (2014).
- Ghosh, R., Emmons, S. W. Episodic swimming behavior in the nematode C. elegans. J Exp Biol. 211 (Pt 23), 3703-3711 (2008).
- Restif, C., Ibanez-Ventoso, C., Driscoll, M., Metaxas, D. Tracking C. elegans swimming for high-throughput phenotyping. 2011 IEEE International Symposium on Biomedical Imaging: From Nano to Macro. , 1542-1548 (2011).
- Friedman, D. B., Johnson, T. E. A mutation in the age-1 gene in Caenorhabditis elegans lengthens life and reduces hermaphrodite fertility. Genetics. 118 (1), 75-86 (1988).
- Johnson, T. E., Tedesco, P. M., Lithgow, G. J. Comparing mutants, selective breeding, and transgenics in the dissection of aging processes of Caenorhabditis elegans. Genetica. 91 (1-3), 65-77 (1993).
- Morris, J. Z., Tissenbaum, H. A., Ruvkun, G. A phosphatidylinositol-3-OH kinase family member regulating longevity and diapause in Caenorhabditis elegans. Nature. 382 (6591), 536-539 (1996).
- Lin, K., Dorman, J. B., Rodan, A., Kenyon, C. daf-16: An HNF-3/forkhead family member that can function to double the life-span of Caenorhabditis elegans. Science. 278 (5341), 1319-1322 (1997).
- Ogg, S., et al. The Fork head transcription factor DAF-16 transduces insulin-like metabolic and longevity signals in C. elegans. Nature. 389 (6654), 994-999 (1997).
- Ziv, E., Hu, D. Genetic variation in insulin/IGF-1 signaling pathways and longevity. Ageing Res Rev. 10 (2), 201-204 (2011).
- Murphy, C. T., et al. Genes that act downstream of DAF-16 to influence the lifespan of Caenorhabditis elegans. Nature. 424 (6946), 277-283 (2003).
- Sulston, J. E., Horvitz, H. R. Post-embryonic cell lineages of the nematode, Caenorhabditis elegans. Dev Biol. 56 (1), 110-156 (1977).
- White, J. G., Southgate, E., Thomson, J. N., Brenner, S. The structure of the nervous system of the nematode Caenorhabditis elegans. Philos Trans R Soc Lond B Biol Sci. 314 (1165), 1-340 (1986).
- Varshney, L. R., Chen, B. L., Paniagua, E., Hall, D. H., Chklovskii, D. B. Structural properties of the Caenorhabditis elegans neuronal network. PLoS Comput Biol. 7 (2), e1001066(2011).
- Jarrell, T. A., et al. The connectome of a decision-making neural network. Science. 337 (6093), 437-444 (2012).
- Greenblum, A., Sznitman, R., Fua, P., Arratia, P. E., Sznitman, J. Caenorhabditis elegans segmentation using texture-based models for motility phenotyping. IEEE Trans Biomed Eng. 61 (8), 2278-2289 (2014).
Reprints and Permissions
