Photometrische Proteinbestimmung
English
Share
Overview
Messung der Konzentration ist ein grundlegender Schritt von vielen biochemischen Assays. Photometrische Proteinbestimmung nutzt die Tatsache, dass je eine Probe Licht-absorbierenden Substanzen enthält, desto weniger wird das Licht durch es übertragen. Da die Beziehung zwischen Konzentration und Absorption linear ist, dieses Phänomen lässt sich die Konzentration in Proben messen wo ist nicht bekannt.
Dieses Video beschreibt die Grundlagen der photometrischen Proteinbestimmung und stellt der Bradford-Test und der Lowry-Methode. Das Verfahren in dem Video wird eine typische Bradford-Test decken. Anwendungen abgedeckt sind direkte Messung von sehr kleiner Mengen von Nukleinsäuren, Konzentration und Reinheit zu charakterisieren, Ermittlung der Effizienz eines Biomimetic Materials und eine weitere Variante der photometrischen Proteinbestimmung Remazol Farbstoff mit Kupplung.
Bestimmung der Konzentration eines Proteins in Proben ist ein grundlegender Schritt in vielen biochemischen Tests. Photometrische Bestimmung kann mit kleinen Stichprobengrößen erfolgen. Je mehr eine Probe Licht-absorbierenden Substanzen enthält, desto weniger wird das Licht durch sie übertragen. Dies ermöglicht eine quantitative Messung der absorbierenden Substanzen. Diese Konzepte sind so grundlegend für die Wissenschaft, die die Artikel, die zwei Techniken eingeführt in den drei am häufigsten zitierten Zeitungen aller Zeiten sind. Dieses Video zeigt die Konzepte hinter einigen der häufigsten photometrischen Protein Entschlossenheit Techniken, wie sie ausgeführt werden und wie die gesammelten Daten analysiert werden.
Photometrische Proteinbestimmung basiert auf der Beziehung zwischen Konzentration und leichte Saugfähigkeit. Dieses bekannt als das Bier-Lambert Gesetz, die besagt, dass die Konzentration einer Licht-absorbierenden Spezies proportional zu seiner Absorption ist.
Dieses Prinzip zugrunde liegt, alle photometrischen Protein Bestimmungsmethoden.
Für die direkte Absorption Analyse sind die Extinktion unverändert Proteinproben gemessen. Wegen ihrer aromatischen Seitenketten, Tryptophan und Tyrosin Rückstände geben die höchste Absorption Lesungen bei einer Wellenlänge von 280 nm.
Sind jedoch diese Aminosäuren, die zwei der seltensten gefunden in Proteine sind in unterschiedlichen Mengen in jedes Protein vorhanden, so dass jede Bestimmung einzigartig ist. Zur Überwindung dieser Beschränkung, komplexere Assays-, die sind nicht abhängig von dieser Aminosäuren-wurden entwickelt.
Ein Beispiel ist der Bradford-Test, wo farbige Farbstoff der Probe hinzugefügt wird. Der Farbstoff, bekannt als Coomassie Blau reagiert proportional der mehr Eiweiß vorhanden ist, desto mehr Bindung Ereignisse mit dem Farbstoff.
Anschließend Proteinkonzentration wird bestimmt durch die Messung der Extinktion der gebundenen Coomassie Blau Färbung, die absorbiert Licht bei 594 nm. Allerdings ist der Bradford-Test linear über einer kurzen Strecke der Konzentrationen, so dass Verdünnungen oft, vor der Analyse erforderlich sind.
Die Lowry-Methode verbindet das Biuret-Reagenz, eine alkalische Lösung von Kupferionen, die mit Peptidbindungen reagieren und das Folin-Ciocâlteu-Reagenz, das aromatischen Proteinreste oxidiert. Die daraus resultierende farbliche Veränderung der Probe ist proportional zur Konzentration Proteins.
Die Extinktion des reduzierten Folin-Reagenz ermittelt werden, bei 750 nm. Wie direkte Absorption jedes Protein hat eine einzigartige Lösung, und muss für das Protein des Interesses kalibriert werden. Nun, da wir die grundlegenden Prinzipien hinter einigen der am häufigsten verwendeten Assays überprüft haben, schauen Sie wie direkte Absorption und der Bradford-Test durchgeführt werden.
Um eine direkte Absorption Analyse zu beginnen, ist das Spektralphotometer mit einer leeren Null Extinktion bestimmen kalibriert. Standardlösungen sind für den Einsatz bei der Erstellung der Eichkurve bereit. Dann ist ein Aliquot des ersten Standards hinzugefügt, um eine Küvette und gelegt in das Spektrophotometer.
Der Wert der Absorption bei 280 nm wird dann aufgezeichnet. Dieser Vorgang wird für jede Norm, mit einem sauberen Küvette für jeden Lauf wiederholt. Sobald der Vorgang abgeschlossen, entsteht eine Eichkurve durch Plotten die Extinktion gegen Konzentration. Die Neigung dieser Linie ist die molare Dämpfung-Koeffizienten, der Extinktion Konzentration bezieht.
Als nächstes der unbekannte Probe wird hinzugefügt, um eine Küvette und die Extinktion Wert wird gespeichert. Wie die Datenanalyse für die verschiedenen photometrischen Bestimmungsmethoden ähnlich ist, behandeln wir, dass, nachdem wir der Bradford-Test betrachten.
Hier erfolgt die Bradford Protein Assay mit BSA Standard auf einer 96-Well-Platte. Um zu beginnen, sind BSA Stammlösungen bereit.
Die unbekannten Lösungen werden verdünnt mit entionisiertem Wasser um sicherzustellen, dass die Konzentrationen innerhalb der Assay-Bereichs sind. Je nach dem Kit erfordern die Coomassie-Färbung auch Verdünnung. Dann ist die Eichkurve einrichten, indem Sie die BSA Standards zu 96-Well-Platte.
Deionisiertes Wasser wird hinzugefügt, um die notwendige Konzentration um eine Standardkurve generieren zu erreichen. Der unbekannte Probe sollte hinzugefügt werden, um die Platte in Triplicates um sicherzustellen, dass eine genaue Messung ist. Coomassie-Färbung wird als nächstes hinzugefügt in jede Vertiefung, mischen mit der Pipette.
Deionisiertes Wasser ergänzt einen leeren Brunnen als eine leere, um die Absorption zu messen. Nach einer Wartezeit von 5 min für den Farbstoff zu binden, wird die Extinktion gemessen in eine Platte-Reader auf 590 nm.
Nun, da wir ein paar Tests durchgeführt haben, schauen Sie wie Sie die Daten analysieren. Jede photometrische Protein Entschlossenheit Methode basiert auf dem Bier-Lambert Gesetz.
Die gemessene Extinktion des Standards wird verwendet, um eine Eichkurve erstellen, die dann verwendet wird, um die Konzentration der unbekannten Proben zu bestimmen. Diese Kurve kann manuell aufgetragen werden, obwohl neuere photometrische Instrumente die Kalibrierkurve entsteht, sobald alle Normen gemessen wurden. Diese Systeme werden auch Proteinkonzentration berechnen, da unbekannte Proben analysiert werden.
Nun, da wir wie Protein photometrischen Bestimmung Datenanalyse überprüft haben, betrachten wir einige der Möglichkeiten, die diese Verfahren genutzt werden.
Die Grundsätze der photometrischen Proteinbestimmung können auch verwendet werden, um direkt Nukleinsäure-Konzentration zu messen. Das Spektralphotometer Nanodrop nimmt Proben von sehr kleinen Volumen auf eine optisch aktive Sockel. Die Extinktion wird dann gemessen, und das System ermittelt automatisch die Nukleinsäure-Konzentration. Da Proteine und anderen Quellen Messungen stören können, Probe Reinheit wird bestimmt durch die Analyse von 260 bis 280 nm und 260 bis 230 nm Absorption Verhältnisse. Reiner Nukleinsäuren ergeben in der Regel Verhältnisse von etwa 1,8 bis ca. 2,0 für DNA und RNA, beziehungsweise.
Photometrische Proteinbestimmung kann auch bei der Herstellung von biomimetischer Materialien verwendet werden, die von der Natur inspiriert sind, um spezifische zelluläre Reaktionen hervorrufen. Rekombinante Adhesins sind an Polystyrol-Kügelchen gebunden, um bakterielle Bindung an Wirtszellen zu simulieren. Der Bradford-Test wird verwendet, um die Kupplung Leistungsfähigkeit der rekombinanten Adhäsion zu den Perlen in der Produktion von Biomimetic Materials festzustellen.
Alternative photometrischen Protein Assays können bei der Erkennung und Charakterisierung von Protein Antibiotika verwendet werden. Remazol brillianter blauer R Farbstoff ist kovalent an Hitze getötet Bakterien gebunden. Das antimikrobielle Protein wird in der gefärbten Lösung inkubiert. Dann die Probe zentrifugiert wird, und die Extinktion des Überstands bei 595 nm wird anhand einer Mikrotestplatte Spektralphotometer. Erhöhte Absorption durch den löslichen Farbstoff in der Überstand der beschrifteten Bakterien freigesetzt wird eine quantitative Messung der Enzymaktivität.
Sie haben nur Jupiters Video auf photometrische Proteinbestimmung angesehen. Dieses Video beschrieben die zugrunde liegenden Prinzipien der photometrischen Bestimmung, ging über allgemeine Verfahren für einige gemeinsame Assays und einige neue Fortschritte in der Technik abgedeckt. Danke fürs Zuschauen!
Procedure
Disclosures
Transcript
Determining the concentration of a protein in samples is a fundamental step in many biochemical assays. Photometric determination can be done with small sample sizes. The more a sample contains light-absorbing substances, the less the light will transmit through it. This provides a quantitative measurement of the absorbing substances. These concepts are so fundamental to science that the articles that introduced two of the techniques are in the three most cited papers of all time. This video will show the concepts behind some of the most common photometric protein determination techniques, how they are performed, and how the gathered data is analyzed.
Photometric protein determination is based on the relationship between concentration and light absorbency. This is known as the Beer-Lambert Law, which states that the concentration of a light-absorbing species is proportional to its absorbance.
This principle underlies all photometric protein determination methods.
For direct absorption analysis, the absorbance values of unaltered protein samples are measured. Because of their aromatic side chains, tryptophan and tyrosine residues give the highest absorbance readings at a wavelength of 280 nm.
However, these amino acids-which are two of the least frequently found in proteins-are present in different amounts in every protein, so each determination is unique. To overcome this limitation, more complex assays-that are not dependent on these amino acids-were developed.
One example is the Bradford Assay, where colored dye is added to the sample. The dye, known as Coomassie Blue, responds proportionally-the more protein present, the more binding events with the dye.
Then, protein concentration is determined by measuring the absorbance of the bound Coomassie Blue dye, which absorbs light at 594 nm. However, the Bradford assay is linear over a short range of concentrations, so dilutions are often required before analysis.
The Lowry Method combines the Biuret reagent, an alkaline solution of copper ions that react with peptide bonds, and the Folin-Ciocâlteu reagent, which oxidizes aromatic protein residues. The resulting color change of the sample is proportional to the protein concentration.
The absorbance of the reduced Folin reagent can be determined at 750 nm. Like direct absorption, each protein has a unique response, and must be calibrated for the protein of interest. Now that we’ve reviewed the basic principles behind some of the most common assays, let’s look at how direct absorption and the Bradford assay are performed.
To begin a direct absorption analysis, the spectrophotometer is calibrated with a blank to determine zero absorbance. Standard solutions are prepared for use in creating the calibration curve. Then, an aliquot of the first standard is added to a cuvette, and placed into the spectrophotometer.
The absorbance value at 280 nm is then recorded. This process is repeated for each standard, using a clean cuvette for each run. Once complete, a calibration curve is created by plotting the absorbance versus concentration. The slope of this line is the molar attenuation coefficient, which relates absorbance to concentration.
Next, the unknown sample is added to a cuvette, and the absorbance value is recorded. As the data analysis for the different photometric determination methods is similar, we will cover that after we look at the Bradford assay.
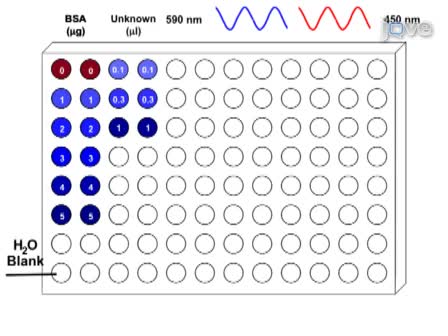
Here, the Bradford protein assay is performed with a BSA standard on a 96-well plate. To begin, BSA stock solutions are prepared.
The unknown solutions are diluted with deionized water to ensure that the concentrations are within the assay’s range. Depending on the kit, the Coomassie dye may also require dilution. Then, the calibration curve is set up by adding the BSA standards to the 96-well plate.
Deionized water is added to reach the needed concentration to generate a standard curve. The unknown sample should be added to the plate in triplicates to ensure an accurate measurement is taken. Coomassie dye is next added to each well, mixing with the pipette.
Deionized water is added to an empty well as a blank, to measure the absorbance. After waiting 5 min for the dye to bind, the absorbance is measured in a plate-reader at 590 nm.
Now that we’ve performed a few assays, let’s look at how to analyze the data. Each photometric protein determination method is based on the Beer-Lambert Law.
The measured absorbance of the standards is used to create a calibration curve, which is then used to determine the concentration of unknown samples. This curve can be manually plotted, though newer spectrophotometric tools will create the calibration curve once all standards have been measured. These systems will also calculate protein concentration as unknown samples are analyzed.
Now that we’ve reviewed how to analyze photometric protein determination data, let’s look at some of the ways these procedures are utilized.
The principles of photometric protein determination can also be used to directly measure nucleic acid concentration. The nanodrop spectrophotometer accepts samples of very small volume onto an optically active pedestal. The absorbance is then measured, and the system automatically determines the nucleic acid concentration. Because proteins and other sources can interfere with measurements, sample purity is determined by analyzing the 260 to 280 nm and 260 to 230 nm absorbance ratios. Pure nucleic acids typically yield ratios of approximately 1.8 and approximately 2.0 for DNA and RNA, respectively.
Photometric protein determination can also be used in the production of biomimetic materials, which are inspired from nature to elicit specific cellular responses. Recombinant adhesins are bound to polystyrene beads to simulate bacterial attachment to host cells. The Bradford assay is used to determine the coupling efficiency of the recombinant adhesion to the beads in the production of the biomimetic material.
Alternative photometric protein assays can be used in the detection and characterization of protein antimicrobials. Remazol brilliant blue R dye is covalently bonded to heat-killed bacteria. The protein antimicrobial is incubated in the dyed solution. Then, the sample is centrifuged, and the absorbance of the supernatant at 595 nm is measured using a microplate spectrophotometer. Increased absorbance, by the soluble dye released into the supernatant from the labeled bacteria, is a quantitative measurement of enzymatic activity.
You’ve just watched JoVE’s video on photometric protein determination. This video described the underlying principles of photometric determination, went over general procedures for some common assays, and covered some new advances in techniques. Thanks for watching!