

Summary
This protocol is designed to measure reward anticipation and processing in young children with and without autism. Specifically, the protocol is designed to study the neural correlates of reward during social and nonsocial conditions while controlling for reward between conditions.
Abstract
We present a protocol designed to measure the neural correlates of reward in children. The protocol allows researchers to measure both reward anticipation and processing. Its purpose is to create a reward task that is appropriate for young children with and without autism while controlling reward properties between two conditions: social and nonsocial. The current protocol allows for comparisons of brain activity between social and nonsocial reward conditions while keeping the reward itself identical between conditions. Using this protocol, we found evidence that neurotypical children demonstrate enhanced anticipatory brain activity during the social condition. Furthermore, we found that neurotypical children anticipate social reward more robustly than children with autism diagnoses. As the task uses snacks as a reward, it is most appropriate for young children. However, the protocol may be adapted for use with adolescent or adult populations if snacks are replaced by monetary incentives. The protocol is designed to measure electrophysiological events (event-related potentials), but it may be customized for use with eye-tracking or fMRI.
Introduction
Autism spectrum disorder (ASD) is a developmental disability characterized by impairments in social communication (verbal and non-verbal) and the presence of restricted interest and/or repetitive behaviors1. Given that ASD is hypothesized to be neurologically-based2,3, it is unsurprising that neuroscience research involving children with ASD has become highly prevalent over the past decade. Though many theories about the brain basis of ASD have been proposed, one in particular that has garnered considerable research attention is the social motivation hypothesis4. Briefly, the social motivation hypothesis states that children with ASD engage in less social interaction than their typically developing (TD) peers because social interaction is not as rewarding for them. Chevallier et al. provide a review of the social motivation hypothesis5. Because this hypothesis directly relates to the reward system, specifically whether or not the system in ASD is responsive to social information, multiple studies have investigated the social reward system in ASD6,7,8,9,10,11,12. Results from these studies have differed, with some providing evidence that the reward system in ASD is hypoactive to both social and nonsocial information, and others suggesting that the reward system functions typically for nonsocial information but is hypoactive to social stimuli. One potential reason for these inconsistent results relates to the stimuli and methodology used in the protocols. It is difficult to match social and nonsocial rewards in an experimental context; for example, multiple studies have used a picture of a smiling face as the social reward, and the nonsocial reward is monetary (e.g., getting money after the experiment is complete7,8,11). Though these studies provide an important foundation for future research, it is difficult to determine whether or not the findings relate to differences in social versus nonsocial reward responsiveness in ASD or if they are due to differences between reward conditions.
The current protocol is designed to investigate the reward system in high-functioning children with ASD using electrophysiology. To explore differences between children with and without ASD based on reward anticipation, the stimulus-preceding negativity (SPN) was measured. The SPN is a slow-wave component that reflects an expectation of a reward stimulus13. The significance of the SPN is typically conceptualized as emotional anticipation14,15,16 and is thought to be reflected by activity in the insula17,18. The SPN is often measured after participants perform a motor response and before feedback onset during a decision-making task19,20. The SPN is sensitive to reward magnitude and is consistently larger in reward versus no-reward conditions15,16,21. Though the SPN is typically measured during decision-making tasks, researchers have reported that the SPN can be observed when anticipating affective upcoming stimuli without any task22,23,24. One critical aim of the current protocol is to perform an experimental task in which the rewards between social and nonsocial conditions are matched to eliminate potential confounds. Another goal is to test young children between 6 and 11 years old. Therefore, the protocol can serve as an age-appropriate reward task that children may find engaging without becoming frustrated.
Protocol
Procedures involving human participants were approved by the Human Subject Research Ethics Committee/Institutional Review Board at University of California, Riverside and University of California, San Diego.
1. Stimuli Preparation
Note: The procedures described below are specific to a commercially available editing suite (see Table of Materials); however, other photo editing software can certainly be used.
- Prepare a set of emotional face photographs25 categorized into two facial expressions (happy and sad). Using previously collected behavioral ratings, choose photographs with highly accurate emotion ratings (in which over 80% of participants identified the emotion correctly)25.
NOTE: In our protocol, there were 33 chosen adult faces (18 female, 15 male). Of the 18 females, 9 are Caucasian, 4 are African American, and 5 are Asian American. Of the 15 males, 9 are Caucasian, 6 are African American, and none are Asian American. In this case, photos have already been cropped and placed on a white background. It is important to note that the NimStim set of facial expressions was rated and normed by adults25. Thus, it is possible that children or adolescents may perceive facial expressions differently than the adults who normed the images. - Standardizing the emotional expression stimuli
- Using a photo editing suite, edit the photographs to be in grayscale, then save them (in the software used here, this is done by selecting Image | Mode | Greyscale).
- Make sure that the resolution is 72 pixels/inch and that the file width is 8.5 inches and height is 11 inches.
- Using a ruler, change the width of the photograph (in pixels) until the face measures 11 cm from the outside of the hair on one side to the outside of hair on the other side, and 14 cm from the start of hairline to the bottom of the chin.
- Creating the scrambled face arrow stimuli
- Download the "scramble" plugin (http://telegraphics.com.au/sw/product/Scramble).
- Extract the ZIP and move it into "plug-ins" inside the editing suite's application folder.
- In the photo editing program, create a "custom shape" in the shape options. Make sure that the shape is an arrow.
- Open the emotional face images one at a time. Use the selection tool to select only the face and not the background.
- Select Filter | Telegraphics | Scramble | OK.
- Select Window | Layers (this should produce a "layers" window to the side).
- Double click background, then click ok and rename it to layer 0 (any name is fine).
- Right click on the shape tool in the left-hand menu bar and choose the custom arrow shape.
- Drag the arrow shape into the middle of the scrambled image.
- Use Ctrl + T to drag the arrow to the middle of the image and adjust the size so it is the same as the face image (e.g., 11 x 14 cm).
- Use the angle tool to ensure that for happy faces the arrow faces upwards and for sad faces the arrow faces downwards.
- Click layer 0 or the name given in step 1.3.7.
- Select Layers | Group with previous.
- Click Select-all | Edit | Copy merged.
- Create a new file with the arrow on a white background by selecting File | New. The new file should be 8.5 x 11 inches at a resolution of 72 pixels/inch.
- Save the files.
NOTE: After these are saved, there should be photographs of individuals with sad expressions, happy expressions, and the scrambled versions. The scrambled photograph with the upwards pointing arrow is the nonsocial image for happy, and the scrambled photograph with the downwards pointing arrow is the nonsocial image for sad.
- Creating the reward images
- Find an image of a goldfish cracker (without anything else in the frame) and download it to the computer.
- Open the goldfish cracker image in a photo editing suite and edit it to be in grayscale.
- Create two goldfish cracker images: 1) one in grayscale and 2) one that is crossed out (e.g., has a surrounding circle/oval with a line through the middle).
- Using Copy | Paste, place images of the intact goldfish cracker around the happy images (e.g., both the upwards pointing arrow and smiling people).
- Using Copy | Paste, place images of the crossed-out goldfish cracker around the sad images (e.g., both the downwards pointing arrow and frowning people).
- Preparing the stimuli in electrophysiology (EEG) presentation software
- Create two blocks of stimuli in an EEG presentation software package. One block will be social (e.g., pictures of smiling and frowning faces) and the other will be nonsocial (e.g., pictures of upwards and downwards facing arrows).
- Pseudo-randomize the order of stimuli in each block such that no image occurs more than once in a row, and such that the participant does not see more than three sad/downwards facing arrows or happy/upwards facing arrows in a row.
- Set up each trial to contain the following: a fixation cross; 2 boxes with question marks (the participant will use a button press to indicate a choice between the left and right box); an arrow pointing to the box the participant choses via the button press; and feedback (the stimuli created above).
NOTE: Although participants are choosing the left or right box, whether correct (e.g., happy face or upwards facing arrow surrounded by intact goldfish) or incorrect (e.g., sad face or downwards facing arrow surrounded by crossed out goldfish) feedback shown is pre-programmed by the randomization described in step 1.5.2. Thus, participants may feel that they are guessing correctly or incorrectly, but in reality the choice does not affect which feedback image is shown. - Display each trial based on the following durations: 1) fixation cross for 500 ms, 2) two boxes with question marks inside for 3000 ms, 3) two boxes with question marks inside, with an arrow pointing towards the box chosen by the participant for 2000 ms, and 4) feedback (e.g., face or scrambled face images) for 1000 ms. See Figure 1.
NOTE: If participants fail to respond (via the button press) within 3000 ms, the trial ends and the next trial begins. The anticipated visual angle is a horizontal visual angle of 14.5° and vertical visual angle of 10.67°.
2. Behavioral Procedures
- Recruit participants with and without ASD diagnoses based on the Institutional Review Board guidelines.
- Administer cognitive tests (e.g., Wechsler Abbreviated Scale of Intelligence, WASI26) to all participants to confirm that children have cognitive scores within the low-average to average range (e.g., a full-scale IQ of at least 70).
NOTE: It was determined that children with full-scale IQs below 70 would likely have difficulty understanding and remembering task directions. Therefore, an IQ cut-off of 70 was chosen as an exclusionary criterion for participation. - For participants with a previous diagnosis of ASD, administer the autism diagnostic observation schedule (second edition, ADOS-2)27 to confirm their eligibility.
3. EEG Recording
- Set up the participants.
- Ensure that each participant sits in a comfortable chair in a dimly lit room and adjust the chair so individuals are 72 cm away from the computer screen. Provide a brief tutorial about the procedure.
NOTE: In this study, participants were told the following: "You will be playing a guessing game - just like pick-a-hand, except on the computer. You will see 2 boxes with question marks in them, and then you will use this button box to choose whether you think the right or left box is the right one. If you think the left box is the right one, press the left button. If you think the right box is the right one, press the right button. Once you pick, you'll see the boxes with question marks and an arrow in the middle showing which one you picked. Then you'll see if you got it right. For each one you get right, you'll get 1 goldfish cracker. If you don't like goldfish, you can trade for fruit snacks. When you get it right, you'll see a ring of goldfish crackers. That means you get a goldfish cracker! When you get it wrong, you'll see a ring of crossed out goldfish crackers. When you get it wrong, you won't lose any goldfish, you just won't gain any that time. The computer will keep track of how many goldfish you get, and then I'll give you that many after we are all done." After the tutorial, ask participants, "Ok, so what are you going to do?" followed by, "What will you see when you get it right?" and "What will you see when you get it wrong?" to confirm that they understand the task. If they do not seem to understand, explain it again until they are able to answer those questions correctly.
- Ensure that each participant sits in a comfortable chair in a dimly lit room and adjust the chair so individuals are 72 cm away from the computer screen. Provide a brief tutorial about the procedure.
- Use an EEG cap with 32 Ag/AgCl electrodes in the international 10-20 system, with additional vertical (VEOG) and horizontal (HEOG) electrodes to capture eye movement.
- Measure the participant's head to determine which size cap is appropriate for the head size.
- Using a blunt needle, pre-gel the cap by injecting conductive gel into the electrodes.
- Connect the EEG cap to the amplifier with a low-pass filter at 70 Hz, a directly coupled high pass (DC) filter, a 60Hz notch filter, and 500 Hz sampling rate.
- Fit the EEG cap to the participant's head such that the "Cz" electrode is placed at the middle of the scalp (e.g., middle of nasion to inion) as per the 10-20 system.
- Using a blunted needle or sterile wooden stick, swirl inside the electrode to move any hair and allow the gel to contact the scalp.
- Use an impedance meter (or the EEG computer) to ensure that impedance is below 10 KΩ for a low impedance system and below 50 KΩ for a high impedance system.
- Once all the electrodes on the cap show acceptable impedance levels, place the HEOG and VEOG electrodes. Place the HEOG electrodes at the canthus of each eye, and VEOG electrodes above and below the eye.
- If any electrodes have impedance levels above the acceptable thresholds noted above, record them in a notebook or on the computer.
- Begin the experimental blocks, counterbalancing the order of blocks (e.g., social and nonsocial) between participants. Ensure that the EEG computer is recording, the EEG computer and recording computer are synchronized, and the events are being sent correctly.
- Give the participants 30-second breaks after every 15 trials (approximately every 2-3 minutes) to allow them to move around if needed.
NOTE: Although no explicit directions were given to children regarding movement, participants were told to use breaks to "get the wiggles out", "get some energy out", or to perform any other movements they wanted to. - Between blocks, give participants a longer break (about 5 minutes). After each block, have participants fill out a 4-question Likert scale about how much they enjoyed the guessing game and how often they felt they could get correct answers.
- After both blocks are completed and participants have filled out both Likert questionnaires, take off the EEG cap and allow them to wash their hair.
- Provide payment (or an equivalent "prize") to the participants and their families.
- Clean and sterilize the EEG cap.
4. Processing EEG Data
Note: The procedures and commands described in this section are specific to EEGLAB and ERPlab toolboxes28.
- In ERPlab, filter the EEG data using a high-pass filter of .01 Hz and low-pass filter of 30 Hz.
- Discard (in ERPlab) or interpolate (in EEGLAB) bad channels that appear to have high impedance and/or were problematic during recording (e.g., lost contact with the skin during recording).
- Using the EEG channel operations GUI (in ERPlab), re-reference the EEG data using the average of the left and right mastoid electrodes (mastoid electrodes were chosen as the reference due to not having a dense electrode array; in which case, experts sometimes suggest using the average reference29, and because using the average of both mastoid electrodes is less problematic for laterality effects versus a single mastoid30).
- If using the average of mastoid electrodes for re-referencing, those two electrodes must provide a clear signal. If either mastoid electrode has a poor-quality signal (e.g., with high impedence or lost contact with skin during recording), do not use the participant's data for analysis.
- Use the EVENTLIST dropdown menu in ERPlab to create an EEG Eventlist, and assign codes from the stimulus computer to bins using BINLISTER.
- Using the extract bin-based epochs dropdown menu in ERPlab, segment the continuous EEG data into stimulus-locked epochs and baseline correct. To measure the stimulus-preceding negativity (SPN), use epoch from -2200 to 100 ms (baseline of -2200 to -2000 ms). To measure reward processing or post-stimulus brain activity, use epoch from -200 to 800 ms (baseline of -200 to 0 ms).
- Plot the data in EEGlab, and mark and discard epochs that appear to contain non-eye blink artifacts (e.g., excessive noise or motor movement).
- Choose Run ICA on the epoched data.
- Plot the independent components (select Plot | Component activations) and identify any artifacts from eye movement and blinks.
- Remove the components identified as eye movements or eye blink artifacts. To check whether the components marked for removal are responsible for eye movement, choose plot single trial data to visualize the data with the identified components removed. Once the blinks and eye movements are removed, accept the removal of the identified components.
- In ERPlab tools, select Artifact rejection in epoched data | Moving window peak-to-peak procedure. In the current study, a 200 ms moving window, 100 ms window step, and 150 mV voltage threshold were utilized.
- Compute the average ERPs. Make sure to use the default settings, which state that all epochs marked for removal will be discarded from the averaged ERP.
- To analyze average brain activity occurring prior to the onset of the stimuli, extraction (in step 4.11) should occur during the last 200 ms prior to stimulus onset (e.g., -210 to -10 ms) from the electrodes of interest.
- In the case of stimulus-preceding negativity (SPN), electrodes of interest include: F3/F4, C3/C4, P3/P4, and T5/T6 (note that in some systems, temporal electrodes in this region are labeled T6/T7 or T3/T4).
NOTE: -210 to -10 ms was chosen in this protocol rather than -200 to 0 ms to avoid contamination by brain activity not related to the SPN (e.g., the beginning of neural activity when the feedback stimuli is shown at 0 ms).
- In the case of stimulus-preceding negativity (SPN), electrodes of interest include: F3/F4, C3/C4, P3/P4, and T5/T6 (note that in some systems, temporal electrodes in this region are labeled T6/T7 or T3/T4).
- To export numeric data for analysis, use the ERP measurement tool.
NOTE: This tool allows researchers to specify latency or amplitude information, the time windows of interest, and the electrodes of interest. Amplitude can be calculated either as the local peak in a given time window, or as the mean amplitude of a given time window. - Download the numeric data as a .txt file. As needed, export the data into excel or copy and paste it into a statistical analysis program (e.g., SPSS or JMP).
5. Processing Differences for ERSP Analysis
- Begin with the file created in step 4.11 (e.g., the epoched file with all artifact rejection procedures complete).
- Utilize the EEGlab "newtimef" plug-in to obtain a time x frequency transform with values for each time point, frequency, and trial.
- To measure anticipatory alpha band activity, calculate the average values from 8 to 12 Hz.
- Calculate the average activation prior to feedback onset (e.g., -2200 to -100 ms with baseline of -2200 to -2000 ms) in the same electrodes used for the SPN.
- To calculate alpha asymmetry prior to feedback, subtract the log power in the left hemisphere from the right hemisphere.
NOTE: To calculate ERSP activation after feedback onset, data would need to be re-analyzed and re-grouped into epochs using a different time window (e.g., -200 to 800 ms with baseline of -200 to 0 ms).
6. Statistical Analysis
- Paste the numeric data extracted in section 4 (steps 4.11 and 4.12) into a statistical program (e.g., SPSS or JMP).
- Conduct repeated measures ANOVA in the statistical software to the mean values of ERPs to compare brain activity between hemispheres (left, right), electrode positions (frontal, central, temporal, parietal), conditions (face, arrow) and groups (autism spectrum disorder, typically developing).
NOTE: Hemisphere, electrode position, and condition are within-subjects factors, and group is a between-subjects factor.- If hemisphere or electrode position is not statistically significant, collapse across for future analysis.
- If the relationship between behavioral measures (e.g., ADOS severity score) and ERPs is of interest, correlation analyses can be run.
Representative Results
Designing experiments to systematically compare brain activity with social versus non-social reward stimuli is complex, due to the inherent difficulty in equating social and non-social rewards. Figure 1 represents stimuli from an experimental protocol designed for investigating neural responses to reward while controlling for reward properties. Specifically, this paradigm was designed to (i) keep rewards consistent between social and nonsocial trials, (ii) control for physical stimulus properties between social and nonsocial trials, and (iii) be age-appropriate for 6 to 11-year-old children with and without autism.
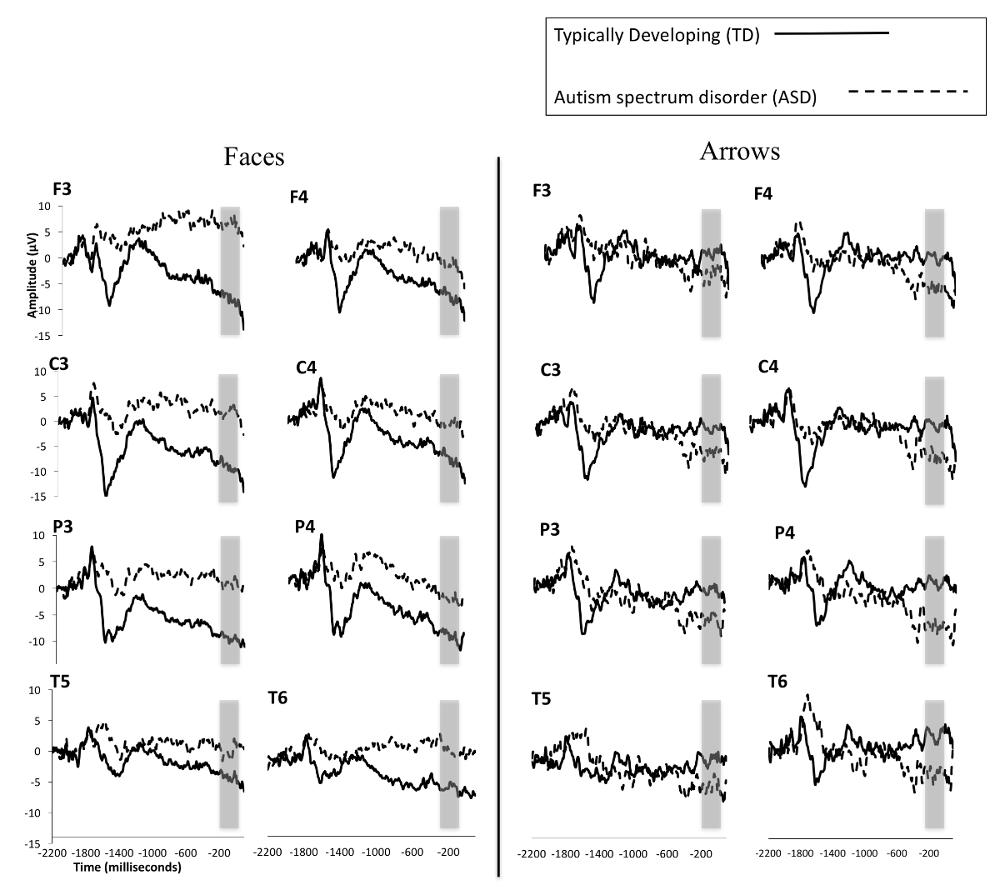
Figure 2 depicts ERP responses as participants anticipate social and non-social stimuli. It should be noted that because the current protocol was designed to measure reward anticipation (the SPN), the displayed epochs are largely prior to feedback onset (which occur at 0 ms in the figures). These results suggest that typically developing (TD) children anticipate reward stimuli accompanied by faces more robustly than children with ASD. Furthermore, though TD children anticipate face stimuli significantly more than non-face stimuli, children with ASD do not evidently show significant differences in brain activity between conditions.

Figure 1: Schematic of stimulus presentation and timing. Feedback for the social (face) condition is shown in the left column. Feedback for the nonsocial (non-face) condition is shown in the right column. Feedback for "correct" answers is shown on top, and feedback for "incorrect" answers is shown below. This figure is re-printed with permission12. Please click here to view a larger version of this figure.

Figure 2: Grand averaged waveforms for TD children and those with ASD from the SPN in response to social/faces (left) and nonsocial/arrows (right). TD children are represented by a solid line and children with ASD by a dashed line. The area between -210 and -10 ms, used for statistical analysis, is highlighted with a gray box. This figure is modified from a previous publication6. Please click here to view a larger version of this figure.
Discussion
The current article describes the stimuli, data collection process, and analysis of ERP data in a reward paradigm for children. In this paradigm, children play a guessing game similar to pick-a-hand on the computer and see feedback about whether their guess is correct or incorrect. ERP results for reward anticipation (brain activity prior to the onset of feedback) were consistent with the stimulus-preceding negativity (SPN). Between conditions, the results suggest that TD children anticipate reward stimuli accompanied by faces more strongly than reward stimuli accompanied by non-face images6. Between groups of children, the results suggest that TD children anticipate face stimuli significantly more than children with autism do. These results are exciting, as they provide important information about how social and nonsocial information are anticipated in children with autism. This is particularly important for furthering the understanding of neural mechanisms of autism and providing support for the social motivation hypothesis. These findings provide useful information for the creation and refinement of interventions, as it underscores the importance of social motivation for children with ASD; for example, it may be important for interventions to explicitly attempt to increase the reward value of social partners to directly affect social motivation in this population.
This protocol is useful for measuring anticipatory brain activity in children with and without ASD, and the data provides evidence that this type of brain activity can be reliably and successfully elicited in children over 6 years old. Furthermore, this method allows social and nonsocial conditions to be directly compared without the presence of confounds related to reward properties (since the reward for correct responses was goldfish in both conditions). In the current protocol, faces were scrambled and an arrow shape was created. This procedure preserves the physical stimulus properties of faces in the nonsocial (non-face) condition. This protocol may be useful for future investigations into sub-groups of ASD (e.g., some children with ASD are more socially motivated than others), and could be utilized to better understand why some children respond more effectively than others to certain interventions.
There are limitations to the current approach that must be taken into consideration. First, the paradigm described above is useful for children between 6 and 11 years old with and without ASD who have cognitive abilities in the average range. Pilot data of typically developing children younger than 6 was not successful, as children were confused by the directions and did not understand the game's instructions. In the current protocol, exclusionary criteria included a full-scale IQ score below 70. Therefore, the current paradigm may not be appropriate for children with a mental or chronological age below 6. However, it may be possible to modify the current protocol so it is appropriate for individuals with lower IQs and younger children. Some modifications to make it more appropriate for young children such as toddlers are currently being investigated. Such modifications include changing the task to be passive (e.g., having children watch stimuli that appear at predicable intervals in a block design) and using an S1/S2 paradigm24. In such a design, the content of S1 reliably provides information about the content of S2 (e.g., if S1 is a square, then S2 will be a face; if S1 is a circle, then S2 will be an arrow). Alternatively, the timing structure of the current paradigm could be used to create an anticipatory auditory protocol.
In ASD, it would be of interest to use speech versus non-speech groups and measure brain activity in children with ASD who are non-verbal and have difficulty responding to instructions or attending to visual stimuli31. Related to the first limitation, it should be noted that results from children with ASD who have cognitive abilities in the average range are likely not representative of the entire autism spectrum - which, by definition, captures a broad range of functioning levels. Therefore, these representative results cannot be extrapolated to all children with ASD. Finally, it is important to note that the stimuli used in the current protocol were normed by adults rather than children. Therefore, future studies should consider using a stimulus set of facial expressions normed by children.
Disclosures
Open Access fees for this article were provided by Brain Vision LLC.
Acknowledgments
We thank all the children and families who participated in the protocols described. Publishing fees were paid by Brain Products.
Materials
| Name | Company | Catalog Number | Comments |
| EEG cap | ElectroCap International | E1-SM/ E1-S/XSM | Electro-Cap - Small (50-54 cm)/Electro-Cap -Small/Extra Small |
| NeuroScan 4.5 | Neuro Scan | https://compumedicsneuroscan.com/tag/scan/ | EEG Recording Software |
| Stim2 | Neuro Scan | https://compumedicsneuroscan.com/product/stim2-precise-stimulus-presentation/ | Stimulus Presentation Software |
| JMP Pro 11 | SAS | https://www.jmp.com/en_us/software/buy-jmp.html | Statistical analysis software |
| NimStim Face Stimulus Set | N/A, open source images | Open source, Available at https://www.macbrain.org/resources.htm | Face Images |
| EEGlab | N/A, free software | N/A, free software | EEG analysis software (free download) |
| ERPlab | N/A, free software | N/A, free software | EEG analysis software (free download) |
| Photoshop | Photoshop | https://www.photoshop.com | Adobe Photoshop, image editing software |
| Photoshop 'scramble' plug-in | Telegraphics | http://telegraphics.com.au/sw/product/Scramble | photoshop plug-in to scramble images |
| NUAMPS EEG AMPLIFIERd | Neuro Scan | http://compumedicsneuroscan.com/wp-content/uploads/NuAmps-Brochure.pdf | EEG amplifier |
References
- Association, P. Diagnostic and Statistical Manual of Mental Disorders: DSM 5. , (2013).
- Mundy, P. The neural basis of social impairments in autism: the role of the dorsal medial-frontal cortex and anterior cingulate system. Journal of Child Psychology and Psychiatry. 44 (6), 793-809 (2003).
- Neuhaus, E., Beauchaine, T. P., Bernier, R. Neurobiological correlates of social functioning in autism. Clinical Psychology Reviews. 30 (6), 733-748 (2010).
- Dawson, G., Webb, S. J., McPartland, J. Understanding the nature of face processing impairment in autism: insights from behavioral and electrophysiological studies. Developmental Neuropsychology. 27 (3), 403-424 (2005).
- Chevallier, C., Kohls, G., Troiani, V., Brodkin, E. S., Schultz, R. T. The social motivation theory of autism. Trends in Cognitive Science. 16 (4), 231-239 (2012).
- Stavropoulos, K. K., Carver, L. J. Reward anticipation and processing of social versus nonsocial stimuli in children with and without autism spectrum disorders. Journal of Child Psychology and Psychiatry. 55 (12), 1398-1408 (2014).
- Kohls, G., et al. Reward system dysfunction in autism spectrum disorders. Social Cognitive and Affective Neuroscience. 8 (5), 565-572 (2013).
- Scott-Van Zeeland, A. A., Dapretto, M., Ghahremani, D. G., Poldrack, R. A., Bookheimer, S. Y. Reward processing in autism. Autism Research. 3 (2), 53-67 (2010).
- Dichter, G. S., Richey, A., Rittenberg, A. M., Sabatino, A., Bodfish, J. W. Reward Circuitry Function in Autism During Face Anticipation and Outcomes. Journal of Autism and Developmental Disorders. 42, 147-160 (2012).
- Richey, J. A., et al. Common and distinct neural features of social and non-social reward processing in autism and social anxiety disorder. Social Cognitive and Affective Neuroscience. 9 (3), 367-377 (2014).
- Delmonte, S., et al. Social and monetary reward processing in autism spectrum disorders. Molecular Autism. 3, 1-13 (2012).
- Stavropoulos, K. K., Carver, L. J. Oscillatory rhythm of reward: anticipation and processing of rewards in children with and without autism. Molecular Autism. 9, 4 (2018).
- Damen, E. J., Brunia, C. H. Changes in heart rate and slow brain potentials related to motor preparation and stimulus anticipation in a time estimation task. Psychophysiology. 24 (6), 700-713 (1987).
- Chwilla, D. J., Brunia, C. H. Event-related potentials to different feedback stimuli. Psychophysiology. 28 (2), 123-132 (1991).
- Kotani, Y., et al. Effects of information and reward on stimulus-preceding negativity prior to feedback stimuli. Psychophysiology. 40 (5), 818-826 (2003).
- Kotani, Y., Hiraku, S., Suda, K., Aihara, Y. Effect of positive and negative emotion on stimulus-preceding negativity prior to feedback stimuli. Psychophysiology. 38 (6), 873-878 (2001).
- Kotani, Y., et al. The role of the right anterior insular cortex in the right hemisphere preponderance of stimulus-preceding negativity (SPN): an fMRI study. Neuroscience Letters. 450 (2), 75-79 (2009).
- Kotani, Y., et al. Source analysis of stimulus-preceding negativity constrained by functional magnetic resonance imaging. Biological Psychology. 111, 53-64 (2015).
- Brunia, C. H., van Boxtel, G. J. M., Böcker, K. B. E. The Oxford Handbook of Event-Related Potential Components. , Oxford University Press. (2011).
- van Boxtel, G. J. M., Böcker, K. B. E. Cortical Measures of Anticipation. Journal of Psychophysiology. 18 (2-3), 61-76 (2004).
- Ohgami, Y., Kotani, Y., Hiraku, S., Aihara, Y., Ishii, M. Effects of reward and stimulus modality on stimulus-preceding negativity. Psychophysiology. 41 (5), 729-738 (2004).
- Takeuchi, S., Mochizuki, Y., Masaki, H., Takasawa, N., Yamazaki, K. Stimulus preceding negativity represents arousal induced by affective picture. International Congress Series. (1278), (2005).
- Parker, A. B., Gilbert, D. G. Brain activity during anticipation of smoking-related and emotionally positive pictures in smokers and nonsmokers: a new measure of cue reactivity. Nicotine & Tobacco Research. 10 (11), 1627-1631 (2008).
- Poli, S., Sarlo, M., Bortoletto, M., Buodo, G., Palomba, D. Stimulus-preceding negativity and heart rate changes in anticipation of affective pictures. International Journal of Psychophysiology. 65 (1), 32-39 (2007).
- Tottenham, N., et al. The NimStim set of facial expressions: judgments from untrained research participants. Psychiatry Research. 168 (3), 242-249 (2009).
- Wechsler, D. Wechlser Abbreviated Scale of Intelligence (WASI). The Psychological Corporation. , (1999).
- Lord, C., et al. Autism Diagnostic Observation Schedule: ADOS-2. Western Psychological Services. , (2012).
- Lopez-Calderon, J., Luck, S. J. ERPLAB: an open-source toolbox for the analysis of event-related potentials. Frontiers in Human Neuroscience. 8, 213 (2014).
- Luck, S. J. An introduction to the event-related potential technique. , MIT Press. (2005).
- Bruder, G. E., Kayser, J., Tenke, C. E. Oxford handbook of event-related potential components. , Oxford University Press. (2012).
- Yau, S. H., McArthur, G., Badcock, N. A., Brock, J. Case study: auditory brain responses in a minimally verbal child with autism and cerebral palsy. Frontiers in Neuroscience. 9, 208 (2015).
