

Summary
This study introduces a protocol for measuring microcirculation in human oral mucosa by laser speckle contrast imaging. The monitoring of wound healing after vestibuloplasty combined with a xenogenic collagen graft is presented on a clinical case.
Abstract
Laser speckle contrast imaging (LSCI) is a novel method for measuring superficial blood perfusion over large areas. Since it is non-invasive and avoids direct contact with the measured area, it is suitable for monitoring blood flow changes during wound healing in human patients. Vestibuloplasty is periodontal surgery to the oral vestibule, aiming to restore vestibular depth with simultaneous enlargement of the keratinized gingiva. In this special clinical case, a split thickness flap was elevated at the first upper premolar and a xenogenic collagen matrix was adapted to the resulting recipient bed. LSCI was used to monitor the re- and neovascularization of the graft and the surrounding mucosa for one year. A protocol is introduced for the correct adjustment of microcirculation measurement in the oral mucosa, highlighting difficulties and possible failures.
The clinical case study presented demonstrated that — following the appropriate protocol — LSCI is a suitable and reliable method for following up microcirculation in a healing wound in the human oral mucosa and gives useful information on graft integration.
Introduction
Monitoring long-term changes of human gingival microcirculation in a clinical situation is a hot topic in oral and periodontal surgery. However, reliable assessment of perfusion can be difficult. There are only a few methods that do not invasively measure changes in the blood circulation of the human mucosa. Two of these employ a laser beam1,2,3,4, but in a different way. Laser doppler flowmetry (LDF) makes use of the Doppler shift in a laser beam5,6, while the laser speckle contrast imaging (LSCI) method relies on the speckle pattern of the backscattered laser light to measure the velocity of red blood cells7.
LDF measures only in a single point, and reproducible standardization of the sensors' position is a desirable yet difficult task. Another problem is that the probe of the LDF is small in diameter (1 mm2). Measuring at predetermined points before surgery is too specific, and may be blind to postoperative circulatory changes, while edema, tissue removal, tissue movement or the implanted graft cause significant changes in the postoperative geometry of the affected soft tissue. The measuring distance of LDF is less than 1 mm which prohibits use of a dental splint with a predetermined hole for the probe in case of volumetric change of the tissue. LSCI does not require any special tools for localization and can measure in areas of several cm2. As a result, wound healing can be followed throughout the surgical site. In addition, LSCI can display blood perfusion in color-coded images at a fraction of a second, with a resolution of up to 20 μm.
The LSCI device presented in this paper is used mostly for animal research applications where high resolution in small measurement areas is desired. However, since the structure and histology of the human oral mucosa are different from area to area (attached gingiva, marginal gingiva, vestibular mucosa), blood circulation is also heterogeneous8. Therefore, high-resolution LSCI has a great advantage over normal-resolution LSCI which is usually used in human testing.
The LSCI instrument employs an invisible laser (wavelength 785 nm). The beam is diverged to illuminate the measurement area, creating a speckle pattern. A CCD camera images the speckle pattern in the illuminated area. The CCD camera used in this system has an active imaging area of 1386 x 1034 pixels and its resolution is between 20–60 µm/pixel depending on the size of the measurement area and on the setting of the software (low, medium, high). It can take images at a speed of 16 frames per second, or even more, up to 100 frames per second, if the image size is reduced. Blood perfusion is calculated by the built-in software. It analyzes variations in the speckle pattern and quantifies the contrast. The resulting flux is color coded to produce a perfusion image. According to our previous results, LSCI assesses the blood perfusion of the gingiva with good repeatability and reproducibility9. This implies that it is a reliable tool for monitoring changes in the microcirculation of the oral mucosa not only in short-term experiments, but also during long-term studies to track disease progression or wound healing10.
In this paper, we present a clinical case report to demonstrate that the high spatial resolution of LSCI makes it possible to reveal the neovascularization pattern of a xenogenic collagen graft. Furthermore, this case indicates that LSCI, owing to its high reliability, could sensitively detect individual variation. This is important as significant local anatomical variation and a different systemic background between the cases makes it difficult to standardize the surgical intervention in clinical trials of periodontal surgery.
Subscription Required. Please recommend JoVE to your librarian.
Protocol
The reported method was employed in a clinical trial which was granted ethical approval from the Hungarian Committee of the Health Registration and Training Center (approval number: 034310/2014/OTIG).
1. LSCI Setup
- Switch on the computer and any peripherals.
- Switch on the LSCI instrument to be used with the switch on the rear panel.
- Allow the instrument to warm up for at least 5 min. The instrument is ready for measurement when both LEDs on the rear panel have stopped flashing.
- Start the software by double-clicking on the software icon on the desktop or via the Start menu.
- Wait until both the yellow and the green LEDs on the rear panel have stopped flashing, which indicates that the laser is warm and initialization is finished.
Note: When starting up the system, one will occasionally be prompted to perform the verification procedure for the system.
2. System Verification
- Use the calibration box supplied. Remove the lid from the calibration box and shake it to avoid sedimentation in the colloidal suspension.
- Leave the lid off for 30 s to avoid bubbles.
- Put the lid back on the calibration box.
- Click Advanced | Verification | Verify instrument.
- Select Routine verification | Next.
- Turn the head 90°, fasten the calibration box using the integrated magnets and click Next.
- Enter the room temperature in the text box, select °C and click Start.
- Wait while the wizard completes the verification procedure.
- After a successful verification procedure close the wizard by clicking Finish.
3. Participant Preparation
- Make sure that measurement is performed in a temperature-controlled room (26 °C).
- Place the patient in a comfortable supine position in a dental chair and place a vacuum pillow under his head (Figure 1).
- Leave the patient undisturbed for 15 min before any measurements are taken.
4. Microcirculation Image Measurement
- In the Tools menu, select and click on Project Editor. A new window opens in which the commonly used settings can be saved.
- In the Projects box, click New to create a new project. Enter the “Vestibulum” and click OK.
- In the Sites box, click New to create a new site. Enter “Tooth 14” and click OK.
- Under the Contents of Tooth 14 panel add “10 cm” as the required distance for the Working Distance and enter a width of 3 cm and a height of 2 cm in the measurement boxes.
- Set the point density resolution to normal and the frame rate to 16 images/s and select Time from the Duration drop-down menu to set the recording duration to 0:30.
- Select “Record with no averaging” and set the color photo capture rate to 1/second.
- Then click “Apply” and “OK” to save the Project parameters.
- In the File menu, select and click New recording. A new Image Window will open and the Setup panel will be displayed.
- Under Recording Setup, select “Vestibulum” for the Project and “Tooth 14” for the 4.9. Site.
- Open the Subject drop-down menu, click New in the Select subject dialog box, and enter the name of the Patient.
- Click OK and enter a name for the recording in the Rec Name field: e.g., day 1 (days elapsed after the operation) and the name of the operator in the Operator field.
- Before beginning the microcirculation image measurement, measure patient’s blood pressure and pulse.
- Evacuate the air from the vacuum pillow to fix the patient’s head in a position appropriate to the area under investigation.
- Ask patient to open his mouth.
- Retract lips gently by two dental mirrors (Figure 1).
- Adjust the instrument’s head parallel to the measured area of the gingiva. A built-in visible (650 nm) indicator laser facilitates the positioning of the imager relative to the patient's mouth.
- Adjust the working distance to 10 cm by moving the instrument in relation to the tissue. The distance is measured continuously by the LSCI device and it is displayed by the software as working distance/measured value under Image Setup.
- Instruct the subject to remain still for the duration of the measurement.
- Click on the Record button to start recording. The color of the Image Window now changes to red, indicating that recording is in progress. The Setup panel is replaced by the Recording panel. Recording stops automatically after 30 s. When recording is finished, the color of the Image Window changes to blue and the Recording panel is replaced by the Review panel.
- Remove dental mirrors and allow the patient to close his mouth and swallow.
- Switch back to the live image by pressing the Resume recording button.
- Repeat the steps from 4.14 to 4.21 twice.
- Close the file. The data are saved automatically.
- Measure blood pressure and pulse after the LSCI measurements.
5. Offline Analysis
- Analyze the LSCI images using the built-in software. Go to Image or Split view (Figure 2).
- Define regions of interest (ROI). Note: the perfusion values of pixels within a ROI are averaged and defined as the blood flow value of the ROI, expressed in an arbitrary value called Laser Speckle Perfusion Unit (LSPU).
- Select the desired ROI shape within the ROI tools palette on the right.
- Select the Apply option in the ROI tools palette, which applies ROI operations to all images of the recording.
- Draw the ROI by clicking and holding the mouse button in the intensity image, dragging the ROI out to the desired size, and releasing the mouse button (click and double-click for free-form ROIs). Adjust the position of the ROI, resize or rotate it, if needed.
- Repeat steps from 5.3. to 5.5 as many times as the desired number of ROIs (Figure 3).
- Define time periods of interest (TOI). This allows for averaging perfusion in a ROI over a definite period of time (Figure 2).
- Go to Graph or Split view. Select the Add TOI tool button.
- Click and hold on the graph at the position where you want the TOI to begin and drag the cursor to the desired end position. Then release the mouse button.
- Export data from the mean value table for further processing.
- Construct blood flow curves by a suitable software used for statistical analysis.
Subscription Required. Please recommend JoVE to your librarian.
Representative Results
Vestibuloplasty is periodontal surgery to the oral vestibule, aiming to increase vestibular depth, the zone of keratinized gingiva and soft tissue thickness for enhanced aesthetics and function. The apically repositioned split thickness flap combined with a collagen matrix is a frequently used vestibuloplasty procedure. Xenogenic collagen matrix is a viable alternative to autogenous gingival graft for increasing the amount of keratinized gingiva11,12,13; however, no data are available on the direction of graft revascularization and on how it affects the microcirculation of the surrounding tissues. Understanding these mechanisms may facilitate proper flap and incision design in periodontal surgery.
A 17 year-old male patient with an inadequate width of keratinized gingiva at the first premolar in the maxilla was treated by vestibuloplasty, using an apically repositioned split thickness flap combined with a collagen matrix. Intraoral photographs (taken by a photo camera) and blood flow (BF) measurements by LSCI were taken before the vestibuloplasty (baseline) as well as 1, 2, 3, 4, 5, 7, 9, 11, 14, 21, 27 days and 2, 3, 4, 5, 6 and 12 months postoperatively. Blood pressure and pulse were evaluated before and after each measurement.
During offline analysis, multiple ROIs were determined in the area of the augmented mucosa; some in the graft region and others in the surrounding mucosa, defined as 'peri' regions. As shown in Figure 3, the 'peri' and graft regions were further split into zones depending on distance from the center of the implanted graft, marked as zone F in the picture. Zones A and B were defined in the 'peri' region and zones C, D and E in the graft region. Each of these zones was delimited separately at all four sides of the graft (mesial, distal, apical and coronal). Each 30-second shot was identified as a TOI (Figure 2). Data at each ROI and TOI were exported into a spreadsheet program. Blood flow curves were constructed by a suitable software used for statistical analysis.
There was no significant change in mean arterial pressure (MAP) during the one-year experiment, either in MAP before or after the blood flow measurements per session. Figure 4 shows a color photo, an intensity image and a perfusion image of the operated gingiva on the representative days of our study. During the first postoperative week complete flap closure, a thick layer of fibrin on the grafted area, and mild erythema and edema in the surrounding gingiva were visible. Blood perfusion images showed ischemia in the operated region and hyperemia in the 'peri' regions. From day 14, the grafted area was clinically erythematous, in parallel with severe hyperemia observed on blood perfusion images. By the third month after graft incorporation, the wound healed, and gingival perfusion was close to preoperative circulation levels.
Figure 5 shows a blurred intensity image and the perfusion graph of the entire image. The sudden peak on the graph indicates movement by the patient. The measurement was repeated immediately, after making sure that the patient is in a comfortable position. Changes in BF in the different zones within the graft and in the 'peri' regions are shown in Figure 6. It is common in all curves that from the fourth month, blood flow did not change any further until the end of the investigation. The average blood flow for this period could be used as a resting blood flow value for the new tissue and the random variation between time points allowed us to calculate the time-based variance component for each ROI respectively, using a linear mixed model. The minimum detectable difference could be calculated then to identify real change (with 95% confidence) between time points during the healing period (before the fourth month) in order to determine the hyperemic and the ischemic phase. The basic characteristics of curves were similar in all ROIs within the graft, starting with an ischemic phase followed by a hyperemic phase. However, the length of these two phases was different (Table 1). Ischemia was longest (7–9 days) in the central and in all coronal zones, with late hyperemia starting between day 11 and 27. In other zones of the graft, ischemia lasted only 4–7 days and hyperemia started earlier, between day 7 and 21.
The BF curves of the zones at the different sides of the graft had unique characteristics (Figure 6). At the apical side, all four zones had similar blood flow curves. At the coronal side, perfusion was regained in the outer zone later than in the inner zones, contrary to the mesial and distal side. At both lateral sides, BF increased first in zone C, then in zone D, followed by BF increase in zone E and finally in the central zone F. In the zones of the surrounding mucosa (zone A and B) no significant ischemia was observed. Instead, hyperemia of a different magnitude and extent was observed at the different sides.
There were two time points when the BF value did not tally with the overall characteristics of the BF curve. On day 9, there was a sudden drop in most zones and mainly in the 'peri' zones of the apical and distal side. It cannot be stated with certainty that this was a measurement error, as no measurements were taken on the previous and on the following day. However, according to a note in the measurement report, the buccal fold was retracted with too much pressure by the operator, resulting in a drop in BF. This makes sense considering that mainly the circulation of the distal and apical sides could have been affected by pulling the cheek. On day 182 (6 months later), due to longer intervals between measurement times, the patient has forgotten to keep to the agreed restrictions before the measurement. The bleeding of the marginal gingiva on the colored photograph (Figure 6) indicates harsh tooth brushing prior to the measurement. In the meantime, the patient underwent orthodontic treatment, too, and he used intermaxillary elastics. Both factors could greatly increase BF14,15, so the measurement was repeated at a later time under more carefully controlled circumstances.

Figure 1: Experimental LSCI setup and patient preparation for blood flow measurement in the operated area. The lips are retracted by dental mirrors. Please click here to view a larger version of this figure.
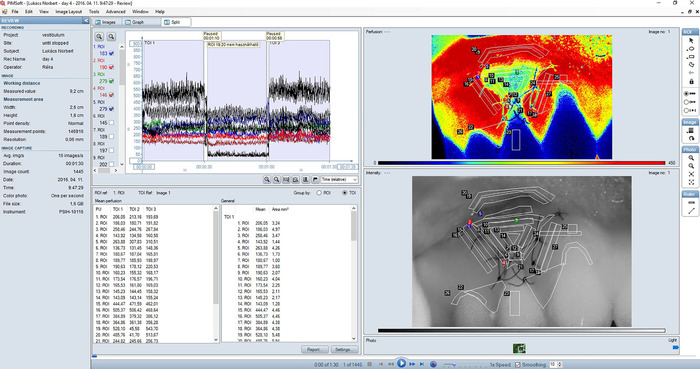
Figure 2: Split view (combination of the Images view and the Graph view) of a typical recording of gingival blood flow in the treated area. Perfusion image (upper right sub-view) is a color-coded representation of blood perfusion in the gingiva. Areas of high perfusion are shown in red while areas of low perfusion are blue. The color range of perfusion images corresponds to 0-450 LSPU; smoothing was set to 10. An intensity image (lower right sub-view) is created by the total backscattered laser light. It corresponds exactly with the perfusion image and is useful for orientation and for identifying details in the perfusion image. Regions of interest (ROI) are always defined in the intensity image. The graph (upper left panel) shows real-time blood perfusion traces for each ROI in the recording. Check boxes to the left can be used to select which traces to show. Three consecutive measurements are shown on the graph. Each 30 s shot was identified as a TOI. A mean value table showing mean perfusion values in each ROI and TOI is also displayed in Split view (lower left panel). Please click here to view a larger version of this figure.

Figure 3: Regions of interest (ROI) defined within the examined gingival area in the intensity image. Zone A and B are in the 'peri' region, while zone C, D and E are in the graft at decreasing distances from the center of the graft, marked as zone F. Zone A is situated on the vestibular surface of the lips. Please click here to view a larger version of this figure.

Figure 4: Representative photographs (upper line), LSCI intensity image (middle line) and LSCI perfusion image (lower line) of the operated gingiva. The images represent the preoperative state and perfusion, and wound healing and perfusion 1, 4, 7, 14, 21, 27 and 98 days postoperatively. Please click here to view a larger version of this figure.
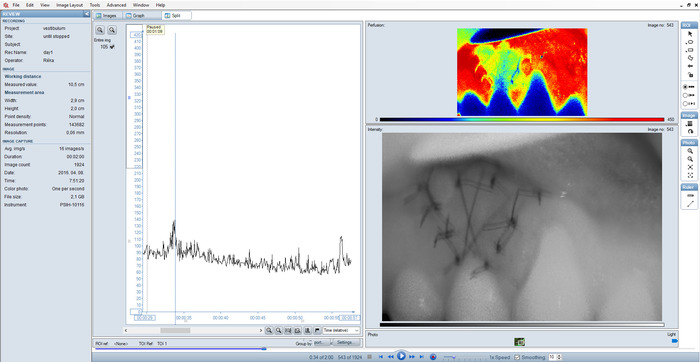
Figure 5: Split view of a sub-optimal recording. Blurred intensity image and outlying peaks on the graph as a result of incorrect setting. Please click here to view a larger version of this figure.

Figure 6: Scatter plot of BF over time at the coronal (a), mesial (b), distal (c) and apical (d) side of the graft. The central part of the graft (zone F) was depicted in all graphs to serve as a reference for more external zones. Please click here to view a larger version of this figure.
| Side | Zone | Ischemia end | Hyperemia start | Hyperemia end |
| coronal | c | 9 | 27 | 27 |
| coronal | d | 9 | 21 | 27 |
| coronal | e | 7 | 11 | 98 |
| central | f | 9 | 11 | 98 |
| mesial | c | 5 | 21 | 27 |
| mesial | d | 5 | 11 | 61 |
| mesial | e | 7 | 11 | 61 |
| distal | c | 5 | 11 | 27 |
| distal | d | 4 | 7 | 98 |
| distal | e | 4 | 11 | 98 |
| apical | c | 4 | 11 | 27 |
| apical | d | 5 | 11 | 61 |
| apical | e | 5 | 11 | 61 |
Table 1: Time frame of the ischemic and hyperemic phase in the various zones in the graft, in days
Subscription Required. Please recommend JoVE to your librarian.
Discussion
The aim of this study was to introduce a novel technique for monitoring the neovascularization of a graft in the human gingiva. According to our previous results, LSCI assesses the blood perfusion of the gingiva with good repeatability and reproducibility9, when strict implementation of each step of the planned protocol as a critical requirement is met. LSCI is regarded as a semi-quantitative technique that requires calibration periodically to ensure accuracy and stability. During verification, the room temperature must be measured as accurately as possible, because this value is used by the verification algorithm to calculate perfusion.
The LSCI method is highly sensitive to the working distance setting and movement artifacts as well. In this study, working distance was fixed at 10 cm. The measurement area was 2.7 cm x 2 cm, which corresponds to an approximately three teeth wide gingival area. The effective frame rate was 16 images/s and 0.06 s/image as the arterial pulse induces pulsatile changes in gingival microcirculation9, which has to be averaged out from the recording. Rapid imaging reduced the risk of movement artefacts, too. However, in case of incorrect settings or patient movements, the recording should be stopped and repeated under optimum conditions.
Two operators took part in every measurement: one adjusted the LSCI head and controlled the computer while the other retracted the lips of the patient. In this study, three repeated measurements were performed in each session, each taking 30 s. Since measurements always involve some kind of irritation to the soft tissue due to the inevitable retraction of the lips and cheeks, which disturbs the microcirculation of the gingiva, an increase in random error occurs. Such inter-day variation, however, can be minimized by repeating the entire measurement process, i.e., by re-opening the mouth, retracting the soft tissue again, re-setting the camera's position and re-selecting ROIs in the software9.
Gingival microcirculation showed high regional variation8. Therefore, a method such as LSCI which measures blood flow in a wide area has a great advantage over single point measurement techniques like LDF. In this study, the measurement area covered the whole surgical field. The wide measurement area allowed us to compare re- or neovascularization in various regions within the wounded area in our study. Contrary to LDF, where the probe is fixed by stents fabricated before surgery, in the case of the LSCI method, there is no need to define the region to be examined in advance. For the primary aim of monitoring wound healing in personalized medicine is to recognize unexpected patterns anywhere around the wound or the flap. In addition, postoperative changes in tissue geometry and edema caused by soft or hard tissue augmentation would make the pre-fabricated stents useless after surgery. To help visual evaluation, smoothing was turned on during recording and the smoothing value was set to 10. This means that perfusion was averaged over ten images for a smoother appearance of the perfusion image and in order to decrease background noise. However, smoothing is only a visual effect and does not influence actual recorded perfusion values.
Gingival blood flow has a high temporal variation as well. This may be related to many physiological factors which accompany everyday life, such as gingival inflammation16,17,18, circadian rhythm19, blood pressure20, temperature16,21, mechanical pressure8,22,23,24, tooth brushing14,17,25 or orthodontic force15. Therefore, the standardization and stabilization of these factors is obligatory for successful follow-up measurements.
The methods used earlier for investigating graft vascularization are highly invasive, which meant a major restriction on measurement time points during healing, especially in human studies26,27,28,29,30,31,32. They also have limitations in terms of measuring regional differences quantitatively. Our previous studies9,10 have already proved the high reliability of LSCI in clinical trials and it was found to be useful to determine the time of soft tissue healing of an individual after tooth extraction in order to optimize implant placement33. In this study, the wound area covered by a xenogenic collagen graft showed excellent neovascularization, as on the 11th postoperative day all zones within the graft achieved the maximum blood flow level. However, it could be presumed that the collagen graft sloughed off or was resorbed by day 11 and we actually measured the revascularization of the recipient bed. In addition to its non-invasive feature, another special attribute of LSCI is a capability to characterize reperfusion curves at various regions of a graft during incorporation at individual level. The centripetal characteristics of graft neovascularization are similar to previous histology observations30. This suggests that graft revascularization not only occurs from the periosteal vascular plexus but also from the wound margin.
The experiment presented shows that the revascularization of a graft can be clearly followed up if every step is followed strictly. However, on day 182, non-compliant patient preparation and instruction resulted in a significant increase in BF.
LSCI is extensively used for full-field imaging of vascular structure and associated blood flow in other tissues, like in the retina34,35, the skin7,36 and the brain37,38. The most promising clinical applications of LSCI are burn wound assessment39,40, evaluation of flaps41 and intraoperative cerebral blood flow monitoring42. Apparently, there are serious limitations to widespread gingival measurements by LSCI in human subjects. This tool is very robust and heavy. The main difficulties arise in connection with the documentation camera, which has low resolution and is located a few centimeters away from the measurement camera. These features make it difficult to identify regions of interest directly on color photos. The size of the LSCI machine head prevents shooting inside the oral cavity. Therefore, areas which are not visible directly may not be measured. We have demonstrated earlier that using an indirect approach with a photographic mirror may serve as an alternative method9. However, using a mirror involves more movement artifacts which LSCI is sensitive to, makes it more difficult to capture a perpendicular image and decreases the focal distance. When the measured area cannot be captured perpendicularly, the blood flow value may be correct9,39, but region identification on the image remains complicated because of 3D torsion.
Subscription Required. Please recommend JoVE to your librarian.
Disclosures
The authors have nothing to disclose.
Acknowledgments
This work was carried out in part from support by the Hungarian Scientific Research Fund under Grant Number K112364, by the Hungarian Ministry of Human Capacities, Higher Education Excellence Program to Semmelweis University, Therapy Research Module and by the National Research, Development and Innovation Office KFI_16-1-2017-0409. The authors thank Dr. Bálint Molnár, co-worker of the Department of Periodontology, Semmelweis University, who performed the vestibuloplasty in the presented clinical case.
Materials
| Name | Company | Catalog Number | Comments |
| PeriCam PSI-HR | Perimed AB, Stockholm, Sweden | The PeriCam PSI System is an imaging system based on LASCA technology (LAser Speckle Contrast Analysis). The system measures superficial blood perfusion over large areas at fast capture rates. This makes it ideal for investigations of both the spatial and temporal dynamics of microcirculation in almost any tissue. | |
| PIMSoft | Perimed AB, Stockholm, Sweden | PIMSoft is a data acquisition and analysis software, intended for use together with the PeriCam PSI System and the PeriScan PIM 3 System, for measurement and imaging of superficial blood perfusion. | |
| Geistlich Mucograft | Geistlich, Switzerland | It's a unique 3D collagne matrix designed specifically for soft tissue regeneration. It's indicated for the gain of keratinized tissue and recession coverage. | |
| Omron M4 | Omron Healthcare Inc., Kyoto, Japan | Blood pressure monitor, which gives accurate readings. | |
| Nikon D5200 | Nikon Corportation, Tokyo, Japan | Taking intra oral photos | |
| MS Excel | Microsoft Corporation, Redmond, Washington, USA | The software used for data management | |
| IBM SPSS Statistics 25 | IBM Corp., Armonk, NY, USA | The software used for statistical analysis |
References
- Nakamoto, T., et al. Two-Dimensional Real-Time Blood Flow and Temperature of Soft Tissue Around Maxillary Anterior Implants. Implant Dentistry. 21 (6), 522-527 (2012).
- Kajiwara, N., et al. Soft tissue biological response to zirconia and metal implant abutments compared with natural tooth: microcirculation monitoring as a novel bioindicator. Implant Dentistry. 24 (1), 37-41 (2015).
- Kemppainen, P., Forster, C., Handwerker, H. O. The importance of stimulus site and intensity in differences of pain-induced vascular reflexes in human orofacial regions. Pain. 91 (3), 331-338 (2001).
- Kemppainen, P., Avellan, N. L., Handwerker, H. O., Forster, C. Differences between tooth stimulation and capsaicin-induced neurogenic vasodilatation in human gingiva. Journal of Dental Research. 82 (4), 303-307 (2003).
- Riva, C., Ross, B., Benedek, G. B. Laser Doppler measurements of blood flow in capillary tubes and retinal arteries. Investigative ophthalmology. 11 (11), 936-944 (1972).
- Humeau, A., Steenbergen, W., Nilsson, H., Stromberg, T. Laser Doppler perfusion monitoring and imaging: novel approaches. Medical & Biological Engineering & Computing. 45 (5), 421-435 (2007).
- Briers, J. D., Webster, S. Laser speckle contrast analysis (LASCA): a nonscanning, full-field technique for monitoring capillary blood flow. Journal of Biomedical Optics. 1 (2), 174-179 (1996).
- Fazekas, R., et al. Functional characterization of collaterals in the human gingiva by laser speckle contrast imaging. Microcirculation. 25 (3), 12446 (2018).
- Molnar, E., Fazekas, R., Lohinai, Z., Toth, Z., Vag, J. Assessment of the test-retest reliability of human gingival blood flow measurements by Laser Speckle Contrast Imaging in a healthy cohort. Microcirculation. 25 (2), (2018).
- Molnar, E., et al. Evaluation of Laser Speckle Contrast Imaging for the Assessment of Oral Mucosal Blood Flow following Periodontal Plastic Surgery: An Exploratory Study. BioMed Research International. 2017, 4042902 (2017).
- Sanz, M., Lorenzo, R., Aranda, J. J., Martin, C., Orsini, M. Clinical evaluation of a new collagen matrix (Mucograft prototype) to enhance the width of keratinized tissue in patients with fixed prosthetic restorations: a randomized prospective clinical trial. Journal of Clinical Periodontology. 36 (10), 868-876 (2009).
- Nevins, M., Nevins, M. L., Kim, S. W., Schupbach, P., Kim, D. M. The use of mucograft collagen matrix to augment the zone of keratinized tissue around teeth: a pilot study. The International Journal of Periodontics and Restorative Dentistry. 31 (4), 367-373 (2011).
- Lorenzo, R., Garcia, V., Orsini, M., Martin, C., Sanz, M. Clinical efficacy of a xenogeneic collagen matrix in augmenting keratinized mucosa around implants: a randomized controlled prospective clinical trial. Clinical Oral Implants Research. 23 (3), 316-324 (2012).
- Perry, D. A., McDowell, J., Goodis, H. E. Gingival microcirculation response to tooth brushing measured by laser Doppler flowmetry. Journal of Periodontology. 68 (10), 990-995 (1997).
- Yamaguchi, K., Nanda, R. S., Kawata, T. Effect of orthodontic forces on blood flow in human gingiva. Angle Orthodontist. 61 (3), 193-203 (1991).
- Molnár, E., et al. Assessment of heat provocation tests on the human gingiva: the effect of periodontal disease and smoking. Acta Physiologica Hungarica. 102 (2), 176-188 (2015).
- Gleissner, C., Kempski, O., Peylo, S., Glatzel, J. H., Willershausen, B. Local gingival blood flow at healthy and inflamed sites measured by laser Doppler flowmetry. Journal of Periodontology. 77 (10), 1762-1771 (2006).
- Hinrichs, J. E., Jarzembinski, C., Hardie, N., Aeppli, D. Intrasulcular laser Doppler readings before and after root planing. Journal of Clinical Periodontology. 22 (11), 817-823 (1995).
- Svalestad, J., Hellem, S., Vaagbo, G., Irgens, A., Thorsen, E. Reproducibility of transcutaneous oximetry and laser Doppler flowmetry in facial skin and gingival tissue. Microvascular Research. 79 (1), 29-33 (2010).
- Sasano, T., Kuriwada, S., Sanjo, D. Arterial blood pressure regulation of pulpal blood flow as determined by laser Doppler. Journal of Dental Research. 68 (5), 791-795 (1989).
- Ikawa, M., Ikawa, K., Horiuchi, H. The effects of thermal and mechanical stimulation on blood flow in healthy and inflamed gingiva in man. Archives of Oral Biology. 43 (2), 127-132 (1998).
- Baab, D. A., Oberg, P. A., Holloway, G. A. Gingival blood flow measured with a laser Doppler flowmeter. Journal of Periodontal Research. 21 (1), 73-85 (1986).
- Fazekas, A., Csempesz, F., Csabai, Z., Vág, J. Effects of pre-soaked retraction cords on the microcirculation of the human gingival margin. Operative Dentistry. 27 (4), 343-348 (2002).
- Csillag, M., Nyiri, G., Vag, J., Fazekas, A. Dose-related effects of epinephrine on human gingival blood flow and crevicular fluid production used as a soaking solution for chemo-mechanical tissue retraction. Journal of Prosthetic Dentistry. 97 (1), 6-11 (2007).
- Tanaka, M., Hanioka, T., Kishimoto, M., Shizukuishi, S. Effect of mechanical toothbrush stimulation on gingival microcirculatory functions in inflamed gingiva of dogs. Journal of Clinical Periodontology. 25 (7), 561-565 (1998).
- Rothamel, D., et al. Biodegradation pattern and tissue integration of native and cross-linked porcine collagen soft tissue augmentation matrices - an experimental study in the rat. Head & Face Medicine. 10, 10 (2014).
- Schwarz, F., Rothamel, D., Herten, M., Sager, M., Becker, J. Angiogenesis pattern of native and cross-linked collagen membranes: an immunohistochemical study in the rat. Clinical Oral Implants Research. 17 (4), 403-409 (2006).
- Vergara, J. A., Quinones, C. R., Nasjleti, C. E., Caffesse, R. G. Vascular response to guided tissue regeneration procedures using nonresorbable and bioabsorbable membranes in dogs. Journal of Periodontology. 68 (3), 217-224 (1997).
- Oliver, R. C., Loe, H., Karring, T. Microscopic evaluation of the healing and revascularization of free gingival grafts. Journal of Periodontal Research. 3 (2), 84-95 (1968).
- Janson, W. A., Ruben, M. P., Kramer, G. M., Bloom, A. A., Turner, H. Development of the blood supply to split-thickness free ginival autografts. Journal of Periodontology. 40 (12), 707-716 (1969).
- Mormann, W., Bernimoulin, J. P., Schmid, M. O. Fluorescein angiography of free gingival autografts. Journal of Clinical Periodontology. 2 (4), 177-189 (1975).
- Busschop, J., de Boever, J., Schautteet, H. Revascularization of gingival autografts placed on different receptor beds. A fluoroangiographic study. Journal of Clinical Periodontology. 10 (3), 327-332 (1983).
- Fazekas, R., et al. A proposed method for assessing the appropriate timing of early implant placements: a case report. Journal of Oral Implantology. , (2018).
- Briers, J. D., Fercher, A. F. Retinal blood-flow visualization by means of laser speckle photography. Investigative Ophthalmology & Visual Science. 22 (2), 255-259 (1982).
- Srienc, A. I., Kurth-Nelson, Z. L., Newman, E. A. Imaging retinal blood flow with laser speckle flowmetry. Front Neuroenergetics. 2, (2010).
- Choi, B., Kang, N. M., Nelson, J. S. Laser speckle imaging for monitoring blood flow dynamics in the in vivo rodent dorsal skin fold model. Microvascular Research. 68 (2), 143-146 (2004).
- Ayata, C., et al. Laser speckle flowmetry for the study of cerebrovascular physiology in normal and ischemic mouse cortex. Journal of Cerebral Blood Flow & Metabolism. 24 (7), 744-755 (2004).
- Armitage, G. A., Todd, K. G., Shuaib, A., Winship, I. R. Laser speckle contrast imaging of collateral blood flow during acute ischemic stroke. Journal of Cerebral Blood Flow & Metabolism. 30 (8), 1432-1436 (2010).
- Lindahl, F., Tesselaar, E., Sjoberg, F. Assessing paediatric scald injuries using Laser Speckle Contrast Imaging. Burns. 39 (4), 662-666 (2013).
- Mirdell, R., Iredahl, F., Sjoberg, F., Farnebo, S., Tesselaar, E. Microvascular blood flow in scalds in children and its relation to duration of wound healing: A study using laser speckle contrast imaging. Burns. , (2016).
- Zotterman, J., Bergkvist, M., Iredahl, F., Tesselaar, E., Farnebo, S. Monitoring of partial and full venous outflow obstruction in a porcine flap model using laser speckle contrast imaging. Journal of Plastic, Reconstructive & Aesthetic Surgery. 69 (7), 936-943 (2016).
- Hecht, N., Woitzik, J., Dreier, J. P., Vajkoczy, P. Intraoperative monitoring of cerebral blood flow by laser speckle contrast analysis. Neurosurgical Focus. 27 (4), E11 (2009).
