Presented here is a protocol for field identification of Matricaria chamomilla using a portable qPCR system. This easy-to-perform protocol is ideal as a method to confirm the identity of a botanical species at locations where access to laboratory equipment and expertise is limited, such as farms and warehouses.
Method Article
Field Identification of Matricaria chamomilla using a Portable qPCR System
In This Article
Summary
Abstract
Quality control in botanical products begins with the raw material supply. Traditionally, botanical identification is performed through morphological assessment and chemical analytical methods. However, the lack of availability of botanists, especially in recent years, coupled with the need to enhance quality control to combat the stresses on the supply chain brought by increasing consumer demand and climate change, necessitates alternative approaches. The goal of this protocol is to facilitate botanical species identification using a portable qPCR system on the field or in any setting, where access to laboratory equipment and expertise is limited. Target DNA is amplified using dye-based qPCR, with DNA extracted from botanical reference materials serving as a positive control. The target DNA is identified by its specific amplification and matching its melting peak against the positive control. A detailed description of the steps and parameters, from hands-on field sample collection, to DNA extraction, PCR amplification, followed by data interpretation, has been included to ensure that readers can replicate this protocol. The results produced align with traditional laboratory botanical identification methods. The protocol is easy to perform and cost-effective, enabling quality testing on raw materials as close to the point of origin of the supply chain as possible.
Introduction
The practice of using botanicals to maintain and improve health dates back to thousands of years. Due to stresses on the supply chain brought by increased consumer demand1, unsustainable harvesting practices and climate change2, botanical adulteration is becoming a growing concern in the food and dietary supplement industry3. The presence of undeclared or misidentified botanical species may lead to reduced efficacy, or even safety issues. For example, black cohosh (Actaea racemosa), used for treating premenstrual discomfort, may be substituted with a low-priced Asian species with limited clinical data support for its efficacy4. In a more serious case, substitution of Aristolochia fangchi for Stephania terandra in a clinical study for weight loss using Chinese herbs led to severe nephrotoxicity and renal failure in some participants5,6. The two different species shared a Chinese common name “Fang Ji”. These cases highlight the need for more stringent quality control, starting with the identification of raw materials7, preferably as close to the point of origin of the supply chain as possible, so resources can be efficiently allocated to the material of correct identity.
A number of orthogonal approaches can be used for botanical identification. Traditionally, botanical identification is performed through morphological assessment8,9 and chemical analytical methods10,11,12,13. Morphological identification is based on differences in macroscopic and microscopic features of plant materials if differences exist (Figure 1). However, the lack of training programs on classical botany in the recent years has resulted in a shortage of experts14, making this approach impractical for routine quality control. Its application in powdered botanical materials is also limited. Chemical analytical methods are widely used in pharmacopoeias and laboratories, but are not ideal for field testing due to the size of instruments such as High Performance Thin Layer Chromatography (HPTLC), High Performance Liquid Chromatography (HPLC), and Nuclear Magnetic Resonance Spectroscopy (NMR) (Figure 2), and environment requirements. Recently, genomic methods have emerged as an alternative technique for botanical species' authentication and substitution detection and has proven to be efficient and precise. Genomic methods exploit the high fidelity and specificity of genetic information in plant materials15,16,17,18,19. Molecular diagnostic tools are available in the form of portable devices, and often include automated data interpretation tools that lower the barrier to technology use, making this approach ideal for field identification20,21,22,23,24. Once the molecular analysis method has been designed and validated25,26,27, it can be performed by any personnel with basic molecular biology training. Among the different portable tools available, real-time PCR on DNA sequences is one of the cost-effective choices28. The combination of a portable device, together with customized and validated molecular analysis, allows verification of botanical species and ingredients outside the laboratory, such as in farms and botanical material warehouses, reducing the time and costs associated with traditional methods.
The goal of this protocol is to introduce a method for botanical identification in situations where access to laboratory equipment and expertise is limited or unavailable, using a portable qPCR system. The method is demonstrated on a field of Matricaria chamomilla (Figure 3A), commonly known as German chamomile, widely used for its anti-inflammatory and antioxidant properties29. It can be confused with related species of similar appearance or odor, especially from the genera Chamaemelum, Tanacetum, and Chrysanthemum30,31,32. Among the related species, Chamaemelum nobile, also known as Roman chamomile, is a noticeable one with comparable production levels in commerce (Figure 3B). The method demonstrated was designed to not only identify the target botanical species M. chamomilla, but also detect its close relative, C. nobile, based on specific amplification of DNA sequences.
This article explains, in detail, how to perform field botanical identification of M. chamomilla using intercalating dye-based qPCR and melt curve analysis on a portable device. The protocol includes the collection of botanical samples from the field, on-site DNA extraction, and set up of real-time PCR reaction. To ensure a valid conclusion, target botanical M. chamomilla and non-target botanical C. nobile genomic DNA, pre-extracted from certified botanical reference materials, are used as positive control. The specificity of this method is demonstrated by performing both M. chamomilla and C. nobile identification tests individually on samples and controls. Non-template negative control is used to exclude false positive results caused by PCR contamination.
Protocol
1. Sample collection
- Set up a testing area in the field with a flat and horizontal surface.
- Identify a representative plant that reflects the characteristics of majority of the plants in the chamomile flower field (Figure 4).
- Pick a flower head from the representative plant using sterile gloves.
- Place the sample into a 2.0 mL collection tube.
- Repeat steps 1.3 to 1.4 and collect a leaflet (approximately 0.5–0.7 cm long) from the same plant.
NOTE: M. chamomilla flower and leaf are small enough to sit at the bottom of a 2.0 mL collection tube. For other botanicals with larger surface area, a paper punch or scissors (rinsed in 70% ethanol prior to use) can be used to isolate tissue samples for testing. When multiple sampling is required, rinse the paper punch or scissors between handling of different samples.
2. DNA extraction
- Preheat the dry bath incubator to 95 °C.
- To each collection tube, add 100 µL of the extraction solution from the plant DNA extraction kit (listed in Table of Materials). For better DNA extraction efficiency, grind the tissue sample in the extraction solution using a tissue pestle.
- Close the tube. Ensure that the botanical tissue is covered with the extraction solution throughout the extraction process.
- Place the collection tubes in a preheated dry bath incubator and incubate the collection tubes at 95 °C for 10 min.
- After 10 min, take the tubes out of the dry bath incubator.
- Add 100 µL of the dilution solution from the same DNA extraction kit and mix the solution by pipetting up and down several times.
- Repeat the same step for leaflet extraction.
- Shake to mix the solution further. The plant tissue usually does not appear to be degraded after this treatment. The liquid color may change and become cloudy.
NOTE: The diluted solution can be stored at room temperature overnight if not proceeding immediately. It is not necessary to remove the cellular debris from plant tissue before storage. The liquid in the tubes holds the DNA templates for downstream PCR amplification.
3. PCR reaction setup
- Configure the qPCR instrument thermocycling conditions according to the manufacturer's specifications. Apply the PCR thermocycling profile listed in (Table 1), which starts with a constant temperature step for initial denaturation, followed by 25 cycles of amplification, and ends with temperature ramping to obtain a high-resolution melting curve.
- Thaw the qPCR Master Mix and primers (Table 2) at room temperature prior to use.
- Plan the reaction that will be loaded in each well: wells containing positive control with target species, positive control with non-target species, samples, and negative control (Figure 5).
- In this example, ten wells are used – five for the German chamomile identification test and the remaining five for the Roman chamomile identification test. For each type of species identification test, one well contains positive control with DNA extracted from targeted species’ reference material, one well contains positive control with DNA extracted from non-targeted species’ reference material, two wells are filled with flower and leaf DNA samples extracted from the field, and one well is allocated for a negative control. Table 3 describes each well type.
- Prepare a reaction master-mix according to the manual for each botanical species identification test. A typical reaction master-mix contains universal qPCR Master Mix (2x), forward and reverse species-specific primers, and nuclease-free water. Table 4 lists the reaction system composition.
NOTE: If not using immediately, store the qPCR reaction master-mix at +2 °C to +8 °C in a cooler or mini-fridge. - Thoroughly mix the reaction master-mix by pipetting before use.
- Place the qPCR cartridge face-up on a flat and stable surface.
- Load 18 µL of the reaction master-mix configured in step 3.4 into the cartridge wells according to the wells defined in step 3.3. For this demonstration, add the German chamomile identification test reaction master mix into wells labeled for GC test (GCT in wells 1, 3, 5, 7, 9) and the Roman chamomile identification test reaction master-mix into wells labeled for RC test (RCT in wells 2, 4, 6, 8, 10) (see Figure 5).
- Transfer 2 µL of sample DNA from the supernatant of DNA extraction tubes and pre-extracted DNA positive controls into cartridge wells preloaded with qPCR master mix. After adding each DNA template to the qPCR master mix, gently mix the solution by pipetting.
NOTE: Avoid floating cellular debris when transferring DNA from the DNA extraction tube. Use minicentrifuge to separate the supernatant and cellular debris, if necessary. - Carefully seal the cartridge with adhesive film. Load the cartridge onto the thermocycling chamber and close it.
- Set the qPCR instrument to run.
Results
Following the protocol described in section 1, botanical DNA from flower head and leaf were extracted into the supernatant after heat incubation of the collection tube at 95 °C for 10 min. In the current study, the supernatant showed a yellow and greenish color for both flower and leaf, indicating that a variety of natural compounds were released into the supernatant with botanical DNA (Figure 6). Although reliable PCR amplification was achieved later in triplicate for all field extracted DNA template, DNA quality assessment was performed in the laboratory as reference. The concentration of flower head DNA extract, determined by fluorometry, ranged from 3.69–5.36 ng/µL, while the concentration of leaf DNA extract ranged from 6.42–9.29 ng/µL. The A260/A280 and A260/A230 absorbance ratios of flower and leaf DNA extracts were measured by spectrophotometry. However, due to the overlap between DNA and phytochemical UV absorption spectrum, these ratios could not be reliability measured (data not shown).
Intercalating fluorescent dye was used to monitor the amplification of target fragments in real-time. Since both the specific primers M. chamomilla and C. nobile target the internal transcribed spacer 2 (ITS2) region, which has tens to hundreds of copies in the plant genome, 25 PCR amplification cycles are sufficient to generate enough amplicons for the identification of chamomile species. In Figure 7, the Ct value for M. chamomilla positive control in M. chamomilla identification test was less than 25 (GCP_GCT), while after 25 amplification cycles, the fluorescence of the same control in C. nobile identification test was below the detection threshold (GCP_RCT). On the other hand, after 25 cycles, the fluorescence for C. nobile positive control in M. chamomilla identification test was below the detection threshold (RCP_GCT), while the Ct value for the same control in C. nobile identification test was less than 25 (RCP_RCT). The amplification of target and non-target positive controls in their respective assays demonstrate the specificity of the M. chamomilla identification assay. For sample DNA, field flower head and leaf DNA extract yielded Ct values of 15.18 and 19.41 in M. chamomilla identification test, respectively (Sample1(FLOWER)_GCT and Sample2(LEAF)_GCT). Both of these samples were not amplified in C. nobile identification test (Sample1(FLOWER)_RCT and Sample2(LEAF)_RCT). The amplification patterns of both the samples matched the amplification pattern of M. chamomilla positive control. Negative controls were not amplified in both M. chamomilla and C. nobile identification tests (NC_GCT and NC_RCT), excluding the possibility of false positives caused by PCR contamination. To further confirm specific amplification in positive controls and samples, fractions of PCR end product from each well were run on 2% agarose gel in the laboratory (Figure 8). For M. chamomilla identification test, both field samples yielded amplicons running at the same position as the M. chamomilla positive control with an estimated size slightly above 100 bp (theoretical size 102 bp). For C. nobile identification test, non-target species C. nobile positive control yielded a band between 50 and 100 bp, fitting the theoretical size of 65 bp. The rest of the lanes showed no specific amplification product, which was in agreement with the absence of fluorescent signal for these wells, as observed in field testing.
Following PCR amplification, a melting curve analysis was performed to assess the dissociation characteristics of double-stranded DNA (dsDNA) during heating. As the temperature ramped up during the final cycle for melt curve analysis, increases in temperature caused the double-strand amplicons to dissociate. The intercalating fluorescent dye was gradually released into the solution, decreasing fluorescence intensity (Figure 9A). The inflection point of the first derivative curve was used to determine the melting temperature (Tm) (Figure 9B), which depends mainly on DNA fragment length and GC content. Combining Ct value with melting temperature can increase the specificity of qPCR analysis. In the current study, the melting temperature peak of M. chamomilla positive control PCR amplicon occurred at 85.6 °C (GCP_GCT) and it was distinct from the melting temperature peak of C. nobile positive control PCR amplicon at 79.1 °C (RCP_RCT). The PCR amplicon from field flower head and leaf produced melting temperature peaks at 85.2 °C and 84.8 °C, respectively (Sample1(FLOWER)_GCT and Sample2(LEAF)_GCT). To assess melting temperature variations measured by the portable qPCR system, additional datapoints were collected to confirm that sample melting temperatures were always close to the melting temperature obtained from M. chamomilla positive control (within 2 °C) and were far away from the melting temperature of C. nobile positive control amplicon (Figure 10). Melting temperature peaks were sometimes reported in other wells. However, their Ct values were not less than 25 and melting temperature peaks were not close to M. chamomilla or C. nobile positive control (more than 2 °C apart).
In summary, field M. chamomilla identification test can be interpreted based on decision rules summarized in Table 5. With all the positive controls testing positive for the putative botanical species, negative for the other species, and negative controls testing negative, both field samples were determined to contain M. chamomilla but not C. nobile. In addition, to align field testing results with other analytical techniques, field conclusions were further confirmed by a previously validated DNA barcoding method25 (data not shown).
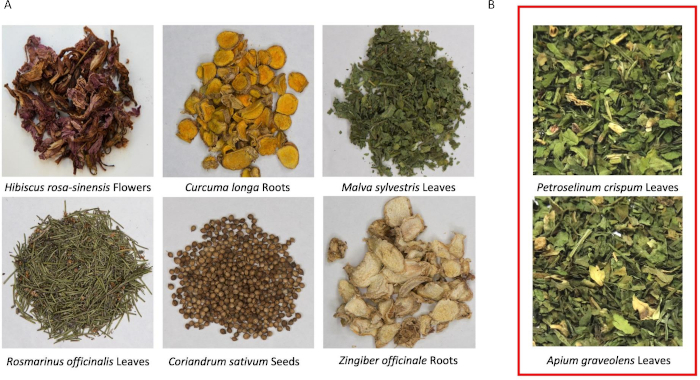
Figure 1: Morphological identification of botanical materials. (A) Hibiscus rosa-sinensis flowers, Curcuma longa roots, Malva Sylvestris leaves, Rosmarinus officinalis leaves, Coriandrum sativum seeds, Zingiber officinale roots. (B) Petroselinum crispum and Apium graveolens flakes are difficult to differentiate. Please click here to view a larger version of this figure.
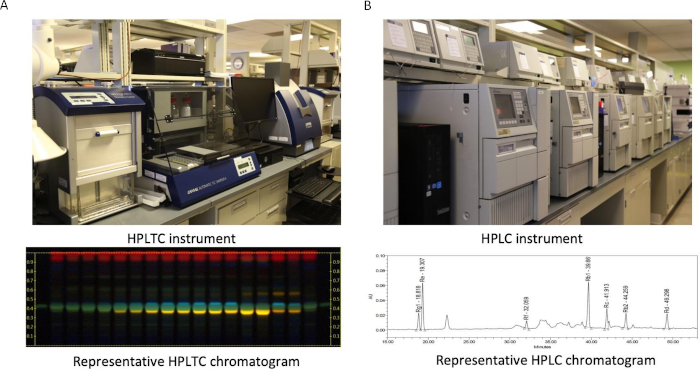
Figure 2: Chemical identification of botanical materials. (A) HPTLC instrument and a representative HPTLC chromatogram. (B) HPLC instrument and a representative HPLC chromatogram. Please click here to view a larger version of this figure.
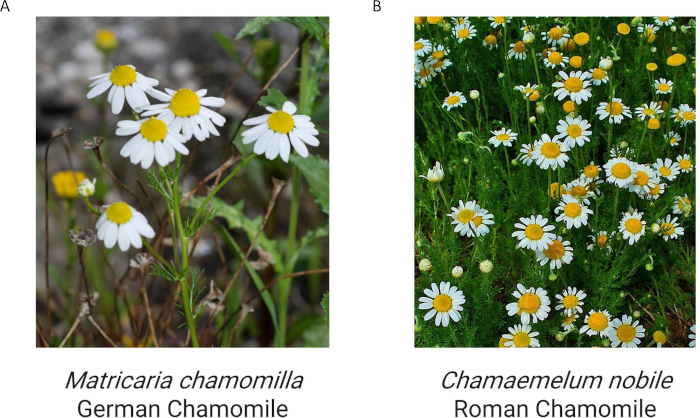
Figure 3: Matricaria chamomilla and Chamaemelum nobile in the field. (A) Matricaria chamomilla, adapted from Wikipedia under CC BY-SA 3.0, https://en.wikipedia.org/wiki/Matricaria_chamomilla#/media/File:Matricaria_February_2008-1.jpg. (B) Chamaemelum nobile, adapted from Wikipedia under CC BY-SA 3.0, https://en.wikipedia.org/wiki/Chamomile#/media/File:Chamaemelum_nobile_001.JPG. Please click here to view a larger version of this figure.
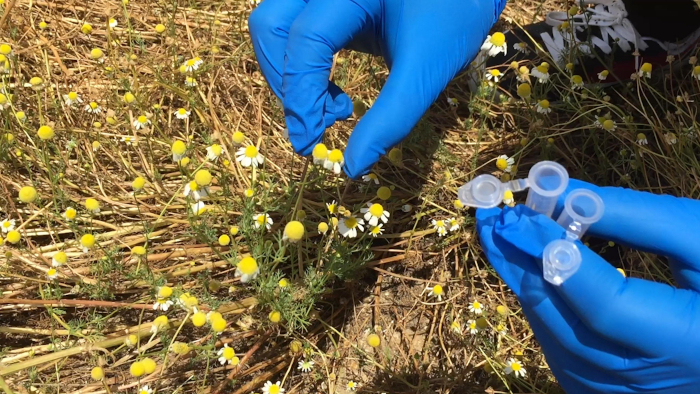
Figure 4: Collecting M. chamomilla plant parts from the field. Please click here to view a larger version of this figure.
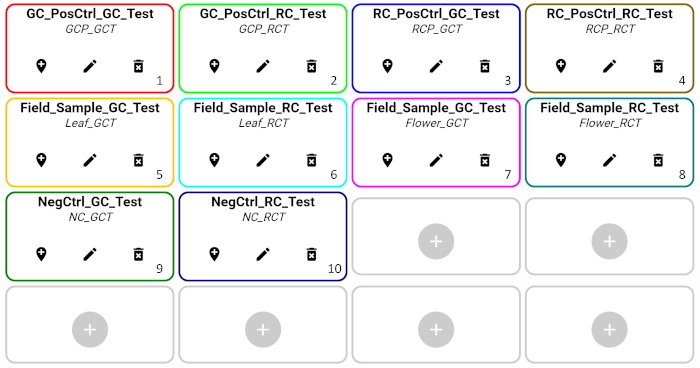
Figure 5: Layout of testing wells in the demonstration. Please click here to view a larger version of this figure.
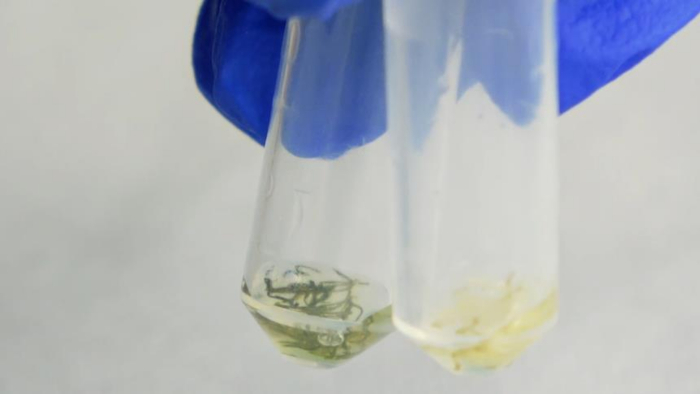
Figure 6: Field DNA extract in collection tubes. Botanical tissue remains in the original tube and is covered by yellowish DNA extract. Please click here to view a larger version of this figure.
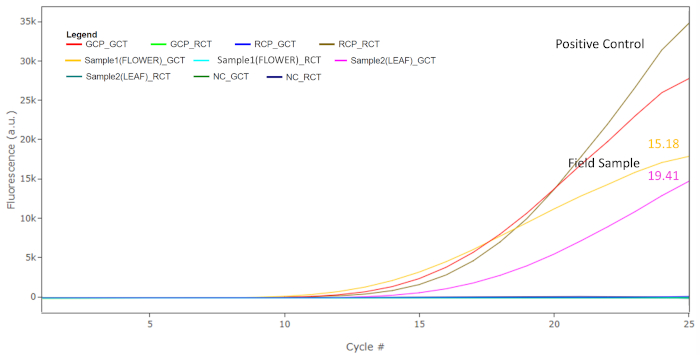
Figure 7: Fluorescence plot showing the accumulation of PCR products over 25 cycles of thermocycling. M. chamomilla positive control and C. nobile positive control show Ct values less than 25 in M. chamomilla and C. nobile identification tests, respectively. The field flower and leaf samples were amplified by M. chamomilla identification test with Ct values of 15.18 and 19.41. The rest of the wells were not amplified. Please click here to view a larger version of this figure.
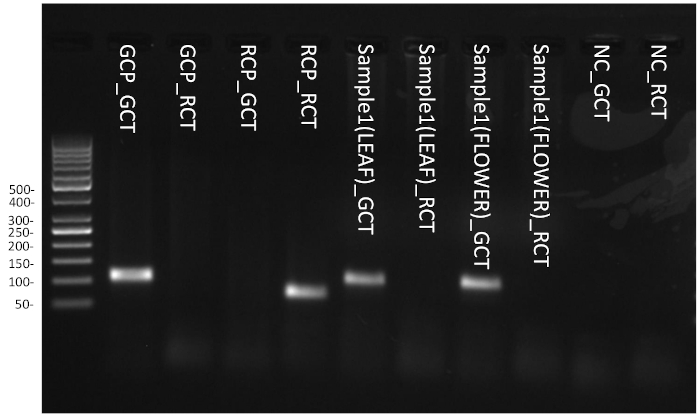
Figure 8: Gel electrophoresis of field PCR amplification products. Please click here to view a larger version of this figure.
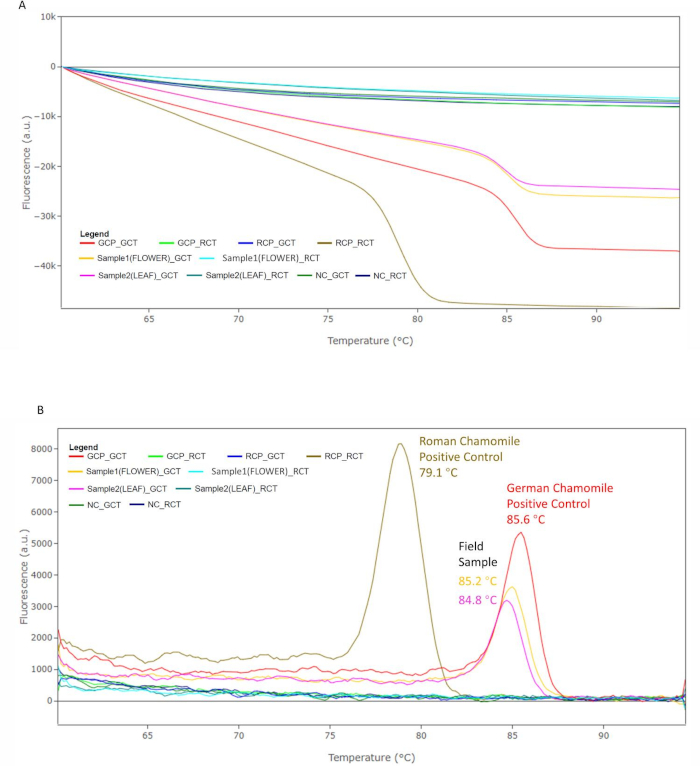
Figure 9: Melting temperature analysis. (A) The fluorescence signal in each well decreases with the increasing temperature. (B) The identity of the PCR products was confirmed by the melting temperature peak in melting curve analysis. The field flower and leaf samples show peaks at 85.2 °C and 84.8 °C. These are close to the peak produced by M. chamomilla positive control. The C. nobile positive control produced a peak at 79.1 °C, which is different from the other three samples. Please click here to view a larger version of this figure.
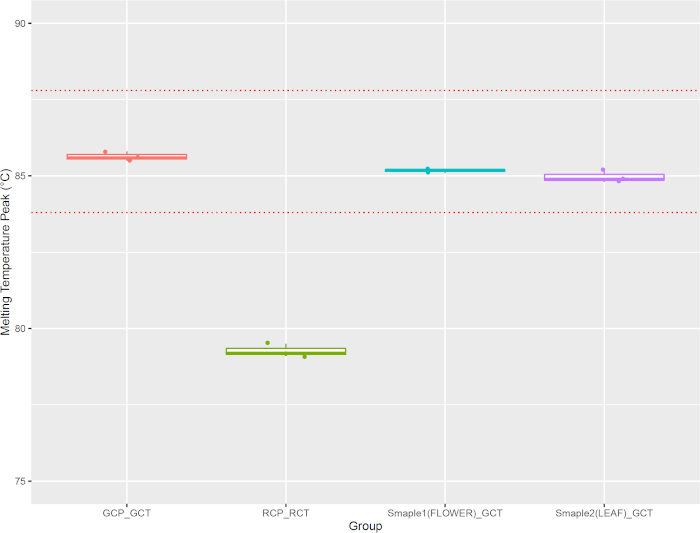
Figure 10: Melting temperature peak variation between positive control and field samples. Please click here to view a larger version of this figure.
| Stage | Cycle | Temperature | Time |
| Constant Temperature | 1 | 95 °C | 60s |
| Amplification | 25 | 95 °C | 30s |
| 60 °C | 30s | ||
| Melting Curve | 1 | 60 °C | Ramp 0.05 °C/s |
| 95 °C |
Table 1: qPCR thermocycling conditions for M. chamomilla and C. nobile identification tests.
| Assay | Primer name | Sequence 5'-3' | Position | Region | Amplicon Size | |
| Matricaria recutita | ZL3 | TCGTCGGTCGCAAGGATAAG | Forward | ITS2 | 102 bp | |
| ZL4 | TAAACTCAGCGGGTAGTCCC | Reverse | ||||
| Chamaemelum nobile | ZL11 | TGTCGCACGTTGCTAGGAAGCA | Forward | ITS2 | 65 bp | |
| ZL12 | TCGAAGCGTCATCCTAAGACAAC | Reverse | ||||
Table 2: Primer pairs for M. chamomilla and C. nobile identification tests.
| Well position | Well name | Description | |
| 1 | GC_PosCtrl_GC_Test | German chamomile positive control under GC Test | |
| 2 | GC_PosCtrl_RC_Test | German chamomile positive control under RC Test | |
| 3 | RC_PosCtrl_GC_Test | Roman chamomile positive control under GC Test | |
| 4 | RC_PosCtrl_RC_Test | Roman chamomile positive control under RC Test | |
| 5 | Field_Sample_GC_Test | Sample of leaf tissue under GC Test | |
| 6 | Field_Sample_RC_Test | Sample of leaf tissue under RC Test | |
| 7 | Field_Sample_GC_Test | Sample of flower tissue under GC Test | |
| 8 | Field_Sample_RC_Test | Sample of flower tissue under RC Test | |
| 9 | NegCtrl_GC_Test | Negative control sample under GC Test | |
| 10 | NegCtrl_RC_Test | Negative control sample under RC Test | |
Table 3: Well types and descriptions for M. chamomilla and C. nobile identification tests.
| Reagent | GC_Test | RC_Test |
| Universal qPCR Mix* | 10 µL | 10 µL |
| ZL3 primer (10 µM) | 0.4 µL | NA |
| ZL4 primer (10 µM) | 0.4 µL | NA |
| ZL11 primer (10 µM) | NA | 0.4 µL |
| ZL12 primer (10 µM) | NA | 0.4 µL |
| H2O (Nuclease-free) | 7.2 µL | 7.2 µL |
| * contains Hot Start Taq DNA Polymerase | ||
Table 4: Master-mix composition for M. chamomilla and C. nobile identification tests.
| Well Name | Expected Result | Positive Result Criteria | Negative Result Criteria |
| Detected / Present | Not Detected / Absent | ||
| GC_PosCtrl_GC_Test | Detected | Ct < 25 and 84 <= Tm <= 86 | - |
| GC_PosCtrl_RC_Test | Not Detected | - | No Ct value within 25 cycles |
| RC_PosCtrl_GC_Test | Not Detected | - | No Ct value within 25 cycles |
| RC_PosCtrl_RC_Test | Detected | Ct < 25 and 79 <= Tm <= 81 | - |
| Field_Sample_Leaf_GC_Test | Present | Ct < 25 and 84 <= Tm <= 86 | No Ct value within 25 cycles |
| Field_Sample_Leaf_RC_Test | Absent | - | No Ct value within 25 cycles |
| Field_Sample_Flower_GC_Test | Present | Ct < 25 and 84 <= Tm <= 86 | No Ct value within 25 cycles |
| Field_Sample_Flower_RC_Test | Absent | - | No Ct value within 25 cycles |
| NegCtrl_GC_Test | Not Detected | - | No Ct value within 25 cycles |
| NegCtrl_RC_Test | Not Detected | - | No Ct value within 25 cycles |
Table 5: Rules for qPCR result interpretation.
Discussion
The design of primers and template selection are the crucial steps in obtaining an efficient and specific qPCR amplification. After identifying a suitable template, primer design software is typically used to aid selection of primers based on design variables such as primer length, melting temperature, and GC content33,34. Optimization and validation can be performed under the expected experimental conditions of the assay to ensure specificity, sensitivity, and robustness of a PCR reaction35. Sub-optimal primer design may result in primer-dimer formation, wherein primer interactions produce non-specific products36.
The no template controls (NTC) used in this study check for both DNA contamination and the presence of primer-dimers that could affect the assay. Results showed no amplification, a good indication that both DNA contamination and primer-dimers are not a concern. DNA contamination and primer-dimers are manifested in melt curves through no template controls, and as extra peaks in melt curves of positive controls. Typically, the melt curve of a positive control is expected to contain a single peak, unless AT-rich subdomains in the template cause uneven melting. Double peaks could be predicted by simulating melting assays using the uMELT software37. In this study, the gold standard of running the PCR product on agarose gel was used to confirm the presence of target PCR product and absence of contamination and primer-dimers.
A considerable challenge in botanical material molecular analysis is obtaining good-quality DNA following the botanical DNA extraction process. Botanical materials are traded and consumed for the active chemical compounds that are associated with health benefits. In the process of DNA extraction, these chemical compounds will also be released into the DNA extraction solution, potentially causing PCR inhibition, thereby resulting in failures in PCR amplification. Various plant DNA purification kits using organic solvents and columns have been developed to remove chemical compounds derived from botanicals38. However, fume hood and high-speed centrifuge required to assist these kits are not available in the field.
In the current protocol, the simplified DNA extraction method uses a commercial plant DNA extraction kit (see Table of Materials for details). It had the ability to neutralize common inhibitory substances for reproducible results and produced consistent results for M. chamomilla and C. nobile. Both M. chamomilla and C. nobile flower heads and leaves yielded PCR amplicons with specific melt peaks, indicating that the presence of PCR inhibitors was not a concern. For other plants with higher levels of PCR inhibitors, amplifying DNA in their original extraction may be less efficient. To reduce inhibition and improve amplification efficiency, with access to the whole plant, other plant parts with lower polysaccharide and polyphenol content can also be used for identification purposes. If there is limited access to different plant parts, younger leaves or petals dissected from flower heads, which typically have lower phenolic content39, may offer a better chance of success. Since DNA sequences are consistent across the whole plant, any plant part may be used to confirm species identity. If PCR amplification is still suboptimal, the original DNA extract can be further diluted before PCR, or more sophisticated laboratory purification protocols can be used.
Another challenge for PCR analysis is false positive results caused by DNA contamination, which can negatively impact data interpretation. It is usually controlled by active housekeeping, using dedicated equipment, and restricting work to designated areas. Using qPCR, all PCR analysis can be accomplished in a closed system, which greatly reduces the chance of PCR amplicon contamination in an environment that is not well controlled. Besides, environmental DNA should also not show a false positive due to the specificity of the assay, according to a previous validation study40.
There is room for improvement. In the protocol presented here, intercalating dye was used to show target fragment amplification in real-time. The specificity of the method is further confirmed by the characteristic melting temperature, which is distinct between M. chamomilla and C. nobile amplicons. Therefore, intercalating dye-based PCR can efficiently answer the question “What is this plant species?” in the field. However, in addition to the need of performing botanical identification on a single plant isolated from the field, in many circumstances, botanical powders or extracts in the warehouse will also benefit from an on-site rapid identity assessment. For these types of materials, additional questions may need to be addressed, such as “What is in this material?”, “Does it contain the botanical species I am looking for?”, “Does it contain adulterants I want to avoid?”, and “Is it substituted wholly or partially by other botanical species that are harmful?”. Instead of using intercalating dye, different qPCR probes can be designed to target amplicons from different botanicals in one reaction system, while maintain high specificity and efficiency of the assay. Development of probe-based qPCR and utilization of a portable qPCR system that offers multiple channel detection can further extend the application of field testing as a fit-for-purpose assay to a broader environment setting, such as botanical material warehouses and distribution centers to answer more complicated questions. In addition, using multiple probes also allows the user to include internal amplification in each reaction system, so that more information will be available when PCR inhibition is suspected.
The protocol presented here has the following advantages compared to existing technologies used for the same purpose. First, for traditional morphological and chemical identification methods, the procedure and its results need to be conducted and interpreted by experts. qPCR-based identification tests can be conducted by people with basic molecular biology training and interpreted in a more standardized manner. Second, compared to qPCR-based species identification and differentiation normally performed in the laboratory, the field identification protocol using a portable instrument does not require instruments with a large footprint, such as a high-speed centrifuge, DNA quality evaluation equipment, thermal cycler with fluorescence detector, and a computer running a special software. Thus, DNA-based species identification can be performed in any setting without delay. Third, searching for botanical materials is a task that requires a global operation. With advancements in cloud services and artificial intelligence, a portable device can potentially receive methods developed and validated by experts in the laboratory, be operated by non-experts in remote areas, and produce objective certifications from third parties. Therefore, this option is more compelling than ever with remote work becoming the trend.
In summary, the protocol here demonstrated field identification of M. chamomilla using a portable qPCR system. The successful application of this technique will generate highly accurate results on botanical identification and help botanical manufacturers and suppliers qualify botanical materials in a timely and cost-efficient manner.
Disclosures
We certify that Zhengxiu Yang, Zheng Quan, Tiffany Chua, Leo Li, Yanjun Zhang, Silva Babajanian, Tricia Chua, Peter Chang, Gary Swanson, Zhengfei Lu are employees of Herbalife International of America, Inc. We certify that Francesco Buongiorno, Isabella Della Noce, and Lorenzo Colombo are employees of Hyris Ltd. that produces the portable qPCR instrument used in this article.
Acknowledgements
We thank James Shan for his efforts in field video recording. We thank Jon Byron and Matthew Semerau for their work in video editing. We thank Ansen Luo, Harry Du, and Frank Deng for their support in locating the test field. We thank Maria Rubinsky for her valuable comments on the whole manuscript. All the acknowledged persons are employees of Herbalife International of America, Inc.
Materials
| Name | Company | Catalog Number | Comments |
|---|---|---|---|
| Battery | TNE | 78000mAh | Provide field power supply |
| bCUBE | HYRIS | bCUBE 2.0 | Portable qPCR instrument |
| Cartridges(16 Well) | HYRIS | NA | Consumables for bCUBE |
| Electric pipette | Eppendorf | NA | Handling liquid |
| Extract-N-AmpTM plant PCR kit | SIGMA | XNAP2-1KT | Plant DNA extraction kit |
| German chamomile (Matricaria chamomilla L) flower botanical reference materials | AHP | 2264 | Used as positive control |
| Mini dry bath | Yooning | MiniH-100L | For DNA extraction |
| Nuclease-free water | AMBION | AM9937 | qPCR reaction |
| Primer | Thermo Fisher Scientific | NA | qPCR reaction |
| Roman chamomile (Chamaemelum nobile) flower botancial reference materials | ChromaDex | ASB-00030806-005 | Used as positive control |
| Luna universal qPCR master mix | NEB | M3003L | qPCR reaction |
References
- Smith, T., Gillespie, M., Eckl, V., Knepper, J., Reynolds, C. Herbal supplement sales in US increase by 9.4% in 2018. HerbalGram. 123, 62-73 (2019).
- Israelsen, L. D. The challenge of regulation, globalization and climate change on botanicals and traditional medicines: respecting tradition while embracing change. Planta Medica. 74 (3), 36(2008).
- Cardellina, J. H. Challenges and opportunities confronting the botanical dietary supplement industry. Journal of Natural Products. 65 (7), 1073-1084 (2002).
- Foster, S. Exploring the peripatetic maze of black cohosh adulteration: a review of the nomenclature, distribution, chemistry, market status, analytical methods and safety. HerbalGram. 98, 32-51 (2013).
- Vanherweghem, J. L. Misuse of herbal remedies: The case of an outbreak of terminal renal failure in Belgium (Chinese herbs nephropathy). The Journal of Alternative and Complementary Medicine. 4 (1), 9-13 (1998).
- Vanherweghem, J. L., et al. Rapidly progressive interstitial renal fibrosis in young women: association with slimming regimen including Chinese herbs. The Lancet. 341 (8842), 387-391 (1993).
- Khan, I. A., Smillie, T. Implementing a "quality by design" approach to assure the safety and integrity of botanical dietary supplements. Journal of Natural Products. 75 (9), 1665-1673 (2012).
- Applequist, W. The Identification of Medicinal Plants: A Handbook of the Morphology of Botanicals in Commerce. , Missouri Botanical Garden Press. (2006).
- Upton, R., Graff, A., Jolliffe, G., Länger, R., Williamson, E. American Herbal Pharmacopoeia: Botanical Pharmacognosy - Microscopic Characterization of Botanical Medicines. , CRC Press. (2016).
- Frommenwiler, D. A., et al. Comprehensive HPTLC fingerprinting for quality control of an herbal drug - the case of angelica gigas root. Planta Medica. 84 (6-7), 465-474 (2018).
- Heyman, H. M., Meyer, J. J. M. NMR-based metabolomics as a quality control tool for herbal products. South African Journal of Botany. 82, 21-32 (2012).
- Lazarowych, N. J., Pekos, P. Use of fingerprinting and marker compounds for identification and standardization of botanical drugs: strategies for applying pharmaceutical HPLC analysis to herbal products. Drug Information Journal. 32 (2), 497-512 (1998).
- Tankeu, S., et al. Hyperspectral imaging and support vector machine: a powerful combination to differentiate black cohosh (actaea racemosa) from other cohosh species. Planta Medica. 84 (6-7), 407-419 (2018).
- Rodman, J. E., Cody, J. H. The taxonomic impediment overcome: NSF's Partnerships for Enhancing Expertise in Taxonomy (PEET) as a model. Systematic Biology. 52 (3), 428-435 (2003).
- Chen, S., et al. A renaissance in herbal medicine identification: from morphology to DNA. Biotechnology Advances. 32 (7), 1237-1244 (2014).
- Li, X., et al. Plant DNA barcoding: from gene to genome. Biological Reviews. 90 (1), 157-166 (2015).
- Madesis, P., Ganopoulos, I., Sakaridis, I., Argiriou, A., Tsaftaris, A. Advances of DNA-based methods for tracing the botanical origin of food products. Food Research International. 60, 163-172 (2014).
- Newmaster, S. G., Ragupathy, S., Janovec, J. A botanical renaissance: state-of-the-art DNA bar coding facilitates an automated identification technology system for plants. International Journal of Computer Applications in Technology. 35 (1), 50-60 (2009).
- Parveen, I., Gafner, S., Techen, N., Murch, S. J., Khan, I. A. DNA barcoding for the identification of botanicals in herbal medicine and dietary supplements: strengths and limitations. Planta Medica. 82 (14), 1225-1235 (2016).
- Agrawal, N., Hassan, Y. A., Ugaz, V. M. A pocket-sized convective PCR thermocycler. Angewandte Chemie International Edition. 46 (23), 4316-4319 (2007).
- Almassian, D. R., Cockrell, L. M., Nelson, W. M. Portable nucleic acid thermocyclers. Chemical Society Reviews. 42 (22), 8769-8798 (2013).
- Benítez-Páez, A., Portune, K. J., Sanz, Y. Species-level resolution of 16S rRNA gene amplicons sequenced through the MinION portable nanopore sequencer. Gigascience. 5 (1), 4(2016).
- Emanuel, P. A., et al. Detection of Francisella tularensis within infected mouse tissues by using a hand-held PCR thermocycler. Journal of Clinical Microbiology. 41 (2), 689-693 (2003).
- Quick, J., et al. Real-time, portable genome sequencing for Ebola surveillance. Nature. 530 (7589), 228(2016).
- Lu, Z., et al. Single-laboratory validation of a two-tiered DNA barcoding method for raw botanical identification. Journal of AOAC International. 102 (5), 1435-1447 (2019).
- Sgamma, T., et al. DNA barcoding for industrial quality assurance. Planta Medica. 83 (14-15), 1117-1129 (2017).
- Wallinger, C., et al. Rapid plant identification using species-and group-specific primers targeting chloroplast DNA. PLoS One. 7 (1), 29473(2012).
- Newmaster, S. G., et al. Recommendations for validation of real-time PCR methods for molecular diagnostic identification of botanicals. Journal of AOAC International. , (2019).
- Singh, O., Khanam, Z., Misra, N., Srivastava, M. K. Chamomile (Matricaria chamomilla L.): an overview. Pharmacognosy Reviews. 5 (9), 82(2011).
- Mills, S. Y., Bone, K. The Essential Guide to Herbal Safety. Elsevier Health Sciences. , 325(2004).
- Avula, B., et al. Quantitative determination of phenolic compounds by UHPLC-UV-MS and use of partial least-square discriminant analysis to differentiate chemo-types of Chamomile/Chrysanthemum flower heads. Journal of Pharmaceutical and Biomedical Analysis. 88, 278-288 (2014).
- Guzelmeric, E., Vovk, I., Yesilada, E. Development and validation of an HPTLC method for apigenin 7-O-glucoside in chamomile flowers and its application for fingerprint discrimination of chamomile-like materials. Journal of Pharmaceutical and Biomedical Analysis. 107, 108-118 (2015).
- Dieffenbach, C. W., Lowe, T. M., Dveksler, G. S. General concepts for PCR primer design. Genome Research. 3 (3), 30-37 (1993).
- Untergasser, A., et al. Primer3Plus, an enhanced web interface to Primer3. Nucleic Acids Research. 35, Web Server issue 71-74 (2007).
- Bustin, S., Huggett, J. qPCR primer design revisited. Biomolecular Detection and Quantification. 14, 19-28 (2017).
- Brownie, J., et al. The elimination of primer-dimer accumulation in PCR. Nucleic Acids Research. 25 (16), 3235-3241 (1997).
- Dwight, Z., Palais, R., Wittwer, C. T. uMELT: prediction of high-resolution melting curves and dynamic melting profiles of PCR products in a rich web application. Bioinformatics. 27 (7), Oxford, England. 1019-1020 (2011).
- Heikrujam, J., Kishor, R., Mazumder, P. B. The chemistry behind plant DNA isolation protocols. Biochemical Analysis Tools - Methods for Bio-Molecules Studies. , (2020).
- Blum-Silva, C. H., Chaves, V. C., Schenkel, E. P., Coelho, G. C., Reginatto, F. H. The influence of leaf age on methylxanthines, total phenolic content, and free radical scavenging capacity of Ilex paraguariensis aqueous extracts. Revista Brasileira de Farmacognosia. 25 (1), 1-6 (2015).
- Lu, Z., et al. Validation of a targeted PCR method for raw and processed botanical material identification: an example using matricaria chamomilla (chamomile). Journal of AOAC International. 102 (6), 1787-1797 (2019).
Reprints and Permissions
