As currently implemented, optogenetics in non-human primates requires injection of viral vectors into the brain. An optimal injection method should be reliable and, for many applications, capable of targeting individual sites of arbitrary depth that are readily and unambiguously identified in postmortem histology. An injection method with these properties is presented.
Method Article
Injections of AAV Vectors for Optogenetics in Anesthetized and Awake Behaving Non-Human Primate Brain
In This Article
Summary
Abstract
Optogenetic techniques have revolutionized neuroscience research and are poised to do the same for neurological gene therapy. The clinical use of optogenetics, however, requires that safety and efficacy be demonstrated in animal models, ideally in non-human primates (NHPs), because of their neurological similarity to humans. The number of candidate vectors that are potentially useful for neuroscience and medicine is vast, and no high-throughput means to test these vectors yet exists. Thus, there is a need for techniques to make multiple spatially and volumetrically accurate injections of viral vectors into NHP brain that can be identified unambiguously through postmortem histology. Described herein is such a method. Injection cannulas are constructed from coupled polytetrafluoroethylene and stainless-steel tubes. These cannulas are autoclavable, disposable, and have low minimal-loading volumes, making them ideal for the injection of expensive, highly concentrated viral vector solutions. An inert, red-dyed mineral oil fills the dead space and forms a visible meniscus with the vector solution, allowing instantaneous and accurate measurement of injection rates and volumes. The oil is loaded into the rear of the cannula, reducing the risk of co-injection with the vector. Cannulas can be loaded in 10 min, and injections can be made in 20 min. This procedure is well suited for injections into awake or anesthetized animals. When used to deliver high-quality viral vectors, this procedure can produce robust expression of optogenetic proteins, allowing optical control of neural activity and behavior in NHPs.
Introduction
Optogenetics in non-human primates (NHPs) typically involves the injection of viral vector directly into the brain. One class of vectors that is well suited for this application is based on adeno-associated virus (AAV). These vectors consist of a protein capsid surrounding a single-stranded DNA genome that, in turn, consists of a promoter, an opsin gene, and optionally, other protein-coding and gene-regulatory elements. Advances in molecular cloning have facilitated the manipulation and combination of these components for the development of new vectors. Consequently, the collection of AAV vectors that is potentially useful for NHP optogenetics is large and growing rapidly.
At present, the utility of an AAV vector for NHP optogenetics requires testing in vivo. This fact is a substantial barrier to progress. Animals must be used sparingly, and testing multiple vectors in a single animal requires that injection sites be positioned judiciously relative to neural architecture and well separated relative to viral spread. Accurate histological assessment requires injections to be spatially and volumetrically accurate. An injection technique previously used for focal delivery of pharmacological agents1,2,3,4 was adapted and simplified to make such injections. This injection technique is inexpensive, uses disposable, sterilizable components, can be used in anesthetized or awake behaving monkeys, and can be used to target diverse brain areas of any depth. The following protocol describes step-by-step procedures for fabricating the disposable components and making injections in the NHP brain. The advantages and disadvantages of the technique are discussed.
Protocol
All experiments were performed in accordance with the Guide for the Care and Use of Laboratory Animals and exceeded the minimal requirements recommended by the Institute of Laboratory Animal Resources and the Association for Assessment and Accreditation of Laboratory Animal Care International. All procedures were evaluated and approved by the Animal Care and Use Committee of the University of Washington (UW IACUC protocol #4167-01). Five healthy macaques (2 Macaca mulatta, 3 Macaca nemestrina; male. 4-11 years old) participated in this study. Sterile instruments and technique were used throughout all surgical procedures.
1. Making a cannula (Figure 1A)
- Preparation of each part
- Blunt the tip of a hypodermic needle (30 G, 13 mm length) with a disk grinder.
- Cut a stainless-steel tube (30 G, inside diameter = 0.16 mm, outside diameter = 0.31 mm) to a length tailored to the depth of the target brain area (25 mm is well suited to inject the dorsal surface of the cerebral cortex). With a disk grinder, bevel one end of the cut tube and smooth the other. Deburr the inside of the tube with a broach.
- Cut the polytetrafluoroethylene (PFTE) tubing (inside diameter = 0.23 mm ± 0.02 mm, wall = 0.23 mm ± 0.02 mm, 1 mm corresponds to 42 nL ± 7 nL of fluid) to a length appropriate for the amount of vector solution to be loaded (1 µL of vector solution occupies 24 mm of tubing). Flare both ends of the PTFE tube by insertion of the blunted hypodermic needle.
- Insert the blunted hypodermic needle approximately 5 mm into one end of the PTFE tube. Insert the unbeveled end of the stainless-steel tube approximately 5 mm into the other end (Figure 1A).
- Perform pre-injection testing. Inject filtered water through the hypodermic needle hub of the cannula. Confirm that water exits the beveled stainless-steel tube from the tip and that water does not leak from either junction.
2. Injection procedure for anesthetized animals
- Surgery preparation
- Sterilize surgical instruments and supplies using the procedures in the Table of Materials.
- If needed, take a head MRI for targeting deep brain structures (Figure 2A).
- Immediately before the surgery, sedate the animals with ketamine (10-15 mg/kg) and administer antibiotics (cefazolin) and analgesics (sustained-release buprenorphine and meloxicam) intramuscularly. Then, deliver propofol via intravenous (IV) catheter in the saphenous or cephalic veins.
- Intubate the animal and transition it to isoflurane gas. Confirm proper anesthetization by stable heart rate, blood pressure, respiratory rate, relaxed skeletal muscles, and the absence of palpebral or withdrawal reflexes.
- Shave the animal's head. Apply artificial tear ointment to the corneas to prevent drying.
- Injection area preparation
- Place the animal's head in the stereotaxic frame. Apply surgical scrub solution to the shaved skin with gauze sponges, apply gentle pressure to release any debris, and rinse with isopropyl alcohol. Repeat this process three times. Cover the animal with a sterile fenestrated drape. Incise the skin and reflect the muscle. Place the manipulator on the stereotaxic arm, position it to aim at the target brain area, and mark the craniotomy position on the skull with a sterilized pen.
- Remove the stereotaxic manipulator and perform the craniotomy. Incise the dura if desired (e.g., to visualize sulcal landmarks). Return the manipulator to the stereotaxic arm.
- Vector solution loading (Figure 1C)
- Gently transfer the vector solution to a sterilized PCR tube with a P20 pipettor, avoiding bubbles.
- Attach a cannula, with the beveled tip facing down, to a vertically oriented stereotaxic holder. Connect a 1 mL Luer-lock syringe to the hypodermic needle hub of the cannula.
- Submerge the beveled tip of the cannula into the vector solution.
NOTE: The syringe should be attached already; attaching it at this point would introduce bubbles into the vector solution. - Load the solution into the cannula by applying gentle negative pressure with the 1 ml syringe. Visually track the meniscus between the solution and air.
- Once the vector solution has been loaded, continue the gentle negative pressure until the solution reaches the needle hub. Remove the 1 mL syringe and inject the colored mineral oil into the hypodermic needle hub.
NOTE: The oil should be injected slowly along the inside wall of the needle hub to form a clear-cut meniscus with the vector solution and to avoid air bubbles. - Attach the hypodermic needle hub to one of the two open ports of a 3-way Luer-lock stopcock.
NOTE: Attaching the hypodermic needle to the closed port will introduce unwanted air pressure behind the oil. - Close the port connected to the hypodermic needle hub, fill a 1 mL syringe with air, and attach it to either of the other two ports. Finally, close the remaining port of the stopcock to connect the syringe to the cannula.
- Slowly push air into the cannula. Once the colored oil appears at the tip of the blunt needle in the PTFE tubing, check for air between the solution and the colored oil.
- If air is present, apply negative pressure to the syringe to return the colored oil into the needle hub. Remove the bubble and apply positive pressure until a drop of vector solution is visible at the beveled cannula tip.
- Remove the 1 mL syringe to release unwanted air pressure behind the oil and close the stopcock to prevent the vector from exiting the cannula by gravity.
- Tape a plastic ruler to the PTFE tubing to measure the movement of the meniscus during injection (Figure 1B,D,F).
- Cannula insertion into the target brain area (Figure 1B)
- Affix the cannula to the stereotaxic manipulator.
- Manually transfer the pump tubing (which terminates in a Luer-lock connector) from the non-sterile assistant to the surgeon. The surgeon should grasp the Luer-lock connector through the wall of a sterile sleeve, affix a second sterile stopcock to the connector, tape the sleeve tightly around it, and then drop the collar of the sleeve, allowing it to extend along the tube by gravity.
- Connect the stopcock attached to the cannula tubing to the stopcock attached to the air pump. Set the air pump to low pressure, turn it on, and increase the pressure until the oil advances through the cannula and a drop of vector solution is visible at the cannula tip.
- Adjust the plastic ruler position on the PTFE tubing to measure the movement of the meniscus during injection.
- Drive the cannula down with the stereotaxic manipulator and record the depth at which the tip reaches at the surface (dura or pia mater).
- Drive the cannula to the deepest site to be injected along the track. The surface will dimple. If injecting surface cortex, confirm visually that the cannula has penetrated the surface, with a surgical microscope or magnifying loupes if available.
- To minimize mistargeting due to tissue compression, drive the cannula in slowly (1 mm/min), quickly (0.5 mm/s) with a 1-5 min wait at the bottom, or overshoot the deepest injection site by 500 µm and then retract.
- Injection
- Inject 0.5 µL of the vector solution with the electric air pump over 10-30 s. Confirm injection flow by tracking the meniscus between the colored oil and the vector solution in the PTFE tube.
- Wait for 1 min and retract the cannula to the next injection site along the track.
- After the final injection, leave the cannula in place for 10 min to avoid vector efflux.
- Retract the cannula and discard it in a biohazard sharps container.
- Optionally, inject a small quantity (≤1 µL) of fluorescent microbeads near the vector injection site to facilitate identification of the injection site post mortem.
- Repeat this procedure as desired for the other vector solutions at other locations (Figure 2B).
- Surgery closing
- Suture the dura, the muscle, and the skin.
- Remove the monkey from the stereotaxic frame and remove all monitor cables.
- Remove the monkey from isoflurane anesthesia and extubate following the return of the swallowing reflex.
- Provide post-surgical treatment (3-5 days of meloxicam and 7-10 days of cephalexin). Monitor the animal at least once every 10 min until it is capable of maintaining a stable upright sitting position.
3. Surgery and AAV vector injection for awake behaving animals (Figure 1D)
NOTE: A variant of the technique can be used to make injections into the brains of awake, behaving monkeys, as described below.
- Simultaneous injection with recording
- To record electrical activity at the injection site, coat the outside of the cannula with epoxy (bottom ~15 mm) and polyimide tubing (remaining length). Reveal the metal at the tip by scraping the epoxy from it (Injectrode, Figure 1F)2. Alternatively, insert the cannula and a separate extracellular electrode, side-by-side, into a double-barrel guide tube (Double-barrel guide tube, Figure 1E).
- Cannula insertion into the target brain area.
- Place the monkey in the experimental booth, restrict movement of the head, and clean the cranium-mounted recording chamber using standard techniques.
- Secure a guide tube to the microdrive. Insert the injection cannula into the guide tube.
- Advance the cannula until the tip protrudes from the guide tube.
- Connect the stopcock to the electric air pump. To confirm proper system function, push a drop of vector solution from the tip using the air pump and confirm movement of the oil-vector solution meniscus.
- Withdraw the cannula ~5 mm into the guide tube to protect it from damage during the tube insertion into the brain. Insert the guide tube into the brain.
- Drive the cannula to the site to be injected using the microdrive. Identify the target site by either electrical recording (Figure 2C) or stimulation.

Figure 1: Setup of surgery and apparatus. (A) Injection cannula. Each part of the cannula is indicated. Inset at bottom-right: magnified picture of cannula tip, scale bar: 500 µm. (B) Surgery setup for anesthetized monkeys. The monkey is placed in a stereotaxic frame under a surgical drape. Ventilator (V), intravenous line (IV), blood pressure monitor (BP), and oxygen saturation monitor (O2) are connected to the monkey. The injection cannula is inserted into the target area using a stereotaxic micromanipulator. The vector solution is injected by an electric air pump (bottom-left inset, brown) coupled to an air compressor (bottom-left inset, blue). A plastic ruler (top inset) is taped to the PTFE tubing to measure the movement of the meniscus between colored oil (top inset, red) and vector solution (top inset, clear) during injection. (C) Setup to load vector solution into the cannula. (D) A monkey during an injection of vector solution in an experimental booth. The animal's head is held in place by three stabilization-posts, and eye position is recorded by a scleral search coil system. The injection cannula is held and driven to the target depth using a micro-electrode holder/driver. Injection is controlled by monitoring the meniscus between the colored oil and the vector solution through a USB camera (inset picture). (E) Double-barrel guide tube injection. A double-barrel guide tube holder/driver holds an injection cannula and a micro-electrode (see inset). (F) Injectrode. The metal at the tip of the cannula, exposed by scraping the epoxy coat, provides electrical access to neurons (inset, scale bar: 500 µm). (G) Laser stimulation setup. A double-barrel guide tube holder/driver holds both an optical fiber and a micro-electrode (see inset). Please click here to view a larger version of this figure.

Figure 2: Diagram of AAV injection sites. (A) Sagittal section of brain MR image showing injection sites in the primary motor cortex and primary visual cortex of a Macaca nemestrina. (B) View from the dorsal surface on the corresponding Atlas plate showing cannula placement relative to the central sulcus (primary motor cortex) and primary visual cortex. (C) Unit recording by injectrode in the superior colliculus. A unit that was isolated before injection (right top) disappeared after the injection (right bottom). (D) Injection track (white arrows). Scale bar: 500 µm. Please click here to view a larger version of this figure.
4. Brain tissue processing for histology
- Wait 6-8 weeks post-injection to maximize transgene expression.
NOTE: The optimal duration is dependent on the exact viral vector used in the experiment. - Process the brain using conventional histological techniques to assess transduction efficiency and selectivity5,6,7.
Results
To demonstrate transgene expression by in vivo stereotaxic injection into the NHP brain using the surgical injection method described here, two vectors were selected that contained enhancers driving expression of the super yellow fluorescent protein-2 (SYFP2) in distinct neuronal types8,9. Viral vectors were packaged in the PHP.eB capsid10, purified by iodixanol centrifugation, and then concentrated to high titer (>1E13 viral genomes/mL) as measured by qPCR. A volume of 0.5 µL was injected at each of ten depths along ten tracks through the cortex for a total injection volume of 5 µL/track. Figure 3A-C shows SYFP2 expression via anti-GFP immunostaining 113 days post-injection of the PVALB subclass-specific AAV vector, CN2045, into the primary visual cortex of an adult male Macaca nemestrina. The SYFP2 transgene is robustly detected in numerous non-pyramidal neurons scattered across the cortical depth, and most SYFP2 expressing neurons were also immunoreactive for PVALB7. Figure 3D shows native SYFP2 expression in the primary motor cortex 64 days post-injection of the L5 neuron subclass-specific AAV vector, CN2251. The SYFP2-labeled neurons all have clear pyramidal morphology with somata restricted to layer 5 and characteristic thick apical dendrites. These data unambiguously demonstrate precise control of transgene expression in select populations of neocortical neurons in the NHP brain by stereotaxic injection of cell-type targeting AAV vectors.

Figure 3: Example of cell type-specific SYFP2 expression mediated by AAV vectors injected into NHP brain. (A) Epifluorescence photomicrograph of a fixed section from macaque primary visual cortex 113 days post-injection of a PVALB subclass-specific AAV vector. Scale bar: 1 mm. (B,C) Higher magnification image of the boxed region showing in A. (B) Anti-GFP signal. (C) Anti-PVALB signal. Scale bars: 250 µm. (D) Epifluorescence photomicrograph of native SYFP2 fluorescence in a fixed section from macaque primary motor cortex 64 days post-injection of a layer 5 extratelencephalic subclass-specific AAV vector. Scale bar: 500 µm. Please click here to view a larger version of this figure.
To demonstrate the utility of this injection technique for neurophysiological and behavioral optogenetic manipulations, three experiments were performed, each on a different monkey (Macaca mulatta). In the first experiment (Figure 4A-D), AAV vectors carrying the channelrhodopsin-2 transgene (AAV1-hSyn1-ChR2-mCherry) were injected into the left superior colliculus (SC). The vector was injected every 250 µm at 19 depths for a total of 12 µL. In the second experiment (Figure 4E-G), 3 µL of AAV1-hSyn-ArchT-EYFP solution was injected into the nucleus reticularis tegmenti pontis (NRTP). In the third experiment (Figure 4H-K), 24 µL of AAV9-L7-ChR2-mCherry solution was injected into the cerebellar cortex6. Six to eight weeks after each injection, an optical fiber and a tungsten electrode were inserted into the brain via a double-barrel guide tube (Figure 1G).
Figure 4B shows the response of an SC neuron to blue light (450 nm). Continuous light (1.2 s) at 40 mW produced a series of consecutive action potentials (Figure 4B, top). Light pulses of 1-ms duration failed to evoke action potentials at 40 mW (Figure 4B, middle) but did evoke action potentials reliably at 160 mW, the only other power level tested, with a latency of 2.7 ± 0.6 ms (Figure 4B, bottom). A pulse train (160 mW, frequency: 300 Hz, duty cycle: 15%, duration: 300-ms) evoked saccades consistently with an average latency of 97 ± 32 ms, a mean amplitude of 10.4° and mean angle of 47° (upward and to the right; Figure 4C).
Consistent with studies that modified saccade gain using subthreshold electrical stimulation of the SC11,12, optical stimulation of the SC after 15°, 18°, and 20° left- and downward (225°) saccades gradually reduced saccade gain (Figure 4D). This decrease in gain required ~250 trials (green circles) to return to the pre-adaptation gain (black circles), confirming its basis in long-term plasticity.
In the second experiment (Figure 4E), the mossy fiber projection from the NRTP to the oculomotor vermis (OMV) of the cerebellar cortex (lobules VIc and VII) was optically suppressed. Figure 4F shows fluorescently labeled mossy fibers and rosettes in the OMV (inset). Yellow laser light (589 nm) was delivered to the OMV via optical fiber, and a nearby tungsten electrode was used to record Purkinje cell activity. Figure 4G shows simple spike activity before (gray) and after (orange) optogenetic inactivation of NRTP projections (Figure 4G, top). Before the inactivation, the Purkinje cell exhibited a double burst pattern for 12° rightward saccades (Figure 4G, middle, gray). During inactivation, the firing rate decreased and changed to a burst-pause pattern (Figure 4G, middle, orange). Comparing these two response patterns suggests that the mossy fiber input to Purkinje cells influences the saccade deceleration phase by driving the second burst (Figure 4G, middle, green). The variability of rightward saccades was reduced during optogenetic inactivation, consistent with the idea that some of the trial-to-trial variability in saccade metrics is due to variability in the signals carried by mossy fibers (Figure 4G, bottom, orange).
In the third experiment (Figure 4H), Purkinje cells of the OMV were stimulated optogenetically (Figure 4I). A train of short light pulses (1.5-ms pulses, 65 mW, 50 Hz) increased the simple spike activity of an isolated Purkinje cell (Figure 4J, top). Individual 1.5-ms light pulses frequently evoked >1 simple spike (Figure 4J, bottom). Optogenetic simple spike activation, timed to occur during a saccade (10-ms light pulse, 60 mW), increased saccade amplitude (Figure 4K), confirming the disinhibitory role of Purkinje cells on the oculomotor burst generator.
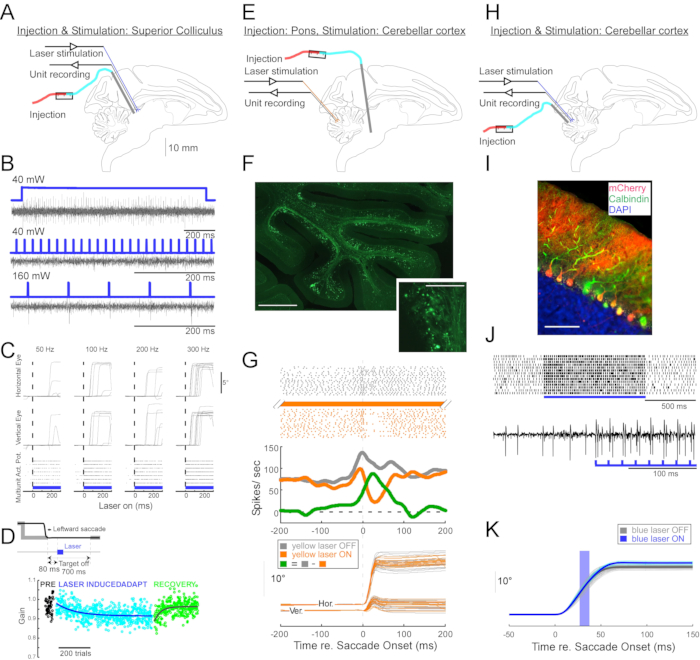
Figure 4: Summary of three optogenetic experiments performed in awake monkeys. (A-D) Experiment 1, pan-neuronal excitation: viral injection, laser stimulation, and unit recording were conducted in the superior colliculus (A). (B) Representative unit activity evoked by laser stimulation. (C), Horizontal (top) and vertical (middle) components of eye movements and raster plot of unit activity (bottom) evoked by laser stimulation. (D) A representative session of saccade adaptation induced by laser stimulation. Stimulation (100 0.5-ms laser pulses) was delivered 80-ms after each saccade (inset). Saccade gain (saccade amplitude / target amplitude) decreased gradually across trials. (E-G) Experiment 2, pathway-specific inhibition: a viral vector was injected into the nucleus reticularis tegmenti pontis, and laser stimulation and unit recording were conducted in the oculomotor vermis (E). (F) Histological section of the oculomotor vermis showing labelled mossy fibers (scale bar: 1 mm) and their rosettes (inset, scale bar: 100 µm). (G) Purkinje cell activity (top: raster, middle: average firing rate) and trajectories of visually guided saccades (bottom) with and without laser stimulation. Gray: laser off trials, orange: laser on trials, green: difference between gray and orange. (H-K) Experiment 3, cell type-specific activation: viral injection, laser stimulation, and unit recording were conducted in the oculomotor vermis (H). (I) Histological section of the oculomotor vermis showing labeled Purkinje cells. Scale bar: 100 µm. (J) Simple spike activity of a Purkinje cell evoked by laser stimulation. Top: raster plot from 14 trials. Bottom: voltage trace from a single representative trial. (K) Trajectories of visually guided saccades with and without laser stimulation. A 10-ms light pulse during saccades increased saccade amplitudes. Individual saccade trajectories (cyan) and their average (blue) on laser-on trials. Individual saccade trajectories (light gray) and their average (dark gray) on laser-off trials. Light wavelength was 450 nm in Experiments 1 and 3 and was 589 nm in Experiment 2. Please click here to view a larger version of this figure.
Discussion
Advances in NHP optogenetics have created a need for accurate, reliable intracranial injection methods. Advantages of the method described in this report are that it is inexpensive, uses sterilizable and disposable components, and has the ability to target diverse brain areas of any depth. It also permits control of injection speed and volume by virtue of the speed with which the air valve can be controlled. Air pressure can be increased transiently to dislodge a clog and then reduced quickly to avoid subsequent over-injection that would be produced by sustained pressure. Disposable components reduce the risk of cross-contamination between injection sites.
Critical steps in this injection protocol include constructing high-quality cannulas, loading them without introducing bubbles, and selecting injection sites that are not too close together. Injections ≥1 cm apart usually transduce non-overlapping regions, but this heuristic is dependent on viral serotype, titer, promoter, volume, target, and method of detection. Selecting injection sites that are not directly connected avoids potential confounds produced by opsin trafficking along axons and the propensity of some AAV serotypes for retrograde transduction.
The method can be used to inject NHPs while anesthetized and in a stereotaxic frame (Figure 3) or alert and head-fixed (Figure 4). The former has the advantage of allowing injections to be targeted in stereotaxic coordinates, and it allows visual confirmation of cannula penetration through an acute durotomy (incising the dura in an awake monkey, through a chronic craniotomy, elevates the risk of infection). The latter approach has the advantages of reducing the number of survival surgeries and therefore the stress to the animal, being compatible with electrophysiological recordings during behavior, and using the same coordinate frame and instrumentation used to insert optical fibers for post-injection experiments. The injection technique in awake monkeys could be further improved by making injections through artificial dura13,14,15. This would confer the additional advantages of direct visualization of injection sites and the tissue fluorescence that indicates successful transduction.
Several other AAV injection techniques have been used in NHPs. Recently, a multi-channel injection device was developed to deliver AAV vectors uniformly to large NHP cortical regions16. Similar results can be obtained using convection-enhanced delivery17,18. These methods aim to maximize transduction spread, which is an important goal but one that is distinct from the spatial precision our method aims to achieve.
Another alternative method is to inject AAV vectors through borosilicate tubing that is beveled to a sharp tip on one end and attached to a Hamilton syringe on the other5,6. This method has much in common with the method described in this paper. The viral vector is held in a length of tubing, the space in the tubing behind the virus is filled with dyed oil, and flow of the vector is monitored via the movement of the oil-vector meniscus. This alternative technique requires less equipment and preparation, but it requires drawing oil into the borosilicate tubing through the beveled tip by negative pressure and loading the vector via the same route subsequently. This inevitably results in traces of oil delivered to the brain. Additionally, in our experience, the borosilicate tubing must have a diameter of ~350 µm to penetrate dura even when beveled and therefore causes greater mechanical damage than the thinner metal cannula described in this paper (Figure 2D). 30 G tubing was used because its critical buckling load is high enough to mediate dura penetration despite a 1-10 cm length, because it fits the PTFE tubing tightly, and because it rarely becomes obstructed. 33 G tubing clogs and bends more easily and is more difficult to mate with the PTFE tubing. 36 G tubing is insufficiently stiff to penetrate NHP dura mater.
Another alternative injection technique is to mate the output of the air pump to a back of a vector-loaded, pulled-glass pipette19. The vector is forced from the pipette tip by direct, intermittent air pressure from the pump, eliminating the need for oil. Similar to the single-tube method explained above, the lack of any material junctions between the meniscus and the cannula tip reduces the risk of leaks. However, the sharp taper and delicate tips of glass pipettes prevent them from penetrating NHP dura or targeting deep structures.
Disclosures
The authors have nothing to disclose.
Acknowledgements
This study was supported by WaNPRC/ITHS P51OD010425 (JTT), National Institute of Health (NIH) grants EY023277 (R01 for YK), EY030441 (R01 for GH), MH114126 (RF1 to JTT, Boaz Levi, Ed Lein), MH120095 (UG3 for JTT and GH), EY028902 (R01 for RS), and made possible by NIH grants OD010425 (P51 for WaNPRC) and University of Washington Royalty Research Fund A148416. The authors would like to thank Yasmine El-Shamayleh and Victoria Omstead for histology, Refugio Martinez for viral vector cloning, and John Mich for assistance with NHP brain tissue processing.
Materials
| Name | Company | Catalog Number | Comments |
|---|---|---|---|
| Equipment: Stereotaxic set | |||
| Item | |||
| Allen keys | BONDHUS | 10936 | STERRAD |
| Cannula holder | KOPF | 1770 | STERRAD |
| Carrier (manipulator) | KOPF | 1404 | STERRAD |
| Carrier platform | KOPF | 1430 | NA |
| Carrier stand | KOPF | 1449 | STERRAD |
| Eye, ear, mouth bars | KOPF | 1430 | NA |
| Stereotaxic base | KOPF | 1210 | NA |
| Equipment: Cannula | |||
| Item | |||
| 1 mL Luer-lock syringes | BD | 309628 | NA (sterilized package) |
| Cannulas* | (homemade - see below) | NA | steam (autoclave) |
| Colored oil** | (homemade - see below) | NA | NA |
| Elevator (for tube rack) | Cole-Parmer | UX-08057-10 | STERRAD |
| Filter tip | Genesee Scientific | 23-404 | NA (sterilized package) |
| Fluorescent microbeads | Lumafluor | R170 | NA |
| P20 pipetman | Gilson | FA10003M | NA |
| PCR tubes | Olympus Plastics | 22-161 | STERRAD |
| Stopcock | Cole-Parmer | 3060004 | STERRAD |
| Tube rack | homemade | NA | STERRAD |
| Vector solution | (homemade) | NA | NA |
| Equipment: Electric air pump set | |||
| Item | |||
| Electric air pump | World Precision Instruments | PV830 | NA |
| Foot pedal | World Precision Instruments | 3260 | NA |
| Tube cover | EZ Drape | A400-1000 | NA (sterilized package) |
| Equipment: General surgery tools | |||
| Item | |||
| Beaker | MEDLINE | azlon | STERRAD |
| Burrs | STRYKER | 277-10-235 | STERRAD |
| Double pronged tissue pick | Fine Science Tools | 18067-11 | STERRAD |
| Drapes | MEDLINE | DYNJP3004 | NA (sterilized package) |
| Dressing forceps | Miltex | 6-118 | STERRAD |
| Drill | STRYKER | Q9R-5400 | NA |
| Drill bits | STRYKER | 277-82-87 | STERRAD |
| Gauze | MEDLINE | NON26334 | NA (sterilized package) |
| Hemostatic mosquito forceps | Miltex | 7-2, 7-4 | STERRAD |
| Light handles | SKYTRON | Stellar XL | STERRAD |
| Needle hodler | Miltex | 8-2 | STERRAD |
| Periosteal elevator | Miltex | 18-1968 | STERRAD |
| Rongeurs | Miltex | 17-4800 | STERRAD |
| Saline | BAXTER | 2F7122 | STERRAD |
| Scalpel | Bard-Parker | 372610 | STERRAD |
| Scissors | Miltex | 5-12, 5-114 | STERRAD |
| Senn retractors | Miltex | 28065 | STERRAD |
| Sterile gloves | MEDLINE | Triumph Micro | NA (sterilized package) |
| Suction | medela | 200-4869 | NA |
| Suction tip | MEDLINE | DYNDFR12S | NA (sterilized package) |
| Suction tube | COVIDEN | 8888301614 | NA (sterilized package) |
| Surgical gowns | MEDLINE | DYNJP2002S | NA (sterilized package) |
| Surgical pens & ruler | MEDLINE | DYNJSM03 | NA (sterilized package) |
| Suture | COVIDEN | SL-635 | NA (sterilized package) |
| Tissue forceps | Miltex | 6-114 | STERRAD |
| Towel clamps | Miltex | 7-504 | STERRAD |
| Wood swabs | MEDLINE | MDS202095 | NA (sterilized package) |
| Equipment: *cannulas | |||
| Item | |||
| Hypodermic needle | EXELINT INTERNATIONAL | 26437 | NA (sterilized package) |
| Stainless steel tube | K-TUBE | K30R | NA |
| PTFE tube | ZEUS | 216200 | NA |
| Equipment: **colored oil | |||
| Item | |||
| Liquid Candle Dye Concentrate | PremiumCraft | Red/Pink | NA |
| Mineral oil | Vi-Jon | S0883 | NA |
| STERRAD: low-temperature hydrogen peroxide gas plasma |
References
- Kojima, Y., Robinson, F. R., Soetedjo, R. Cerebellar fastigial nucleus influence on ipsilateral abducens activity during saccades. Journal of Neurophysiology. 111 (8), 1553-1563 (2014).
- Kojima, Y., Soetedjo, R. Elimination of the error signal in the superior colliculus impairs saccade motor learning. Proceedings of the National Academy of Sciences of the United States of America. 115 (38), 8987-8995 (2018).
- Kojima, Y., Soetedjo, R., Fuchs, A. F. Effects of GABA agonist and antagonist injections into the oculomotor vermis on horizontal saccades. Brain Research. 1366, 93-100 (2010).
- Kojima, Y., Soetedjo, R., Fuchs, A. F. Effect of inactivation and disinhibition of the oculomotor vermis on saccade adaptation. Brain Research. 1401, 30-39 (2011).
- De, A., El-Shamayleh, Y., Horwitz, G. D. Fast and reversible neural inactivation in macaque cortex by optogenetic stimulation of GABAergic neurons. eLife. 9, 52658(2020).
- El-Shamayleh, Y., Kojima, Y., Soetedjo, R., Horwitz, G. D. Selective optogenetic control of Purkinje cells in monkey cerebellum. Neuron. 95 (1), 51-62 (2017).
- Mich, J. K., et al. Functional enhancer elements drive subclass-selective expression from mouse to primate neocortex. Cell Reports. 34 (13), 108754(2021).
- Graybuck, L. T., et al. Enhancer viruses for combinatorial cell subclass-specific labeling. Neuron. (21), 00159(2020).
- Michel, J., Benninger, D., Dietz, V., van Hedel, H. J. Obstacle stepping in patients with Parkinson's disease. Complexity does influence performance. Journal of Neurology. 256 (3), 457-463 (2009).
- Chan, K. Y., et al. Engineered AAVs for efficient noninvasive gene delivery to the central and peripheral nervous systems. Nature Neuroscience. 20 (8), 1172-1179 (2017).
- Kaku, Y., Yoshida, K., Iwamoto, Y. Learning signals from the superior colliculus for adaptation of saccadic eye movements in the monkey. Journal of Neuroscience. 29 (16), 5266-5275 (2009).
- Soetedjo, R., Fuchs, A. F., Kojima, Y. Subthreshold activation of the superior colliculus drives saccade motor learning. Journal of Neuroscience. 29 (48), 15213-15222 (2009).
- Kleinbart, J. E., et al. A modular implant system for multimodal recording and manipulation of the primate brain. Annual International Conference of the IEEE Engineering in Medicine and Biology Society. IEEE Engineering in Medicine and Biology Society. Annual International Conference. 2018, 3362-3365 (2018).
- Arieli, A., Grinvald, A., Slovin, H. Dural substitute for long-term imaging of cortical activity in behaving monkeys and its clinical implications. Journal of Neuroscience Methods. 114 (2), 119-133 (2002).
- Ruiz, O., et al. Optogenetics through windows on the brain in the nonhuman primate. Journal of Neurophysiology. 110 (6), 1455-1467 (2013).
- Fredericks, J. M., et al. Methods for mechanical delivery of viral vectors into rhesus monkey brain. Journal of Neuroscience Methods. 339, 108730(2020).
- Bankiewicz, K. S., et al. Convection-enhanced delivery of AAV vector in parkinsonian monkeys; in vivo detection of gene expression and restoration of dopaminergic function using pro-drug approach. Experimental Neurology. 164 (1), 2-14 (2000).
- Yazdan-Shahmorad, A., et al. Widespread optogenetic expression in macaque cortex obtained with MR-guided, convection enhanced delivery (CED) of AAV vector to the thalamus. Journal of Neuroscience Methods. 293, 347-358 (2018).
- Nathanson, J. L., Yanagawa, Y., Obata, K., Callaway, E. M. Preferential labeling of inhibitory and excitatory cortical neurons by endogenous tropism of adeno-associated virus and lentivirus vectors. Neuroscience. 161 (2), 441-450 (2009).
Reprints and Permissions
