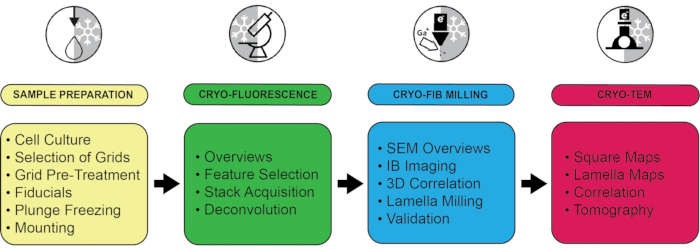
Figure 1: Summary of the workflow with a selection of critical steps. The entire protocol is divided into four stages according to the equipment used: Sample preparation, including plunge freezing, cryo-fluorescence microscopy, cryo-focused ion beam milling, and cryo-electron microscopy. For each step, several key points are highlighted. Please click here to view a larger version of this figure.
1. Cell culture and plunge freezing of grids
- Culture cells of choice and optimize labeling and treatment strategies at room temperature before moving to cryo-experiments. Targets of interest are either labeled using fluorescent protein fusions or live staining (e.g., Halo-Tag, LysoTracker, BODIPY, live antibody staining, etc.). If treatment with chemical or biological agents (small molecules, special media, siRNA, etc.) is needed to investigate the biological process of interest, optimize the conditions (e.g., time, concentration) using live-cell FLM imaging.
- Ensure that the sites of interest can be localized successfully above background in a sufficient number of cells using imaging settings that match later cryo-conditions as closely as possible (i.e., NA, exposure time, etc.).
- Selection and preparation of grids
- Select grids with hole size and spacing appropriate for the cells and the fiducial markers used (see step 1.3.1). Do not use continuous film without holes as this might result in too much residual buffer after blotting and thus reduce vitrification efficiency and hamper the detection of fiducial beads. For prolonged contact of the cells with the grids, ensure that the grid support and film material are biocompatible.
- Plasma-clean the cryo-EM grids to make them more hydrophilic. For use in adherent cell culture, sterilize the grids after plasma-cleaning with UV radiation for 20 min in a laminar flow hood. Optionally, grids may be pre-treated with compounds that help with cell adhesion, such as poly-L-lysine or concanavalin A, as described below.
NOTE: In general, the following grid/sample combinations have successfully been used in the correlative cryo-FIB workflow: Yeast: Cu or Au, 200 mesh, R1/4 carbon or SiO2 film, optionally coated with concanavalin A; Escherichia coli: Cu or Au, 200 mesh, R1/4 carbon or SiO2 film; Chlamydomonas reinhardtii: Cu or Au, 200 mesh, R1/2 or R1/4 carbon or SiO2 film; HeLa: Au, 200 mesh, R1/4 SiO2 film, coated with poly-L-lysine; HEK293: Au, 200 mesh, R1/4 SiO2 film, coated with poly-L-lysine. - Concanavalin A coating to improve the attachment of yeast cells:
- Prepare a coating solution of 1 mg/mL of concanavalin A in 10 mM HEPES buffer with 100 µM CaCl2, pH 8.5. Place one drop (50 µL) of the coating solution and two drops of distilled water separately on a piece of paraffin film.
- Pick up the plasma-cleaned grid with reverse-force tweezers and insert it carefully into the drop of the coating solution, avoiding movements perpendicular to the grid to prevent damage to the film.
- After ~5 s incubation, wash the grid two times by inserting it into the drops of water in a similar fashion. Finally, blot off the excess liquid by applying a filter paper to the back of the grid and let the grid dry completely before releasing it from the tweezers. Use the dried grids for plunge-freezing.
- Poly-L-lysine coating for suspension culture and adherent cells:
- Prepare a coating solution of 1 mg/mL of poly-L-lysine in 0.1 M sodium borate buffer, pH 8.5.
- Place plasma-cleaned grids into a suitable dish for cell culture and sterilize for 20 min by UV radiation.
- Gently add enough coating solution to cover all the grids and incubate at 37 °C for at least 2 h. Aspirate the liquid and gently wash the grids two times with PBS before seeding the cells to the desired concentration.
- Preparation of cells and fiducial beads
NOTE: Fiducial beads are required for 3D registration of the fluorescence data with images taken in the FIB/SEM microscope to allow 3D-correlative FIB milling.- Choose beads recognizable in all imaging modalities, i.e., FLM, SEM, and IB (recommended diameter 0.5-1 µm), but ensure these do not outshine the cellular target structure during fluorescence imaging to make it easier to differentiate the beads and the biological feature of interest. Remove cytotoxic preservatives in fiducial beads (e.g., NaN3) as instructed by the manufacturer.
NOTE: For an easier distinction between the biological features of interest and the fiducials, it is useful if fluorescence emission spectra only partially overlap so that signals can be distinguished based on intensity differences in the FLM channels. - If suspension culture is used, grow the cells to a suitable density (e.g., yeast OD600 = 0.8, E. coli OD600 = 0.8-1.0, C. reinhardtii 1500 cells/µL) and perform treatments as required for the experiment such as change of medium, addition of chemicals, starvation, etc. Attach the plasma-cleaned grids to tweezers as required for the plunging method (manual/automatic), and apply 4 µL of the cell suspension mixed with ~1 x 10⁵ beads/µL of fiducial bead suspension to the film side of the grids.
NOTE: Determine the optimal dilution of cells and fiducials in titration experiments (e.g., by checking on the cryo-FLM or FIB/SEM, see below). However, for most cells grown in suspension, a final concentration of ~1 x 10⁵ beads/µL of the 1 µm fiducial beads (1:20 dilution from stock; see Table of Materials for details) has proven a good starting point. - If adherent culture is used, plasma-clean and sterilize the grids using UV-radiation for aseptic culture. If necessary, pre-coat grids with compounds that help cell adhesion (e.g., poly-l-lysine, fibronectin, laminin; see step 1.2.2). Seed and grow cells on the grids in normal culture dishes or dishes with subdivisions for grids.
- Treat the samples as necessary for the experiment and maintain the cells in optimal conditions just until plunge freezing (e.g., 37 °C/5% CO2 for HEK/HeLa). Carefully remove the grids from the culture dish and attach them to the plunging tweezers. Apply 4 µL of the culture medium mixed with fiducials (1 x 10⁵ beads/µL for 1 µm fiducials) to the cell-bearing side.
- Choose beads recognizable in all imaging modalities, i.e., FLM, SEM, and IB (recommended diameter 0.5-1 µm), but ensure these do not outshine the cellular target structure during fluorescence imaging to make it easier to differentiate the beads and the biological feature of interest. Remove cytotoxic preservatives in fiducial beads (e.g., NaN3) as instructed by the manufacturer.
- Plunge-freeze the cells using either a manual or an automated freezing procedure. If possible, only blot the grid from the side opposite to the cells to prevent mechanically damaging the cells (Figure 2A). On two-armed automated plunging systems, achieve this by placing a Polytetrafluoroethylene (e.g., Teflon) sheet instead of blotting paper on the pad facing the cells. Transfer the grids to storage boxes and keep them in liquid nitrogen (lN2) until use.
CAUTION: lN2 and other cryogens can cause severe damage to the eyes and skin. Use personal protective equipment (PPE) and only work in a well-ventilated space to avoid the buildup of dangerous N2 concentrations.
NOTE: All subsequent steps should best be carried out in the liquid phase of lN2 to avoid contamination of the cell and lamella surfaces, as this might complicate downstream processing. Reduce contact with floating ice crystals by always using clean liquid nitrogen (e.g., filter to remove floating ice), eliminating unnecessary transfer steps, and, if possible, working in a humidity-controlled environment. - Mount and clip the plunge-frozen grids in AutoGrids with cutout and the cells facing up (Figure 2A) for subsequent cryo-fluorescence imaging and FIB milling. To ensure proper alignment of the samples in the TEM, the milling direction needs to be orthogonal to the cryo-ET tilt axis. Accordingly, place the orientation marks (e.g., LASER-engraving or removable marker dots) on AutoGrids before clipping to help with this alignment (Figure 2A).
- Screen the grid quality (Figure 2B) on the cryo-FLM and FIB/SEM. Optimize the cell density, blotting time and force to get an even distribution of cells and beads. Use reflected light imaging on a cryo-fluorescence microscope or use the cryo-FIB-SEM to make sure that both cells and fiducial beads are clearly visible (Figure 2B, white arrows).
- If necessary, repeat plunging with better conditions, e.g., varying cell concentration and/or blotting time. Once suitable plunging parameters have been found, do not repeat grid screening for each new round of experiments.

Figure 2: Screening for suitable grids using SEM and IB. (A) Orientation marks should be placed on the AutoGrids perpendicular to the milling direction to simplify correct loading into the TEM. Cells are mounted facing up in the assembled AutoGrid. (B) After plunge freezing, grids are inspected in the SEM to evaluate and optimize plunging conditions: a) There should not be too many cells per grid. For HeLa cells, for example, do not use more than 1-4 cells/square. For smaller cells such as Saccharomyces cerevisiae (shown here), clumps of 4-6 cells have been found useful. b) Fiducial beads (white arrows) should clearly be visible, and there should not be too much buffer surrounding the cells. Please click here to view a larger version of this figure.
2. Cryo-fluorescence light microscopy
- For each grid, acquire an overview in (widefield) fluorescence and differential interference contrast (DIC) or reflected mode and select suitable grid squares with fluorescence signal. Choose fields of view that contain both the cells of interest and a sufficient number of fiducial markers (6-12).
- Ensure that the cells and beads are evenly distributed, not too dense, and toward the center of each square. Only choose squares accessible both to the FIB-SEM and TEM instrument, hence those at least three squares away from the grid edge on 200 mesh grids (Figure 3A, inside the red circle).
- On each of the selected grid squares, acquire a fluorescent stack with a focus step appropriate for later deconvolution, i.e., <½ the axial resolution limit. If possible, use high-numerical-aperture (NA) objectives to increase photon count and localization accuracy.
- In a confocal microscope with NA 0.9 objective, acquire stacks with 300 nm step size, oversampling the Nyquist value. Record multiple color stacks if needed (Figure 2B). Store grids under lN2 until further use.
NOTE: To determine the optimal step size, choose the values calculated by the microscope control software or use online tools9. Check for bleed-through of signal between channels since excessive bleed-through is detrimental for colocalization experiments. However, some may be advantageous to correct for chromatic aberrations in multi-color stacks.
- In a confocal microscope with NA 0.9 objective, acquire stacks with 300 nm step size, oversampling the Nyquist value. Record multiple color stacks if needed (Figure 2B). Store grids under lN2 until further use.
- Deconvolve stacks using appropriate software10,11 and re-slice7 them if an isotropic pixel size is required. Deconvolution — just as at room temperature — cleans up the FLM signal and may improve localization accuracy (Figure 3C).
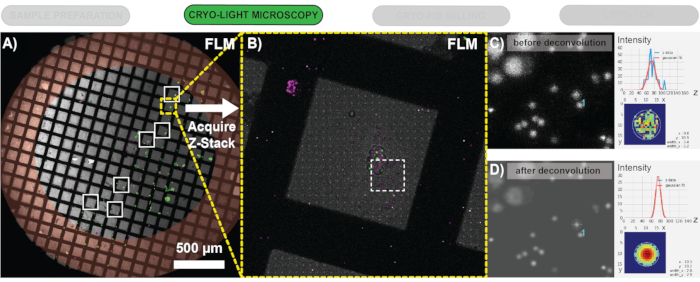
Figure 3: Selecting squares for FLM stack acquisition and improvement of data by deconvolution. (A) Overview of a grid plunged with yeast cells expressing eGFP-Ede1 (green) and mCherry-Atg8 (magenta). Choose positions with a good distribution of beads and cells, but avoid the edges of the grid (shaded red). The boxes indicate positions with good cell distributions where fluorescence stacks were taken. (B) Maximum intensity projection (MIP) of the multi-color stack taken on the yellow-boxed square (from A) after deconvolution. Deconvolution of the FLM stacks significantly cleans up unwanted background signals and helps localize beads in z more accurately, as apparent from gaussian fits before (C) and after deconvolution (D) (fits were performed in 3DCT and are shown for the bead marked with 1). Images show zoomed-in MIP views of the red channel (excitation: 552 nm, emission: 585-650 nm). Please click here to view a larger version of this figure.
3. Focused ion beam milling
- Load the grids into the cryo-FIB-SEM instrument and use either the cutout and/or orientation marks to ensure proper orientation for later placement into the TEM (Figure 2A). Ensure that the milling direction is perpendicular to the tilt axis of the TEM.
- Use a gas injection system (GIS; CpMePtMe3) at the stage positions pre-defined by the FIB-SEM setup to coat the grids with a protective organometallic layer. Do not apply too much, as this might interfere with fiducial bead localization in the TEM later. Use a plasma coater to apply metallic platinum to reduce sample charging.
NOTE: If no settings for GIS coating are available, they can easily be found by performing successive rounds of short coating (~2 s), followed by FIB milling. Ensure that the sample can still be cut successfully at medium currents (~100 pA) without apparent fringing of the protective organometallic layer around the lamella edges. Both time and distance of the GIS needle (with respect to the sample) are important parameters to consider. Do not operate the GIS needle at room-temperature settings (i.e., 45 °C), but as cold as possible to still provide an even coating (25-27 °C). - Record an SEM grid overview and perform a 2D correlation with FLM overviews to find the grid squares for which fluorescent stacks have been recorded. Manually inspect both views or use various software packages7,10,12 to find the grid squares. Here, the focus is on the 3D correlation toolbox (3DCT)7, which uses 3D rigid body transformation with isotropic scaling between views. An excellent walk-through on 3DCTs functions is available online13.
- Select and mark at least four corresponding positions, e.g., landmarks such as grid bars or holes in the support film, in both the FLM and SEM grid overview (right-click) and calculate the transformation between the marked points (correlate).
- Next, place the markers in the center of the corresponding grid squares for which FLM stacks have been acquired and predict their position in the SEM view (correlate; Figure 4A).
- For each correlated grid square, take a low-current (≤10 pA) ion beam (IB) image at the FIB milling angle of choice (10°-25° for 45° pre-tilt shuttle). Select a field of view (i.e., position and magnification) that matches the fluorescence data. For 200 mesh grids, acquire fluorescence and FIB/SEM data to contain single grid squares, including the grid bars (see Figure 3A and Figure 4A).
NOTE: Milling should be performed at as shallow an angle as possible to avoid losing significant angular range during cryo-ET and to allow identification of a sufficient number of fiducial beads. For example: with a stage tilt of 17°, a shuttle pre-tilt of 45°, and a FIB beam tilt of 52° relative to the plummet, the lamella pre-tilt is 10°, which just about meets the preferred angular range of ±60° in the TEM by tilting from -50° to +70°, the maximum of many TEM cryo-holders. - Take an SEM image of the same square to help with the identification of corresponding beads in the fluorescence and ion beam view.
- Perform registration of the deconvolved 3D FLM stack and the 2D ion beam view for each position with the 3DCT as described in the following (Figure 4B) steps.
- Load the corresponding resliced 3D FLM stack and ion beam (IB) view in 3DCT.
NOTE: Multi-color fluorescence data can be loaded as up to three separate single-channel stack files. - Select 4 fiducial beads in the fluorescence data and right-click on the positions list to determine their 3D position via Gaussian fitting of the signal in x, y, and z. Select the corresponding beads in the IB image and perform an initial 3D correlation (correlate).
- Iteratively add more beads in the fluorescence image, refine their 3D position, and predict their position in the IB view to quickly add more beads to the registration and to check the accuracy of the correlation. In 3DCT, root-mean-square error (RMSE) values are provided to assess the correlation consistency7.
- Ensure that the RMSE values are small and on the order of the localization accuracy (~300 nm). To determine the accuracy of the correlation, leave out some fiducial beads clearly identifiable in both fluorescence and ion beam deliberately during the registration step. Do this by checking their predicted versus actual location in the ion beam image. If the predicted position differs significantly from the real, repeat the initial correlation with a new set of fiducials.
NOTE: Correlating 6-8 beads has proven sufficient for accurate registration of the FLM stacks and the IB views. However, adding more fiducials (up to 12-15) over a wide range of z values (e.g., by selecting beads on the grid bar or in neighboring squares) may improve the accuracy of correlation.
- Ensure that the RMSE values are small and on the order of the localization accuracy (~300 nm). To determine the accuracy of the correlation, leave out some fiducial beads clearly identifiable in both fluorescence and ion beam deliberately during the registration step. Do this by checking their predicted versus actual location in the ion beam image. If the predicted position differs significantly from the real, repeat the initial correlation with a new set of fiducials.
- Select the targeted cellular signals, fit their 3D position in the FLM stack and apply the transformation to predict the target positions in the IB view (Figure 4B).
NOTE: Any entry in the FLM positions list, which does not have a counterpart in the IB list, will be treated as a signal to be predicted.
- Load the corresponding resliced 3D FLM stack and ion beam (IB) view in 3DCT.
- For each correlated square, transfer predicted positions of the features of interest to the FIB-SEM instrument and place lamella milling patterns (Figure 4C). Transfer positions manually (e.g., by measuring the distance to visible landmarks, such as cells or fiducial beads) or use automation and scripting as implemented, for example, in SerialFIB14. If there are multiple signals per cell, place the patterns to include as many points-of-interest (POIs) as possible in the same lamella to increase throughput.
- First rough, and then fine mill the lamellas to a final thickness of 150-250 nm. Avoid steps (e.g., stress relief cuts15) that cause sagging of the lamella and thus result in movement of the actual feature of interest with respect to the previously acquired FLM stacks. Use either manual3 or automated14,16,17,18 FIB milling procedures. With either method, ensure that the feature of interest remains in the center of the lamella by symmetrically thinning it from the top and bottom.
- To evaluate the accuracy of milling for each lamella, perform the same registration as in step 3.4. However, this time, use the final IB image after FIB milling and check whether the predicted positions of the features of interest are contained within the final lamella. Alternatively, overlay the rotated projections of the FLM stacks, obtained from 3DCT's output and custom scripts19, with the final IB image (Figure 4C, small insert).

Figure 4: 3D-correlative FIB milling procedure. (A) 2D-2D correlation of FLM (left) and SEM (right) overviews of the grid is used to locate the grid squares on which fluorescent stacks were taken previously. (B) For each selected square, after 3D-2D registration of corresponding fiducial positions in 3DCT (colored boxes), positions of biological features of interest are selected in the FLM data. Based on the prediction of corresponding positions in the ion beam image (red circles), sites for lamella preparation are selected. (C) Scanning electron microscope (SEM) and ion beam (IB) images are used to keep the target centered during milling. Final thicknesses of 150-250 nm have been found adequate for further downstream processing. Please click here to view a larger version of this figure.
4. Correlative TEM
- Load the grids into the TEM, making sure that lamella orientation (as apparent from cutout or orientation marks) is perpendicular to the tilt axis.
NOTE: Microscopes of different manufacturers can be controlled using various software, e.g., Tomo5, TOM, or SerialEM20. Here, the focus is on the latter. - Acquire grid montage and overviews for each grid square containing lamellas. Ensure that the magnification and exposure time is suitable to visualize the fiducial beads in the TEM images without significantly adding to the total electron dose. Acquire high-resolution TEM maps (montages) of each lamella.
- Register and 3D-2D correlate the FLM stack with the TEM grid square and the lamella overviews in 3DCT. Use the same procedure as described in step 3.6 by selecting corresponding bead positions in the fluorescence (x, y, z – gaussian fit) and transmission electron microscope images. Then, select the positions of interest in the FLM channels and transfer them to the TEM overviews. If necessary, use a two-step procedure comprising a first correlation between FLM and low magnification TEM, and second one from low to high magnification TEM (Figure 5).
- Transfer positions either manually (by measuring distances to landmarks), the registration and map tools available within SerialEM20, or external software such as CorRelator21.
- Set up and run tilt-series at correlated positions. Use an appropriate magnification, defocus, and total dose (see Table of Materials and Table 1 for details). Start the acquisition at the pre-tilt determined by the lamella (also see the note in step 3.4) and use a dose-symmetric tilt scheme22. Use either manual or batch acquisition.

Figure 5: Localization of correlated positions in the TEM. After successful 3D-correlative FIB milling and transfer to the transmission electron microscope, 3D-2D registration is performed for each milled square between fiducial beads (colored boxes) in FLM stacks and TEM overviews to localize potential sites for cryo-ET (red circles). Higher magnification lamella overviews (zoom-in) can then be acquired to set up tomograms more precisely. Please click here to view a larger version of this figure.
The protocol provides a walk-through of the pipeline used to discover the EH domain-containing and endocytosis protein 1 (Ede1)-dependent endocytic protein deposit (END) and its degradation and trapping in autophagic bodies8. The END is a liquid-liquid phase-separated compartment in S. cerevisiae, which buffers a variety of proteins involved in clathrin-mediated endocytosis (CME) after failed endocytic events. One of its main components is Ede1, which doubles as a CME component and as a selective autophagy receptor for the degradation of this new LLPS compartment. Accordingly, an EGFP fusion of Ede1 (EGFP-Ede1) under the control of the alcohol dehydrogenase (ADH) promoter was used to visualize ENDs since Ede1 overexpression interferes with the early stages of endocytosis and therefore constitutively induces LLPS.
On a plunge-frozen grid with EGFP-Ede1 overexpressing yeast cells and 1 µm fiducial markers, five positions were selected for FLM stack acquisition in the GFP channel (Figure 6A; TFS Corrsight; confocal mode, 300 nm focus step size, 10 µm range). The grid was transferred to the FIB instrument (Quanta 3D FEG), and the grid squares for which FLM stacks had been acquired were identified by performing a 2D-2D correlation of the fluorescence and SEM grid overviews (compare step 3.2).
For each of the chosen squares, ion beam images were taken at a low current (10 pA, 1200x magnification), and corresponding fiducial positions were registered in 3DCT. After selection of positions with the biological feature of interest and fitting their 3D position within the FLM stack, the found transformation was applied to putative END positions, and the sites for lamella preparation were selected (Figure 6B). A FIB beam inclined 11° relative to the grid surface was used in the examples shown here (45° FIB shuttle pre-tilt; 18° stage tilt). Positions of interest were transferred, and FIB patterns were drawn manually (Figure 6D) by measuring the distance of the predicted positions relative to prominent landmarks in the FIB image (e.g., holes, ice contaminations, fiducial beads). The accuracy of the registration was evaluated by deliberately leaving out beads that could clearly be identified in the FLM and IB image, and then comparing their actual and predicted positions in the ion beam view (e.g., diamond in Figure 6B,C). The correlation for the square shown in Figure 6C was found to be accurate (i.e., the predicted position of FLM bead positions perfectly coincided with their corresponding IB location and 3DCT reported sub-pixel RMSE values for the registration). Thus, lamellas were cut at the predicted positions (Site B) and fine-milled to a thickness of ~200 nm (final pattern offset).

Figure 6: Representative results for 3D-correlative targeting of endocytic protein deposits (END) in yeast. (A) SEM overview of the grid before milling. The colored boxes indicate grid squares for which fluorescence stacks were taken beforehand. (B–C) 3D correlation in a grid square. After registering several corresponding fiducial beads (colored boxes) in the FLM data (B, shown here as maximum intensity projection) and the ion beam image (C), the accuracy of the 3D registration was verified by predicting the position of the bead indicated with the diamond. Next, the positions of the target signal (red circles) were predicted in the ion beam view for two potential milling sites. (D) Zoom-in of Site B showing the predicted positions of three target puncta (red circles) and the initial milling patterns (yellow boxes). A fourth fluorescence punctum was predicted to be much lower than the other puncta and therefore not targeted during milling (gray circle). Please click here to view a larger version of this figure.
After successful FIB milling and transfer of the grid to the cryo-transmission electron microscope (Titan Krios operated at 300 kV and equipped with a Gatan K2 direct electron detector and Bioquantum energy filter), a grid overview was recorded in SerialEM and used to locate squares with lamellas. For each lamella, overview images were acquired, and the FLM data was registered in 3DCT (3D-2D) using corresponding fiducial beads. Positions of the biological features of interest (Figure 7A) were then predicted using the transformation calculated from the fiducial beads. Lamella overviews recorded at higher magnification were stitched, and sites of interest correlated using clearly visible landmarks (e.g., fiducial beads). Alternatively, classical CLEM overviews can be produced in various softwares10,12.
Based on the correlation, four potential sites for tomogram acquisition were found for the lamella shown in Figure 7A. However, this also includes a position that was not targeted during the 3D-correlated FIB-milling (compare Figure 6D; gray circle) and a position blocked by ice contamination (Figure 7; gray boxes). Accordingly, tomograms could only be recorded for two positions (Figure 7B). Overall, a correlation success of ~75%, i.e., lamellas that survived the transfer to the TEM and END structures were found at the predicted sites, was achieved (12 correlated sites). After tomogram reconstruction, segmentation and template matching, individual END structures can be visualized within their native context (Figure 7C,D). This includes the fenestrated endoplasmic reticulum (ER) surrounding the END, lipid droplets occasionally making contact, and ribosomes, which are excluded from the LLPS compartment. Taken together, this shows how 3D-correlative FIB milling can provide molecular-level information of rare biological processes from intact cells.

Figure 7: Representative results for visualizing the END with cryo-ET. (A) The low magnification TEM overview of the milling site shown in Figure 6 can readily be correlated with the FLM maximum intensity projection (Figure 6B) to localize biological features of interest (red crosses). (B) In a second step, a higher magnification (stitched) view can be correlated, and positions for tomogram acquisition (yellow boxes) are set up. Locations resulting from the out-of-plane signal (gray box, compare Figure 6D) were ignored. (C–D) Using this 3D-correlative FIB approach, the endocytic protein deposit (END) can be visualized in its native environment. Structures such as the endoplasmic reticulum (ER), ribosomes, membranes, and lipid droplets can be identified and visualized. Please click here to view a larger version of this figure.
| Plasma Cleaner Settings | |||
| Harrick Plasma Cleaner PDG-3XG : | Radio Frequency setiing: "HI", 30 s; N2 plasma | ||
| Plunger Settings | |||
| TFS Vitrobot Mk IV: | 100% humidity; blotforce = 8; blottime = 10 s; wait time 0 s; (this should work for most suspension and adherent cells) | ||
| FIB GIS Positions and Timings | |||
| Quanta 3D FEG: | Tilt = 0, Rotation = -180, Z position = 13.5, Temperature setpoint =26.15° , Time = 8 s | ||
| TFS Scios: | Tilt = 0, Rotation = -180, Z position = 9.8, Temperature setpoint =28° C, Time = 7 s | ||
| TFS Aquilos 1: | Software predefined position, Temperature setpoint = 28° , Time = 7 s | ||
| TFS Aquilos 2: | Software predefined position, Temperature setpoint = 28°, Time = 7 s | ||
| FIB Sputter Coater Settings | |||
| Quorum System: | In Quorum prep chamber: 10 mA, 40 s | ||
| TFS Scios: | 10 W, 500 V, 250 mA, 0.2 mbar, 15 s | ||
| TFS Aquilos 1: | 1kV, 10 mA, 10 Pa, 15 s | ||
| TFS Aquilos 2: | 1kV, 10 mA, 10 Pa, 15 s | ||
| Tomogram Acquisition | |||
| Titan Krios Gi2 | K2 camera, Gatan Bioquantum energy filter | ||
| 20 eV slit; dose symmetric tilt scheme (Hagen) with 2° steps; start at +10° (lamella pre-tilt!) to +70°and -50° | |||
| Titan Krios Gi4 | Falcon 4; Selectris X energy filter | ||
| 10 eV slit; dose symmetric tilt scheme (Hagen) with 2° steps; start at +10° (lamella pre-tilt!) to +70° and -50° | |||
| FLM Acquisition | |||
| Corrsight (Confocal Mode) | Objective: Zeiss EC Plan-Neofluar 40×/0.9 NA Pol; Stack acquisition parameters: x-y pixel size = 161.25 nm, z step size = 300 nm. | ||
| Leica SP8 Cryo-Confocal | Objective: Leica HCX PL APO 50x / 0.90 CLEM; Stack acquisition parameters: x-y pixel size = 84 nm, z step size = 300 nm. | ||
Table 1: List of tested equipment and suggested settings.
