Here, we present a protocol for the purification of MHC class I and class II peptide complexes from mouse and human cell lines providing high-quality immunopeptidomics data. The protocol focuses on sample preparation using commercially available antibodies.
Method Article
Immunopeptidomics: Isolation of Mouse and Human MHC Class I- and II-Associated Peptides for Mass Spectrometry Analysis
* These authors contributed equally
In This Article
Summary
Abstract
Immunopeptidomics is an emerging field that fuels and guides the development of vaccines and immunotherapies. More specifically, it refers to the science of investigating the composition of peptides presented by major histocompatibility complex (MHC) class I and class II molecules using mass spectrometry (MS) technology platforms. Among all the steps in an MS-based immunopeptidomics workflow, sample preparation is critically important for capturing high-quality data of therapeutic relevance. Here, step-by-step instructions are described to isolate MHC class I and II-associated peptides by immunoaffinity purification from quality control samples, from mouse (EL4 and A20), and human (JY) cell lines more specifically. The various reagents and specific antibodies are thoroughly described to isolate MHC-associated peptides from these cell lines, including the steps to verify the beads-binding efficiency of the antibody and the elution efficiency of the MHC-peptide complexes from the beads. The protocol can be used to establish and standardize an immunopeptidomics workflow, as well as to benchmark new protocols. Moreover, the protocol represents a great starting point for any non-experts in addition to foster the intra- and inter-laboratory reproducibility of the sample preparation procedure in immunopeptidomics.
Introduction
Over the last decade, the interest in investigating the repertoire of MHC-associated peptides has exceeded the academic sector and reached the biotech and pharmaceutical industries. Indeed, in cancer, the discovery of actionable tumor-specific neoantigens represents a major research focus in the industrial sector to develop clinical immunotherapies leading to personalized oncology1,2,3. Fundamentally, MHC-associated peptides are presented throughout the entire body, reflect the intracellular stage of the cell, and are significant in various disease conditions such as autoimmunity, transplantation, infectious diseases, inflammation, cancer, and allergies1,4. Thus, MHC-associated peptides, or human leukocyte antigen (HLA) ligands in humans, are of great medical interest and are collectively referred to as the immunopeptidome5.
MS is a powerful analytical approach to characterize the immunopeptidome6,7, including the discovery of tumor-specific neoantigens8,9,10,11. A typical workflow to perform an immunopeptidomics experiment includes three main steps: 1) sample preparation for the isolation of MHC-associated peptides, 2) data acquisition by MS, and 3) data analysis using various computational software tools12. The generation of high-quality samples described in this visualized protocol is critical for the success of any project in MS-based immunopeptidomics. The protocol described below focuses on isolating MHC class I- and II-associated peptides from well-established cell lines that are suitable for generating high-quality immunopeptidomics data. Representative results from those cell lines are shown in the current protocol.
Protocol
The protocol provided here was adapted from established protocols13,14,15,16,17,18,19,20. The overall procedure for the immunoaffinity purification (IP) of MHC class I and II peptides is illustrated in Figure 1. See Table of Materials for details about the cell lines and antibodies used.
1. Beads coupling with the antibodies (Day 1): Coupling antibodies to sepharose CNBr-activated beads
NOTE: Prepare fresh solutions for each new experiment. Refer to Table of Materials and Supplementary Table 1 for the list of reagents and solutions recipes. All the steps are carried out at room temperature (RT). When using a new antibody, check the binding efficiency by collecting key aliquots (see the indication OPTIONAL) and performing Coomassie blue staining SDS-PAGE (Figure 2).
- Activation of the sepharose CNBr beads
- Weigh 80 mg of sepharose CNBr-activated beads per sample and transfer them to a 15 mL conical tube.
- To facilitate resuspension of dried beads, first, add 5 mL of 1 mM HCl and pipette up and down 5 times. Then, fill the conical tube with an additional 8.5 mL of 1 mM HCl.
- Rotate at 20 rpm (revolutions per minute) for 30 min at RT using a rotator device. Centrifuge the beads at 200 x g for 2 min at RT and remove the supernatant by aspiration.
- Add 500 µL of coupling buffer to the beads pellet and transfer to a new 2.0 mL centrifuge tube and keep aside for step 1.2.2.
- Coupling of antibodies to CNBr-activated beads
- Prepare the antibody selected for the isolation of the MHC class I or II peptides in a new 2.0 mL microcentrifuge tube by adding 2 mg of the antibody (according to the concentration specified by the manufacturer). Complete the volume to 1 mL with the coupling buffer solution to get a final concentration of 2 mg/mL.
- Centrifuge the beads from step 1.1.4 at 200 x g for 2 min at RT and then remove the supernatant by aspiration.
- Add the antibody solution to the 2.0 mL microcentrifuge tube containing the activated beads.
- (OPTIONAL) Take an aliquot of 18 µL (INPUT), add 6 µL of 4x SDS-PAGE buffer, and freeze immediately.
- Rotate the microcentrifuge tube from step 1.2.3 at 20 rpm for 120 min using a rotator device. Centrifuge the beads at 200 x g for 2 min and then remove the supernatant.
- (OPTIONAL) Take an aliquot of 18 µL of the supernatant (unbound antibody), add 6 µL of 4x SDS-PAGE buffer and freeze immediately.
- Blocking and washing of antibody coupled-beads
- Add 1 mL of 0.2 M glycine to the microcentrifuge tube containing the antibody-coupled beads from step 1.2.5. Rotate at 20 rpm for 60 min at RT using a rotator device.
- Centrifuge the beads at 200 x g for 2 min, then remove the supernatant. Add 1 mL of PBS (Phosphate-buffered saline).
- Centrifuge the beads at 200 x g for 2 min, then remove the supernatant.
- (OPTIONAL) Take an aliquot of 18 µL of the supernatant (unbound antibody, last wash), add 6 µL of 4x SDS-PAGE buffer and freeze immediately.
- Add 1 mL of PBS to the beads in step 1.3.3.
- (OPTIONAL) Take an aliquot of 18 µL of beads mixture (beads coupled with antibody), add 6 µL of 4x SDS-PAGE buffer, and freeze immediately.
- Keep at 4 °C until use the same day in step 2.5.
NOTE: Beads can be prepared the day before the immunocapture, but longer storage has not been tested.
2. Cell lysis and immunocapture with antibody coupled-beads (Day 1)
NOTE: The level of MHC molecules varies from one cell type to another, and the quantification of MHC/HLA molecules per cell is suggested21 (Figure 4A). We recommend a minimum of 1 x 10⁸ cells for each IP. This number of cells corresponds to 6-10 mg of protein from JY, EL4, and A20 cells solubilized with 0.5% Chaps buffer. To prepare cell pellets for IPs, cells should be harvested, centrifuged, and washed twice with 5 mL of PBS. Then, cell pellets can be stored in a 1.5 mL microcentrifuge tube or a 15 mL conical tube at -80 °C until the time of the IP. Note that IPs can be performed on fresh harvested or frozen cell pellets.
- To isolate MHC class I or II peptides, thaw a frozen pellet of 1 x 10⁸ cells by warming the bottom of the tube with the palm. Add 500 µL of PBS to the pellet and pipette up and down until the suspension is homogenous.
NOTE: Depending on the cell type, the cell pellet volume can vary substantially. If 500 µL of PBS is not enough to dissolve the cell pellet, use more PBS until the cells disaggregate easily while pipetting up and down. - Measure the total volume of the pellet resuspended in PBS and transfer into a new tube 2 mL microcentrifuge tube. Split into more tubes if needed.
- Add a volume of cell lysis buffer (1% chaps buffer in PBS containing protease inhibitors, 1 pellet/10 mL of buffer) equivalent to the volume of cell pellet resuspended in PBS measured in the previous step. The final concentration of the lysis buffer is 0.5% Chaps.
- Rotate at 10 rpm for 60 min at 4 °C using a rotator device. Centrifuge the cell lysate at 18,000 x g for 20 min at 4 °C with full brake and transfer the supernatant (containing the MHC-peptides complexes) in a new 2.0 mL microcentrifuge tube.
- Recover the antibody-coupled beads from step 1.3.7 by centrifugation at 200 x g for 2 min and remove the supernatant.
- Transfer the cell lysate supernatant in step 2.4 to the antibody-coupled beads and incubate with rotation (10 rpm) for 14-18 h (overnight) at 4 °C using a rotator device.
3. Elution of MHC peptides (Day 2)
NOTE: Polypropylene column allows elution of MHC-peptide complexes while retaining the beads into the column. In order to evaluate the proportion of MHC-peptides complexes bounded to the beads before and after acidic elution with 1% TFA (trifluoroacetic acid), it is possible to perform a western blot with aliquots taken at key steps during the protocol (see the indication OPTIONAL). Western blotting shown in Figure 3 reveals the enrichment of MHC-peptide complexes following acidic elution with 1% TFA. The absence of signal in this fraction would indicate that the elution step was not successful. Note that the proportion of unbound MHC-peptides complexes to the beads can also be evaluated in parallel by western blotting using an aliquot described in step 3.1.6.
- Elution of MHC-peptide complexes from the antibody coupled-beads
- Remove the bottom lid of the polypropylene column, place the column onto the polypropylene column rack and install an empty container underneath to collect flow through.
NOTE: One column per sample is required. - Rinse the polypropylene column with 10 mL of buffer A and let it drain by gravity. If the flow speed of liquid elution is too slow, further cut the bottom tip of the polypropylene column.
- Measure and collect the beads-lysate mixture (~2 mL) from step 2.5 and transfer it into the polypropylene column.
- (OPTIONAL) Take an aliquot of 20 µL (or 1/100 out of the total volume) for western blotting and freeze immediately. This fraction corresponds to the total MHC-peptides complexes incubated with the beads.
- Let the liquid mixture elute by gravity.
- (OPTIONAL) Collect and measure the flow-through and take an aliquot of 20 µL (or 1/100 out of the total volume) for western blotting and freeze immediately. This fraction represents the residual unbound MHC-peptides complexes.
- To recover the beads-lysate mixture as much as possible, rinse the tube from step 3.1.3 with 1 mL of buffer A and transfer it to the polypropylene column.
- Wash the beads retained in the polypropylene column by adding 10 mL of buffer A. Let the washing buffer elute by gravity.
- Repeat the washing step with 10 mL of buffer B, 10 mL of buffer A and then 10 mL of buffer C.
- Remove the polypropylene column from the rack and place it on the top of a new 2.0 mL microcentrifuge tube. Hold the column and the tube together with the hand.
- Add 300 µL of 1% TFA to the polypropylene column and mix the beads by pipetting up and down 5 times.
NOTE: The beads will be retained in the polypropylene column, and the MHC-bound peptides will elute in the 2.0 mL microcentrifuge tube. - Transfer the eluate in a new 2.0 mL microcentrifuge tube. Repeat step 3.1.11 and pool the 2 eluates (the eluates containing the MHC-peptide complexes should correspond to a total of 600 µL and will be used at step 3.2.4).
- (OPTIONAL) Collect an aliquot of 6 µL (or 1/100 of the total volume) for western blotting and freeze immediately. This fraction corresponds to the MHC-peptides complexes eluted from the beads.
- Remove the bottom lid of the polypropylene column, place the column onto the polypropylene column rack and install an empty container underneath to collect flow through.
- Desalting and elution of MHC peptides
NOTE: Desalting and elution of MHC peptides steps could be done by installing the C18 column onto a 2.0 mL microcentrifuge tube. For a better fit, install the anneals provided by the manufacturer between the C18 column and the 2.0 mL microcentrifuge tube. In this protocol, a C18 column is used with a volume capacity of 5-200 µL (6-60 µg). All the steps are carried out at RT.- Add 200 µL of Methanol on top of the C18 column, then centrifuge at 1546 x g for 3 min. Discard the flow-through.
- Add 200 µL of 80%ACN (acetonitrile)/0.1%TFA on top of the C18 column, then centrifuge at 1546 x g for 3 min. Discard the flow-through.
- Add 200 µL of 0.1%TFA on top of the C18 column, then centrifuge at 1546 x g for 3 min. Discard the flow-through.
- Load 200 µL of the MHC-peptide complexes from step 3.1.12 on top of the C18 column. Centrifuge at 1546 x g for 3 min and discard the flow through.
- Repeat step 3.2.4 twice until the complete volume has been loaded. Note that MHC peptides are retained in the C18 column.
- Add 200 µL of 0.1%TFA to the C18 column, then centrifuge at 1546 x g for 3 min. Discard the flow-through.
- Transfer the C18 column into a new 2.0 mL microcentrifuge tube. Elute MHC peptides from the C18 column by adding 150 µL of 28%ACN/0.1%TFA.
- Centrifuge at 1546 x g for 3 min.
- Transfer the flow-through in a new 1.5 mL microcentrifuge tube. Be careful not to discard the flow-through; it contains the isolated MHC class I or II peptides.
- Repeat steps 3.2.7-3.2.9 twice for a total volume of 450 µL.
- Freeze the 450 µL of eluate (purified MHC class I or II peptides) at -20 °C until samples are analyzed by LC-MSMS.
- Prior to LC-MS/MS analysis, the purified MHC class I or II peptides from step 3.2.11 are evaporated to dryness using a vacuum concentrator with presets of 45 °C for 2 h, vacuum level: 100 mTorr and vacuum ramp: 5.
NOTE: The evaporation of frozen samples is highly efficient. Dried peptides can be re-frozen until analysis.
4. Identification of MHC class I and II peptides by LC-MS/MS
NOTE: Analyze the MHC class I and II immunopeptidome using a High-performance Orbitrap and high-resolution quadrupole time-of-flight mass spectrometers6. The following information is given as an indication only, taking into account that the various existing tandem mass spectrometry instruments operate according to different operational standards. A brief outline of the steps are discussed below :
- Solubilize the dried samples (from step 3.2.12) in 50 µL of 4% formic acid (FA).
- Load three injections of 16 µL for each sample and separate on a home-made reversed-phase column (150-µm i.d. by 250 mm length, Jupiter 3 µm C18 300 Å) with a gradient from 5%-30% ACN-0.1% FA and a 600 nL/min flow rate on a nano-flow UHPLC connected to an MS.
- Acquire each full MS spectrum at a resolution of 120000, an AGC of 4 x 10⁵ with automatic mode for the injection time and spectra using tandem-MS (MS-MS) on the most abundant multiply charged precursor ions for a maximum of 3 s.
NOTE: Tandem-MS experiments are performed using higher-energy collisional dissociation (HCD) at a collision energy of 30%, a resolution of 30,000, an AGC of 1.5 x 10⁵, and an injection time of 300 ms. - Process the data files from the three injections/sample using a proteomics LC-MS/MS analysis software (e.g., PEAKS X) using the mouse and human databases (UniProtKB/Swiss-Prot (2019_09)).
- Select 'Unspecified Enzyme Digestion' for the enzyme parameter, and 10 ppm and 0.01 Da for mass tolerances on precursor and fragment ions, respectively.
NOTE: Variable modifications are deamidation (NQ) and oxidation (M). All other search parameters are the default values. Final peptide lists are filtered using ALC of 80% and with a false discovery rate (FDR) of 1 % using the proteomics LC-MS/MS analysis software.
5. Visualization of immunopeptidomics data
NOTE: The quality of immunopeptidomics data generated by MS can be assessed in multiple ways, as recently described22,23. To visualize the data and assess their overall quality, composition, and MHC-specificity, the MhcVizPipe (MVP) software tool can be used.
- Follow all the instructions and related documentation to install and run the MVP software available at the Caron Lab GitHub website24.
NOTE: MVP provides a rapid and consolidated view of sample quality, composition, and MHC-specificity. MVP parallelizes the use of well-established immunopeptidomics algorithms (NetMHCpan25, NetMHCIIpan26, and GibbsCluster27) and generates organized and easy-to-understand reports in HTML (HyperText Markup Language) format. The reports are fully portable and can be viewed on any computer with a modern web browser. See Supplementary Data 1-4 for examples of HTML reports.
Results
The general workflow to isolate MHC-peptide complexes for the analysis of immunopeptidomes by MS is illustrated in Figure 1. Representative results for the verification of the beads-binding efficiency of the antibody (Figure 2) (using the Y3 anti-H2Kb antibody) and the elution efficiency of the MHC-peptide complexes from the beads (Figure 3) (using the W6/32 anti-HLA-ABC antibody) are shown. Flow cytometry-based quantification assays21 were also applied to measure the absolute number of MHC class I molecules per EL4 cell (H2Kb and H2Db) and JY cell (HLA-ABC), as shown in Figure 4A.
The intra- and inter-individual reproducibility of the results using the current protocol are shown in Figure 4B-E. Representative results are shown for MHC class I peptides identified from 1 x 10⁸ EL4 cells and 1 x 10⁸ JY cells. Results were generated from two different lab members (User 1 and User 2). For User 1, the mean number of MHCI-specific peptides detected from EL4 and JY cells was 1341 and 6361, respectively; for User 2, 1933 and 7238, respectively (Figure 4B,D). The average coefficient of variation (CV) for the number of peptides detected across three different biological replicates/experiments varies from 1.9%-11% (Figure 4B,D). Although the CVs for the number of peptides detected across the three different experiments were relatively small, the identity of the peptides varied considerably (Figure 4C,E). Indeed, representative Venn diagrams show that the proportion of peptides that were reproducibly detected across three biological replicates ranged from 39% (User 2, EL4 cells) to 63% (User 1, JY cells) (Figure 4C,E and Supplementary Table 2).
Heatmaps generated by the MVP software show predicted MHC binding strength of the identified peptides using the NetMHCpan suite tools25,26,28. Two GibbsCluster routine options, which are termed 'Unsupervised GibbsCluster' and 'Allele-Specific GibbsCluster', are also performed by MVP to extract MHC peptide-binding motifs. Note that MVP has limitations; its primary goal is not to extract allele-specific motifs and annotate peptides in a highly accurate manner but to rather provide a bird's eye view on the overall quality, composition, and MHC-specificity of the samples.
For mouse MHC class I (H2Db and H2Kb) peptides in EL4 cells (Figure 5A; upper panels and Supplementary Data 1), a representative heatmap shows that 89% of all detected 8-12-mer peptides are predicted to be Strong Binders (SB: NetMHCpan %Rank <0.5) or Weak Binders (WB: NetMHCpan %Rank <2) for H2Db or H2Kb molecules. Sequence clusters generated from the 8-12-mer peptides are in concordance with reported logos for H2Db (asparagine at P5 and Leucine at P9) and H2Kb (phenylalanine at P5 and leucine at P8) (Figure 5)29. It is worth mentioning that a third dominant motif (histidine at P7 and leucine at P9) as well as additional 'artefactual' motifs can be observed using the M1 antibody (Supplementary Data 1). In fact, the M1 antibody is known to cross-react with the non-classical Qa2 molecule, and therefore, Qa2-associated peptides are also detected by MS (Supplementary Data 1). Here, for simplicity, Figure 5 focuses on showing the well-established peptide binding motifs for the two classical H2b alleles (i.e., H2Db or H2Kb) expressed in EL4 cells.
For human HLA class I (HLA-ABC) peptides in JY cells (Figure 5A; lower panels and Supplementary Data 2), a representative heatmap shows that 97% of all detected 8-12-mer peptides are predicted to be SB or WB for HLA-A*0201, -B*0702 or -C*0702. Peptides were clustered to visualize peptide binding motifs for HLA-A*0201 and -B*0702. Binding motif for HLA-C*0702 is not shown in Figure 5A because the C*0702 allele has a relatively low expression level. Therefore too few C*0702 peptides were isolated and identified to generate a representative C*0702 motif.Note that the C*0702 motif can be visualized in other studies30,31,32 or from the NetMHCpan 4.1 Motif Viewer website33.
For human HLA class II (HLA-DR) peptides in JY cells (Figure 5B; upper panels and Supplementary Data S3), a representative heatmap shows that 70% of all detected 9-22-mer peptides are predicted to be SB or WB for HLA-DRB1*0404 and -DRB1*1301. Peptide binding motifs for these two alleles are shown (Figure 5B). Note that the peptide-binding motifs shown here may not be in complete concordance with the recently reported logos for HLA-DRB1*0404 and -DRB1*130134. This discrepancy highlights the current inability of MVP/NetMHCpan to precisely annotate peptides to HLA class II alleles that are less characterized, such as HLA-DRB1*0404 and -DRB1*1301 expressed in JY cells. Additional information on class II peptide binding motifs can be found in other studies34,35 and from the NetMHCIIpan 4.0 Motif Viewer website36.
Finally, for mouse MHC class II (H2-IAd and H2-IEd) peptides in A20 cells (Figure 5B; lower panels and Supplementary Data 4), a representative heatmap shows that 87% of all detected 9-22-mer peptides are predicted to be SB or WB for H2-IAd or H2-IEd. Peptide binding motifs for these two alleles are in concordance with reported logos37.
Complete HTML reports generated by the MVP software to assess the overall quality and MHC-specificity of the samples are available in Supplementary Data 1-4.

Figure 1: Schematic of the complete procedure for the isolation of MHC class I and II peptides. (A-B)100 million cells are pelleted and lysed with 0.5% Chaps buffer. (C) The cell lysate is centrifuged, and the supernatant is added to CNBr-sepharose beads coupled to the desired antibody beforehand and (D) incubated 14-18 h at 4 °C. (E) Following immunocapture, the beads are transferred into a polypropylene column and washed, and the MHC-peptide complexes are eluted with a 1% TFA solution. (F) The peptides are desalted and eluted using a C18 column. (G) Subsequently, peptides are speed vac dried and analyzed by tandem mass spectrometry. (H) The quality of the isolated MHC class I and II peptides can be assessed based on the HLA subtypes using the freely available MhcVizPipe software. Figure created with BioRender.com (NT22ZL8QSL). Please click here to view a larger version of this figure.
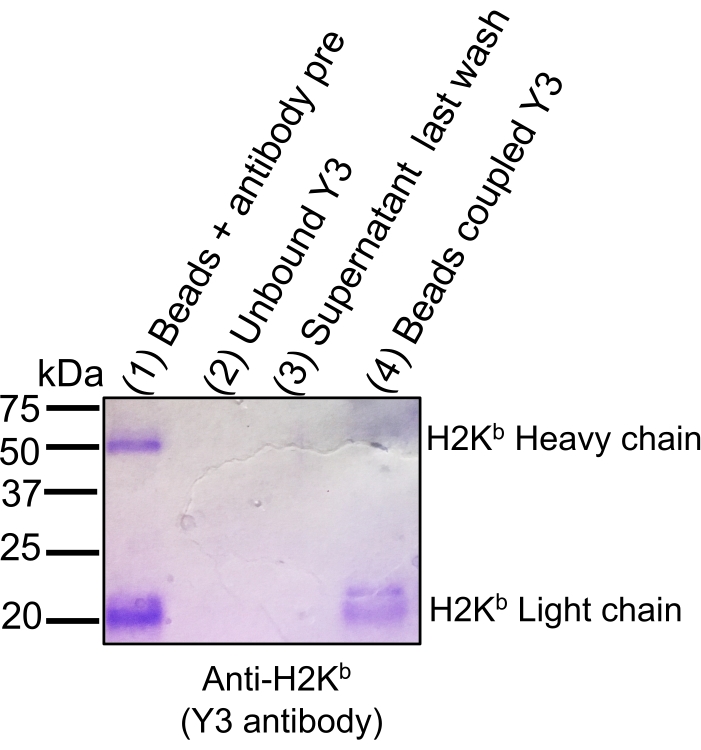
Figure 2: Coomassie gel staining to track antibody binding efficiency to sepharose CNBr-activated beads. Aliquots of equivalent volumes were loaded onto 12% SDS-PAGE gel followed by Coomassie blue staining: beads + antibody pre-coupling (1), unbound antibody following coupling step (2), supernatant following last wash after coupling (3), and beads coupled with antibody (4). The efficiency of binding is illustrated by a significant decrease in signal staining intensity of the light and heavy chains of H2Kb when beads are covalently bound (Lane 4) to the CNBr beads compared to the antibody before coupling (Lane 1). The figure has been reprinted and adapted from bioRxiv38. Please click here to view a larger version of this figure.

Figure 3: Western blotting for tracking MHC-peptide complexes following acidic elution from antibody-coupled CNBr-activated beads. Aliquots taken from the steps indicated in the protocol (1/100 of the total measured volume) were loaded onto a 12% SDS-PAGE gel and transferred onto nitrocellulose membrane: Beads + lysate following immunocapture and last wash (A); supernatant of last wash (B) and MHC-peptide complexes eluted from the beads (C). The strong detection signal of the MHC-peptide complexes in (C) using anti-HLA-ABC heavy chain antibody (Abcam, #ab 70328, 1:5000) confirmed the isolation of MHC-peptide complexes following acidic elution. Note that it is possible to assess the proportion of MHC-peptide complexes that were not captured by the antibody coupled beads by collecting the flow-through from step 3.1.6. An aliquot can be added to the western blot (not shown on this gel). Please click here to view a larger version of this figure.

Figure 4: Identification of MHC class I peptides from JY and EL4 cells. (A) Histogram showing the absolute number of cell surface H2Db and H2Kb molecules per EL4 cell and of HLA-ABC molecules per JY cell. Quantification was performed by flow cytometry. Mean and standard error of the mean were obtained from three biological replicates. (B, D) Histogram showing the mean number and standard deviation of the mean of MHC class I peptides identified by two independent users (USER_1 [U1] and USER_2 [U2]). Mean number and standard deviation of the mean of MHC class I peptides detected from mouse EL4 cells (B) and human JY cells (D) are shown. Coefficients of variation (CV) across three independent biological replicates are indicated. (C, E) Venn diagrams showing the number of peptides that were reproducibly detected in EL4 (C) and JY cells (E) by two independent users (U1 and U2) across three independent biological replicates. Figure 4A has been reprinted and adapted from bioRxiv38. Please click here to view a larger version of this figure.

Figure 5: Visualization of immunopeptidomics data using the MVP software tool. Data analysis of mouse and human (A) MHC class I and (B) MHC class II peptides. Representative binding affinity heatmaps (left panels) and peptide binding motifs (right panels) are shown. Heatmaps colors represent the MHC binding affinity predicted by NetMHCpan 4.1 (%rank). Strong Binders are red (%rank <0.5), Weak Binders are blue (%rank <2) and Non-Binders are yellow (%Rank >2). Proportion (%) of 8-12mer peptides (A) and 9-22mer peptides (B) that are SB or WB is indicated in parenthesis. Peptide binding motifs were generated by MVP using the 'Allele-specific Gibbscluster' option. These representative results were obtained from 1 x 10⁸ cells and by using the following antibodies and cell lines: M1 antibody and EL4 cells for mouse MHC class I peptides; W6/32 antibody and JY cells for human MHC class I peptides; M5 antibody and A20 cells for mouse MHC class II peptides; L243 antibody and JY cells for human MHC class II peptides. Refer to the Supplementary Data 1-4 to access the full HTML reports generated by the MVP software. Please click here to view a larger version of this figure.
Supplementary Data 1-4: Please click here to download this File.
Supplementary Data 1: HTML report generated by the MVP software from peptides that were isolated from 1 x 10⁸ EL4 cells using the M1 antibody. Three biological replicates are shown. This report is related to Figure 4 and Figure 5 and representative peptides are listed in Supplementary Table 2.
Supplementary Data 2: HTML report generated by the MVP software from peptides that were isolated from 1 x 10⁸ JY cells using the W6/32 antibody. Three biological replates are shown. This report is related to Figure 4, and Figure 5, and representative peptides are listed in Supplementary Table 2.
Supplementary Data 3: HTML report generated by the MVP software from peptides that were isolated from 1 x 10⁸ JY cells using the L243 antibody. This report is related to Figure 5, and representative peptides are listed in Supplementary Table 2.
Supplementary Data 4: HTML report generated by the MVP software from peptides that were isolated from 1 x 10⁸ A20 cells using the M5 antibody. This report is related to Figure 5, and representative peptides are listed in Supplementary Table 2.
Supplementary Table 1: List of buffers. Recipes for all the buffers used in the protocol are described. Please click here to download this Table.
Supplementary Table 2: Representative lists of peptides associated with H2Db/Kb, HLA-ABC, HLA-DR, and H2-IAd/IEd. This table contains the lists of representative MHC class I and II peptides isolated from mouse EL4 and A20 cell lines, respectively, and HLA class I and II from human JY cell line. These data have been deposited on the ProteomeXchange (PXD028633). Please click here to download this Table.
DATA AVAILABILITY:
Datasets used in this manuscript were deposited on the ProteomeXchange (http://proteomecentral.proteomexchange.org/cgi/GetDataset): PXD028633.
Discussion
Two mouse cell lines (EL4 and A20), one human cell line (JY), and five commercially available antibodies [M1 (anti-H2Db/Kb), Y3 (anti-H2Kb), M5 (anti-H2-IAd/IEd), W6/32 (anti-HLA-ABC), and L243 (anti-HLA-DR)] were tested and validated in the context of this protocol and provide high-quality immunopeptidomics data. Other anti-HLA antibodies are available (e.g., anti-HLA-A2 BB7.2) but were not tested here. Note that the W6/32 antibody is widely used and the most established antibody in the field; it enables the isolation of peptides presented by all HLA-ABC molecules in humans and was previously reported by expert laboratories to work from various biological sources such as fresh or frozen tissues8,39, peripheral blood mononuclear cells and bone marrow mononuclear cell40, biopsies41, xenografts41,42, autopsies43 and plasma samples44,45.
The preparation of fresh solutions that are used throughout the protocol is critical. In particular, the use of fresh acidic solutions in glass bottles is critical to avoid subsequent contamination of the samples analyzed by MS. In addition, when the protocol is done for the first time and/or with a new antibody, it is important to assess that the antibody is indeed coupled to the CNBr Sepharose beads using a blue Coomassie gel. The washing steps of the antibody coupled beads following immunocapture of the MHC-peptide complexes is also critical to avoid contamination of non-MHC peptides. Finally, special care is required to not discard the eluates following the elution of the MHC-peptide complexes with 1% TFA and the elution of the peptides from the C18 column with ACN28%/0.1% FA.
Existing protocols available in the literature describe additional steps to further purify the peptides at the end of the isolation procedure, e.g., peptide fractionation by different methods14,46 or ultrafiltration using 10-30 kDa filters13,47. The current protocol does not provide details on those additional steps and is sufficient to provide high-quality immunopeptidomics data. However, such steps could be considered by non-experts to modify and troubleshoot to further optimize the peptide isolation procedure.
The type of beads and the type of acidic elution buffer that are used to elute MHC-complexes from the beads can also be modified for troubleshooting13,14,15,16,17,18,19. In this regard, sepharose CNBr-activated beads are generally a good starting point since they are relatively inexpensive in addition to show flexibility in terms of binding with various types of antibodies. In the current protocol, sepharose CNBr-activated beads were shown to perform relatively well using five different commercially available antibodies (i.e., M1, Y3, W6/32, L243, and M5). Besides sepharose CNBr-activated beads, Protein A or G or A/G sepharose 4 Fast Flow beads are also easy to handle, and although relatively more expensive, can generate similar results. Another factor to consider is the affinity of the antibody for protein A or G. Furthermore, sepharose magnetic beads are also very easy to use but are relatively expensive. Independently of the type of beads selected by non-experts, it is encouraged to collect aliquots at critical steps of the protocol and perform blue Coomassie-stained SDS-PAGE gels to track the binding efficiency of the antibody to the beads, as shown in Figure 2.
Another important factor influencing the successfulness of MHC peptides isolation refers to the type of acidic elution buffer used to isolate the MHC-peptide complexes from the beads. Different buffers have been reported including 0.1%, 1% or 10% TFA, 0.2% FA and 10% acetic acid. 1% TFA was the elution buffer working for all the antibodies tested. This step could also be traced by western blotting against the MHC molecules used to capture MHC peptides, as shown in Figure 3.
All buffers containing acetonitrile (ACN) and/or trifluoroacetic acid (TFA) are aggressive and can lead to contamination of the sample with small molecular and polymeric substances such as plasticizers if in contact with plastic. To avoid such issues, all solutions containing an organic solvent and/or TFA are prepared fresh daily and stored in a glass bottle until use. The majority of the steps are performed in Protein LoBind plastic tube. These tubes are specifically designed for proteomics and are made of the highest quality, virgin polypropylene free of biocides, plasticizers, and latex. They are also produced with optimized, highly polished molds without the use of slip agents. These precautions are important to consider to enable the generation of high-quality immunopeptidomics data.
The antibody is an important limitation for the isolation of MHC-bound peptides. The W6/32 antibody enables the isolation of peptides presented by all HLA-ABC class I molecules in humans and is the most widely used and established antibody in the field. High-resolution HLA typing of uncharacterized human cell lines or biospecimens is not a necessity upon application of the W6/32 antibody but is nevertheless recommended for certain applications to facilitate data interpretation48. HLA/MHC typing information can also be found in public resources for multiple cell lines and mouse models49. Besides the W6/32 antibody, the four other antibodies (M1, M5, Y3, and L243) that were tested and validated in the context of this protocol are all commercially available. On the other hand, many other antibodies that were reported in previous immunopeptidomics studies have not been largely adopted by the community and are not commercially available or are available through the culture of hybridoma cell lines, which is relatively expensive.
Another important limitation for the isolation of MHC-bound peptides is the amount of starting material required. The amount required is inversely proportional to the expression level of MHC molecules on the cell surface, which can be quantified by flow cytometry (Figure 4A). Cells showing high expression levels of MHC molecules (e.g., dendritic cells and hematopoietic cells in general) generally yield high-quality immunopeptidomics data. Expert labs use from as low as 50 million cells50, but 100 million to 1 billion cells are recommended for non-experts. Use of tissue biopsy (<13 mg)41, xenograft42,43, autopsy44, and plasma45,46 samples were also reported but remain challenging for non-expert laboratories. Also, the total number of MHC-associated peptides expected is well documented for established cell lines (here, between ~2000 and ~10000 peptides depending on the cell line and antibody used), but the absolute amounts of naturally presented peptides that are efficiently pulled down by the technique remain debated. Indeed, previous studies estimated that the efficiency of the isolation procedure is peptide-dependent and can be from as low as 0.5%-2%51. Other limitations in immunopeptidomics are the reproducibility of the methods and the inability of the NetMHCpan suite tools to correctly annotate peptides to MHC alleles that are less characterized. In this regard, further development and application of relatively new data-independent acquisition MS methods7,32,52, as well as new peptide clustering and MHC peptide binding prediction algorithms31,34,53,54 are expected to improve the reproducibility and the accuracy of peptide annotation in immunopeptidomics. Immunopeptidomics is facing other limitations regarding MS acquisition and computational analysis of MHC-associated peptides and are covered elsewhere1,6,55.
While the isolation of HLA-ABC-associated peptides from human samples using the W6/32 antibody is well established and widely applied by many research groups, the isolation of mouse MHC class I- and II-associated peptides is relatively less established. Hence, robust protocols for the isolation of mouse MHC ligands are needed. Here, we provide a protocol optimized for the isolation of MHC class I peptides and MHC class II peptides from two mouse cell lines of C57BL/6 and BALB/c origin, respectively. Specifically, the protocol enables the isolation of class I H2Kb- and H2Db-associated peptides using the M1 antibody, as well as class II H2-IAd and H2-IEd-associated peptides using the M5 antibody. Thus, dissemination and application of the current protocol should facilitate basic and translational immunopeptidomics research in various mouse models.
The protocol can be used to establish and standardize an immunopeptidomics workflow, as well as to benchmark new protocols. For instance, it can be adapted and further optimized to perform immunopeptidomics screening in various biological matrices ranging from blood/plasma to fresh or frozen tissue to FFPE (Formalin-Fixed Paraffin-Embedded). Moreover, the protocol will foster the intra- and inter-laboratory reproducibility of the sample preparation procedure in immunopeptidomics and is therefore expected to find wide application in basic and clinical research.
Disclosures
The authors declare that they have no competing financial interests.
Acknowledgements
We thank Pierre Thibault, Eric Bonneil, Joël Lanoix, Caroline Côté (Institute for Research in Immunology and Cancer, Université de Montréal) and Anthony Purcell (Monash University) for their insightful comments. This work was supported by funding from the Fonds de recherche du Québec - Santé (FRQS), the Cole Foundation, CHU Sainte-Justine, and the Charles-Bruneau Foundations, Canada Foundation for Innovation, the National Sciences and Engineering Research Council (NSERC) (#RGPIN-2020-05232) and the Canadian Institutes of Health Research (CIHR) (#174924).
Materials
| Name | Company | Catalog Number | Comments |
|---|---|---|---|
| A20 cell line | ATCC | TIB-208 | mouse B lymphoblast |
| Acetonitrile, LC/MS Grade | FisherScientific | A955-4 | |
| anti-Human HLA A, B, C (W6/32) - MHC class I | BioXcell | BE0079 | |
| anti-Human/Monkey HLA-DR (L243) - MHC class II | BioXcell | BE0308 | |
| anti-Mouse H2 (M1/42.3.9.8) - MHC class I | BioXcell | BE0077 | |
| anti-Mouse H2-IAd/IEd (M5/114) - MHC class II | BioXcell | BE00108 | |
| anti-Mouse H2Kb (Y3) - MHC class I | BioXcell | BE0172 | |
| BupH Phosphate Buffered Saline Packs (PBS) | ThermoFisher | 28372 | Pouch contents dissolved in a final volume of 500 mL deionized water (FisherScientific, W64) |
| CHAPS (3-[(3-cholamidopropyl)dimethylammonio]-1-propanesulfonate) | EMDMilipore | 220201-10MG | |
| CNBr-activated Sepharose | Cytivia | # 17-0430-01 | |
| EL4 cell line | ATCC | TIB-39 | mouse T lymphoblast |
| epTIPS LoRetention Tips, 1000 µL/Eppendorf | FisherScientific | 02-717-352 | Better results with low retention material |
| epTIPS LoRetention Tips, 200 µL/Eppendorf | FisherScientific | 02-717-351 | Better results with low retention material |
| Formic Acid, LC/MS Grade | FisherScientific | A117-50 | |
| Glycine | FisherScientific | RDCG0250500 | |
| Hydrochloric acid solution | FisherScientific | 60-007-11 | |
| JY cell line | Sigma Aldrich | 94022533-1VL | EBV-immortalised B cell lymphoblastoid line |
| Methanol, LC/MS Grade | FisherScientific | A456-4 | |
| Poly prep chromatography columns (polypropylene column) | Bio-Rad | 731-1550 | referred as polypropylene column in the protocol |
| Proteases inhibitor | ThermoFisher | A32963 | 1 pellet per 10 mL of cell lysis buffer |
| Qifikit | Dako | K007811-8 | |
| Sodium Bicarbonate | Amresco | # 0865-1kg | |
| Sodium Chloride | FisherScientific | MSX04201 | |
| Solid phase extraction disk, ultramicrospin column C18 | The nest group | SEMSS18V | capacity of 6–60 µg, max volume of 200 µL |
| Trifluoroacetic Acid (TFA), LC-MS Grade | FisherScientific | PI85183 | |
| Tris | FisherScientific | T395-500 | |
| Tris-HCl | FisherScientific | #10812846001 | |
| Tube LoBind 1.5 mL/Eppendorf | FisherScientific | E925000090 | Better results with low retention material |
| Tube LoBind 2 mL/Eppendorf | FisherScientific | 13-698-795 | Better results with low retention material |
| Water, LC/MS Grade | FisherScientific | W64 |
References
- Vizcaíno, J. A., et al. The human immunopeptidome project: A roadmap to predict and treat immune diseases. Molecular & Cellular Proteomics. 19 (1), 31-49 (2019).
- Caron, E., Aebersold, R., Banaei-Esfahani, A., Chong, C., Bassani-Sternberg, M. A case for a human immuno-peptidome project consortium. Immunity. 47 (2), 203-208 (2017).
- Arnaud, M., Duchamp, M., Bobisse, S., Renaud, P., Coukos, G., Harari, A. Biotechnologies to tackle the challenge of neoantigen identification. Current Opinion in Biotechnology. 65, 52-59 (2020).
- Caron, E., et al. The MHC I immunopeptidome conveys to the cell surface an integrative view of cellular regulation. Molecular Systems Biology. 7 (1), 533(2011).
- Istrail, S., et al. Comparative immunopeptidomics of humans and their pathogens. Proceedings of the National Academy of Sciences of the United States of America. 101 (36), 13268-13272 (2004).
- Caron, E., Kowalewski, D. J., Koh, C. C., Sturm, T., Schuster, H., Aebersold, R. Analysis of major histocompatibility complex (MHC) immunopeptidomes using mass spectrometry. Molecular & Cellular Proteomics. 14 (12), 3105-3117 (2015).
- Caron, E., et al. An open-source computational and data resource to analyze digital maps of immunopeptidomes. eLife. 4, 07661(2015).
- Bassani-Sternberg, M., et al. Direct identification of clinically relevant neoepitopes presented on native human melanoma tissue by mass spectrometry. Nature Communications. 7 (1), 13404(2016).
- Gubin, M. M., et al. Checkpoint blockade cancer immunotherapy targets tumour-specific mutant antigens. Nature. 515 (7528), 577(2014).
- Yadav, M., et al. Predicting immunogenic tumour mutations by combining mass spectrometry and exome sequencing. Nature. 515 (7528), 572-576 (2015).
- Laumont, C. M., et al. Noncoding regions are the main source of targetable tumor-specific antigens. Science Translational Medicine. 10 (470), 5516(2018).
- Lill, J. R., et al. Minimal information about an immuno-peptidomics experiment (MIAIPE). Proteomics. 18 (12), 1800110(2018).
- Nelde, A., Kowalewski, D. J., Stevanović, S. Antigen processing, methods and protocols. Methods in molecular biology. 1988, Clifton, N.J. 123-136 (2019).
- Purcell, A. W., Ramarathinam, S. H., Ternette, N. Mass spectrometry-based identification of MHC-bound peptides for immunopeptidomics. Nature Protocols. 14 (6), 1687-1707 (2019).
- Ebrahimi-Nik, H., et al. Mass spectrometry driven exploration reveals nuances of neoepitope-driven tumor rejection. JCI Insight. 5 (14), 129152(2019).
- Schuster, H., et al. A tissue-based draft map of the murine MHC class I immunopeptidome. Scientific Data. 5, 180157(2018).
- Ritz, D., Gloger, A., Weide, B., Garbe, C., Neri, D., Fugmann, T. High-sensitivity HLA class I peptidome analysis enables a precise definition of peptide motifs and the identification of peptides from cell lines and patients sera. PROTEOMICS. 16 (10), 1570-1580 (2016).
- Bassani-Sternberg, M. Mass spectrometry based immunopeptidomics for the discovery of cancer neoantigens. Methods Mol Biol. 1719, 209-221 (2018).
- Lanoix, J., et al. Comparison of the MHC I Immunopeptidome Repertoire of B-Cell Lymphoblasts Using Two Isolation Methods. Proteomics. 18 (12), 1700251(2018).
- Kuznetsov, A., Voronina, A., Govorun, V., Arapidi, G. Critical review of existing MHC I immunopeptidome isolation methods. Molecules. 25 (22), 5409(2020).
- Urlaub, D., Watzl, C. Coated latex beads as artificial cells for quantitative investigations of receptor/ligand interactions. Current Protocols in Immunology. 131 (1), 111(2020).
- Ghosh, M., et al. Guidance document: Validation of a high-performance liquid chromatography-tandem mass spectrometry immunopeptidomics assay for the identification of HLA class I ligands suitable for pharmaceutical therapies*. Molecular & Cellular Proteomics. 19 (3), 432-443 (2020).
- Fritsche, J., et al. Pitfalls in HLA ligandomics - How to catch a li(e)gand. Molecular & Cellular Proteomics. 20, 100110(2021).
- Caron Lab. GitHub. , Available from: https://github.com/CaronLab/MhcVizPipe (2021).
- Jurtz, V., Paul, S., Andreatta, M., Marcatili, P., Peters, B., Nielsen, M. NetMHCpan-4.0: Improved peptide-MHC Class I interaction predictions integrating eluted ligand and peptide binding affinity data. The Journal of Immunology. 199 (9), 3360-3368 (2017).
- Reynisson, B., Alvarez, B., Paul, S., Peters, B., Nielsen, M. NetMHCpan-4.1 and NetMHCIIpan-4.0: improved predictions of MHC antigen presentation by concurrent motif deconvolution and integration of MS MHC eluted ligand data. Nucleic Acids Research. 48, 449-454 (2020).
- Andreatta, M., Alvarez, B., Nielsen, M. GibbsCluster: unsupervised clustering and alignment of peptide sequences. Nucleic Acids Research. 45 (1), 458-463 (2017).
- Nielsen, M., et al. NetMHCpan, a method for quantitative predictions of peptide binding to any HLA-A and -B Locus protein of known sequence. PLoS ONE. 2 (8), 796(2007).
- Fortier, M. -H., et al. The MHC class I peptide repertoire is molded by the transcriptome. The Journal of Experimental Medicine. 205 (3), 595-610 (2008).
- Marco, M. D., Schuster, H., Backert, L., Ghosh, M., Rammensee, H. -G., Stevanovic, S. Unveiling the peptide motifs of HLA-C and HLA-G from naturally presented peptides and generation of binding prediction matrices. The Journal of Immunology. 199 (8), 2639-2651 (2017).
- Sarkizova, S., et al. A large peptidome dataset improves HLA class I epitope prediction across most of the human population. Nature Biotechnology. 38 (2), 199-209 (2019).
- Pak, H., et al. Sensitive immunopeptidomics by leveraging available large-scale multi-HLA spectral libraries, data-independent acquisition and MS/MS prediction. 20, 100080(2021).
- Nielson, M. NetMHNetMHCpan 4.1 Motif Viewer. , Available from: http://www.cbs.dtu.dk/services/NetMHCpan/logos_ps.php (2021).
- Racle, J., et al. Robust prediction of HLA class II epitopes by deep motif deconvolution of immunopeptidomes. Nature Biotechnology. 37 (11), 1283-1286 (2019).
- Abelin, J. G., et al. Defining HLA-II ligand processing and binding rules with mass spectrometry enhances cancer epitope prediction. Immunity. 51 (4), 766-779 (2019).
- Nielson, M. NetMHCIIpan 4.0 Motif Viewer. , Available from: http://www.cbs.dtu.dk/services/NetMHCIIpan/logos.php (2021).
- Sofron, A., Ritz, D., Neri, D., Fugmann, T. High-resolution analysis of the murine MHC class II immunopeptidome. European Journal of Immunology. 46 (2), 319-328 (2015).
- Kovalchik, K. A., et al. Immunopeptidomics for Dummies: Detailed Experimental Protocols and Rapid, User-Friendly Visualization of MHC I and II Ligand Datasets with MhcVizPipe. bioRxiv. , (2020).
- Schuster, H., et al. The immunopeptidomic landscape of ovarian carcinomas. Proceedings of the National Academy of Sciences. 114 (46), 9942-9951 (2017).
- Berlin, C., et al. Mapping the HLA ligandome landscape of acute myeloid leukemia: a targeted approach toward peptide-based immunotherapy. Leukemia. 29 (3), 1-13 (2014).
- Rijensky, N. M., et al. Identification of tumor antigens in the HLA peptidome of patient-derived xenograft tumors in mouse. Molecular & Cellular Proteomics. 19 (8), 1360-1374 (2020).
- Heather, J. M., et al. Murine xenograft bioreactors for human immunopeptidome discovery. Scientific Reports. 9 (1), 18558(2019).
- Marcu, A., et al. HLA ligand atlas: A benign reference of HLA-presented peptides to improve T-cell-based cancer immunotherapy. Journal for Immunotherapy of Cancer. 9 (4), 002071(2021).
- Shraibman, B., et al. Identification of tumor antigens among the HLA peptidomes of glioblastoma tumors and plasma. Molecular & Cellular Proteomics. 18 (6), 1255-1268 (2019).
- Bassani-Sternberg, M., Barnea, E., Beer, I., Avivi, I., Katz, T., Admon, A. Soluble plasma HLA peptidome as a potential source for cancer biomarkers. Proceedings of the National Academy of Sciences. 107 (44), 18769-18776 (2010).
- Demmers, L. C., Heck, A. J. R., Wu, W. Pre-fractionation extends, but also creates a bias in the detectable HLA class Ι ligandome. Journal of Proteome Research. 18 (4), 1634-1643 (2019).
- Kowalewski, D. J., Stevanović, S. Antigen processing,. Methods and Protocols. 960, 145-157 (2013).
- Bentley, G., et al. High-resolution, high-throughput HLA genotyping by next-generation sequencing. Tissue Antigens. 74 (5), 393-403 (2009).
- Boegel, S., Löwer, M., Bukur, T., Sahin, U., Castle, J. C. A catalog of HLA type, HLA expression, and neo-epitope candidates in human cancer cell lines. OncoImmunology. 3 (8), 954893(2014).
- Klaeger, S., et al. Optimized liquid and gas phase fractionation increases HLA-peptidome coverage for primary cell and tissue samples. Molecular & Cellular Proteomics. 20, 100133(2021).
- Hassan, C., et al. Accurate quantitation of MHC-bound peptides by application of isotopically labeled peptide MHC complexes. Journal of Proteomics. 109, 240-244 (2014).
- Ritz, D., Kinzi, J., Neri, D., Fugmann, T. Data-independent acquisition of HLA Class I peptidomes on the Q exactive mass spectrometer platform. Proteomics. 17 (19), (2017).
- O'Donnell, T. J., Rubinsteyn, A., Laserson, U. MHCflurry 2.0: Improved pan-allele prediction of MHC Class I-presented peptides by incorporating antigen processing. Cell Systems. 11 (1), 42-48 (2020).
- O'Donnell, T. J., Rubinsteyn, A., Bonsack, M., Riemer, A. B., Laserson, U., Hammerbacher, J. MHCflurry: Open-source Class I MHC binding affinity prediction. Cell Systems. 7 (1), 129-132 (2018).
- Faridi, P., Purcell, A. W., Croft, N. P. In immunopeptidomics we need a sniper instead of a shotgun. Proteomics. 18 (12), 1700464(2018).
Reprints and Permissions
