JoVE Science Education
Sensation and Perception
A subscription to JoVE is required to view this content.  Sign in or start your free trial.
JoVE Science Education Sensation and Perception
Crowding
  • 00:00Overview
  • 01:24Experimental Design
  • 04:53Running the Experiment
  • 06:04Representative Results
  • 07:19Applications
  • 09:54Summary

צפיפות

English

Share

Overview

מקור: המעבדה של ג’ונתן פלומבאום – אוניברסיטת ג’ונס הופקינס

הראייה האנושית תלויה בנוירונים רגישים לאור המסודרים בחלק האחורי של העין על רקמה הנקראת הרשתית. הנוירונים, הנקראים המוטות והאצובים בגלל הצורות שלהם, אינם מפוזרים באופן אחיד על הרשתית. במקום זאת, יש אזור במרכז הרשתית שנקרא המקולה שבו קונוסים ארוזים בצפיפות, ובמיוחד כך באזור משנה מרכזי של המקולה שנקרא הגומה. מחוץ לגומה אין כמעט קונוסים, וצפיפות המוט פוחתת במידה ניכרת עם מרחק גדול יותר מהגומה. איור 1 סכמת הסדר זה. סידור מסוג זה משוכפל גם בקליפת המוח החזותית: תאים רבים נוספים מייצגים גירוי בגומה בהשוואה לפריפריה.

Figure 1
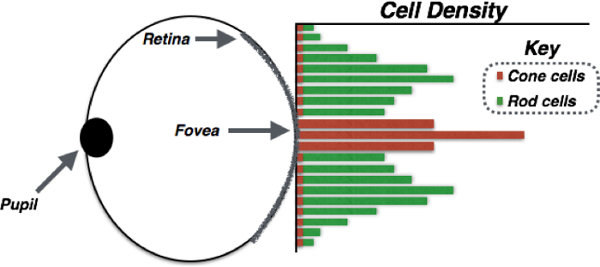
איור 1. תיאור סכמטי של העין האנושית והתפלגות תאי קולטן רגישים לאור ברשתית. האישון הוא הפתח בקדמת העין המאפשר לאור להיכנס. האור מתמקד לאחר מכן על הרשתית, רקמה עצבית בחלק האחורי של העין כי הוא עשוי מוטות וקונוסים, תאים רגישים לאור. במרכז הרשתית נמצאת המקולה, ובמרכז המקולה נמצא הגומה. הגרף סכמטי את הצפיפות של קולטני מוט וחרוט על הרשתית כפונקציה של המיקום שלהם. קונוסים, האחראים לראיית צבע, נמצאים כמעט אך ורק בגומה. מוטות, התומכים לראות בתנאי תאורה נמוכה, מקובצים באופן דומה יותר בכבדות ליד הגומה, עם צפיפות נופלת במהירות מחוץ למקולה.

התוצאה: אנו רואים היטב בחלק החלל שעינינו מצביעות עליו ישירות, החלק של החלל מגרה את הגומה; אבל אנחנו בעצם לא רואים כל כך טוב בפריפריה. אנחנו לא ממש שמים לב לזה, כי העיניים שלנו לנוע כל הזמן, בניית ייצוג של שטח קיבעונות בודדים רבים.

אחת ה דרך לחקור את המאפיינים של ראייה היקפית היא עם תופעה המכונה צפיפות. 1 הצפיפות מתייחסת לחוסר יכולת לזהות עצמים בבלגן, ואנו חווים צפיפות חזקה במיוחד כאשר אובייקטים מוצגים בפריפריה. איור 2a הוא דוגמה שבה אתה אמור להיות מסוגל לחוות צפיפות: הביטו בצלב שבמרכז, וראו אם אתם יכולים לדווח על האות שנמצאת באמצע החבילה מימין. זה כנראה די קשה. כעת באיור 2b נסו לדווח על המכתב משמאל. הרבה יותר קל! בנתון זה המכתב אינו צפוף ואין עומס סביבו, ולכן קל יותר לזהות אותו.

Figure 2a

איור 2א. גירוי צפוף. קבע את הצלב במרכז, ולראות אם אתה יכול לזהות את האות באמצע החבילה בצד שמאל. זה צריך להיות קשה, כי האותיות נמצאות בפריפריה, והאותיות המרכזיות צפופות באותיות שסביבה.

Figure 2b

איור 2ב. גירוי לא צפוף. גירוי זה זהה לאיור 2א, אלא שהאות G אינה צפופה- אין אותיות אחרות המקיפות אותו. גם בעת קיבוע הצלב, המכתב צריך להיות קל לזיהוי, למרות שהוא נמצא בפריפריה לא פחות מה-G באיור 2א.

וידאו זה ידגים כיצד לעצב וליישם ניסוי צפיפות עם אותיות כמו גירויים.

Procedure

1. גירויים ועיצוב המשפטים יכללו את כל הבעייתים האנגליים, כתובים בשחור ומוצגים בגופן הלוטיקה 36 pt. כל ניסוי של הניסוי יתחיל עם צלב קיבעון המוצג במרכז התצוגה עבור 500 אלפיות השנייה, ואחריו גירויים שהוצגו מימין או משמאל לצלב במשך 500 אלפיות השנייה, ולבסוף אחריו מסך תגובה. איור 3…

Results

Figure 5 graphs accuracy as a function of relative spacing. As relative spacing got bigger, performance improved by a lot. What this means is that performance benefits when the inter-stimulus spacing is at least half as big as the eccentricity. In fact, the idea that spacing needs to be half as big as eccentricity to prevent crowding is known as Bouma's Rule, after the scientist who discovered how the ratio between inter-stimulus spacing and eccentricity controls crowding. When the ratio is 0.5, as shown in the graph, performance is usually around 75% or better. Below 0.5, accuracy is often close to chance. Note that even with a relative spacing of 0.4, performance in this experiment was less than 25%, and with a relative spacing of 0.25, it was close to random. There are 21 consonants in English, so guessing would produce the right answer nearly 5% of the time.

Figure 5
Figure 5. Results of the crowding experiment. Recognition accuracy was very poor, and at times close to chance in trials with a relative spacing less than 0.5. But for trials with spacing of 0.5 or greater, recognition was usually better than 75% accurate. 0.5 is generally the critical relative spacing that prevents crowding.

Variations

Now that you know the basics of running a crowding experiment, you can run an experiment to show that relative spacing is the crucial determinant of crowding. Here is how: Pick four eccentricity values, say 50, 100, 200, and 250 px. For each, identify the four inter-stimulus spacing values that will give you the relative spacing values from the previous experiment, i.e. 0.25, 0.4, 0.5, and 0.75. Now you have four different ways of producing the same relative spacing values but with different eccentricities. That's 16 conditions in total. Run an experiment with 50 trials of all 16 conditions, and plot the data as shown in the Figure 6. You should find that relative spacing is the crucial determinant of performance (as opposed to eccentricity).

Figure 6
Figure 6. Results of a second crowding experiment designed to contrast the effects of eccentricity and relative spacing on performance. The x-axis displays the four relative spacing values used, and the different color icons represent the different eccentricities. If eccentricity were the primary constraint on recognition, then icons with the same color would tend to group together in terms of recognition accuracy. But instead, accuracy seemed to be governed by relative spacing.

Applications and Summary

One reason that understanding crowding is important has to do with macular degeneration. Macular degeneration is a condition that mostly affects older adults, involving the degeneration of the macula, the densely populated part of the retina that includes the fovea. Macular degeneration is the leading cause of blindness in the US among people over 65. It leaves people heavily reliant on peripheral vision. Thus, research on crowding can help scientists to understand the limitations and affordances of peripheral vision, how to improve it, and generally how to design the environment to prevent crowding in important situations.

Understanding how crowding works also plays a role in how engineers, graphic designers, and web developers arrange many of the displays that people engage with on a daily basis. For example, when a pop-up or banner ad appears in your web-browser, it is often designed to catch your attention, but not be 100% readable or resolvable because of crowding-the people behind the scenes want you to move your eyes and look at the ad after it catches your attention.

Acknowledgements

1. Whitney, D., & Levi, D. M. (2011). Visual crowding: A fundamental limit on conscious perception and object recognition. Trends in cognitive sciences,15(4), 160-168.

Transcript

We don’t always see objects in our surroundings clearly, especially if they are located in the periphery of our visual field.

Throughout the day, an individual will move their eyes to look directly at different, distinct items—like elements of a painting in a museum.

When this happens, the object being closely studied—like an apple—is positioned in the middle of the observer’s field of view, and as a result is seen clearly.

In contrast, an item far off to the side of the apple—in this instance, a dog—is located in the periphery of the visual field, and is perceived as fuzzy.

Such haziness can actually worsen in a phenomenon called visual crowding. Here, if the peripheral object is surrounded by “clutter”—like more canines a rogue artist decided to paint—it will be unrecognizable.

In this video, we explore how to investigate crowding using a letter-based approach. We not only explain how to design stimuli and collect and interpret peripheral vision data, but we also note how researchers are studying the concept in other contexts—like how it affects driving safety.

In this experiment, participants are asked to identify letters that are delivered to their peripheral visual field.

This is accomplished by first having them focus on a small fixation cross presented in the middle of a computer monitor, after which the letter stimuli appear.

During this phase, a row of three equally-spaced, capitalized English consonants—like JXW—are shown to one side of the cross, and thus are seen only with peripheral vision. Vowels are specifically excluded, as they could form short words that might interfere with data collection.

Although all of these characters are in the same size and type of font, two key variables are manipulated in these stimuli—eccentricity and inter-stimulus spacing—to better understand the factors that affect crowding.

The first, eccentricity, is the distance in pixels from the central letter to the intersection of the lines in the cross, which relates to where in the periphery of the visual field stimuli are delivered; the higher the eccentricity, the more peripheral the presentation of the letters.

In contrast, inter-stimulus spacing is defined as the distance—also in pixels—between the central consonant and each of the letters that abut it. This measurement assesses how close the flankers need to be to the middle character, to provide the clutter necessary for visual crowding.

The numbers chosen for these two distances in any given stimulus are actually controlled by a third variable defined as the ratio of inter-stimulus spacing to eccentricity—called the relative spacing.

Four different values—0.25, 0.4, 0.5, and 0.75—are tested to specifically assess whether inter-stimulus spacing needs to be a certain size, in relation to eccentricity, to have a crowding effect on peripheral vision.

For example, if a letter trio has a relative spacing value of 0.75, this means that the inter-stimulus distance is three-fourths the size of the eccentricity. So, the flanking consonants would be located relatively far away from the central character.

After the stimulus disappears, a response screen is shown, which prompts participants to type in what they perceived as the central letter.

Two hundred such trials are performed, in which stimuli with different relative spacing values are equally—but randomly—presented.

Here, the dependent variable is the percentage of trials in which the middle letter is correctly identified.

Based on previous work, it is expected that participants will only be able to accurately recognize the central characters in stimuli with a relative spacing of 0.5 or greater.

Importantly, this indicates that inter-stimulus spacing needs to be at least half the size of eccentricity to prevent crowding, a stipulation known as Bouma’s rule.

Greet the participant when they arrive, and have them sign informed consent materials. Then, seat them in front of a computer monitor with a keyboard.

Place their chin in the apparatus positioned approximately 60 cm from the screen.

Continue to explain the task, emphasizing that the experiment is self-paced, and—to proceed—the spacebar must be pressed. Also note that if in any instance the participant is unsure of the identity of the central consonant, they should provide their best guess.

Then, watch as the participant performs several practice trials. For each, ensure that the fixation cross is presented for 500 ms, followed by it and the letters, for the same amount of time. Also check that the participant, when prompted, enters their responses by pressing a consonant button on the keyboard.

Once they understand the task, leave the room, and allow the participant to complete the 200 trials.

To analyze the data, for each relative spacing ratio, compute the percentage of trials in which participants correctly identified the central consonant.

Notice that, as relative spacing increased, accuracy improved. Specifically, when this ratio was 0.5, participants demonstrated a performance of 75%, and this value jumped to approximately 95% when the relative spacing was 0.75.

However, with a ratio of 0.4, participants only accurately recognized the central consonant in 20% of trials, and at 0.25 this value dropped to 5%—a frequency that roughly corresponds to chance, if the central letter was guessed randomly

Collectively, these results indicate that crowding only occurs if the inter-stimulus spacing is less than half the size of eccentricity—for example, either 25% or 40% of this distance, as tested here—an observation supporting Bouma’s rule.

Now that you know how the manipulation of eccentricity and inter-stimulus spacing can be used to study crowding, let’s take a look at other ways aspects of peripheral vision are being explored.

Crowding has also been looked at in relation to automobile safety, and whether the number of objects in an environment can influence what a driver sees.

Such work has determined that crowding—either several cars, traffic cones, or signs in an area—can cause a driver to not effectively perceive a pedestrian.

For example, a person may observe a blurry object amidst cars, and think it is a parked bike—until the item darts out into the street, and turns out to be a man running to catch a train.

Work on the limits of peripheral vision is encouraging researchers to come up with ways to improve pedestrian and driving safety, like creating clear, well-lit crosswalks.

In contrast, web developers are also applying what we know about peripheral vision to create effective pop-up ads.

Due to the effects of crowding on letters, such banners are designed to not contain a lot of text, since these words won’t be distinguishable when they appear on the side of a monitor—in an internet user’s peripheral vision.

Rather, these advertisements contain bright, moving elements that attract someone’s attention, and cause them to move their eyes and fixate on this promotion. Then—hopefully—the person will click on it and order whatever is being sold.

Up until now, we’ve focused on crowding in normal participants; however, researchers are also looking at whether this perceptual phenomenon is related to visual defects associated with certain diseases.

For example, some work has involved the presentation of closely-spaced letter trios to patients diagnosed with a neurodegenerative condition similar to Alzheimer’s. Importantly, these stimuli were shown in the middle of a computer monitor, and thus delivered to the center of the visual field.

Interestingly, fewer patients were able to name the central letter, compared to healthy controls.

Collectively, this work provides evidence for the expansion of crowding—normally only a problem in the periphery—into central vision, and offers a possible explanation for the reading difficulties some neurodegenerative patients experience.

You’ve just watched JoVE’s video on peripheral crowding. By now, you should understand how to manipulate letter spacing to investigate this phenomenon, and collect and interpret vision data. In addition, you should grasp how crowding is being applied to other areas, such as the design of pop-up ads.

Thanks for watching!

Tags

Cite This
JoVE Science Education Database. JoVE Science Education. Crowding. JoVE, Cambridge, MA, (2023).