A titration curve is a plot of some solution property versus the amount of added titrant. For acid-base titrations, solution pH is a useful property to monitor because it varies predictably with the solution composition and, therefore, may be used to monitor the titration’s progress and detect its endpoint. Acid-base titration can be performed with a strong acid and a strong base, a strong acid and a weak base, or a strong base and a weak acid.
For a titration carried out for 25.00 mL of 0.100 M HCl (strong acid) with 0.100 M of a strong base NaOH, its titration curve can be seen in red in Figure 1a. For a titration carried out for 25.00 mL of 0.100 M CH3COOH (weak acid) with 0.100 M NaOH, its titration curve can be seen in yellow in Figure 1b.
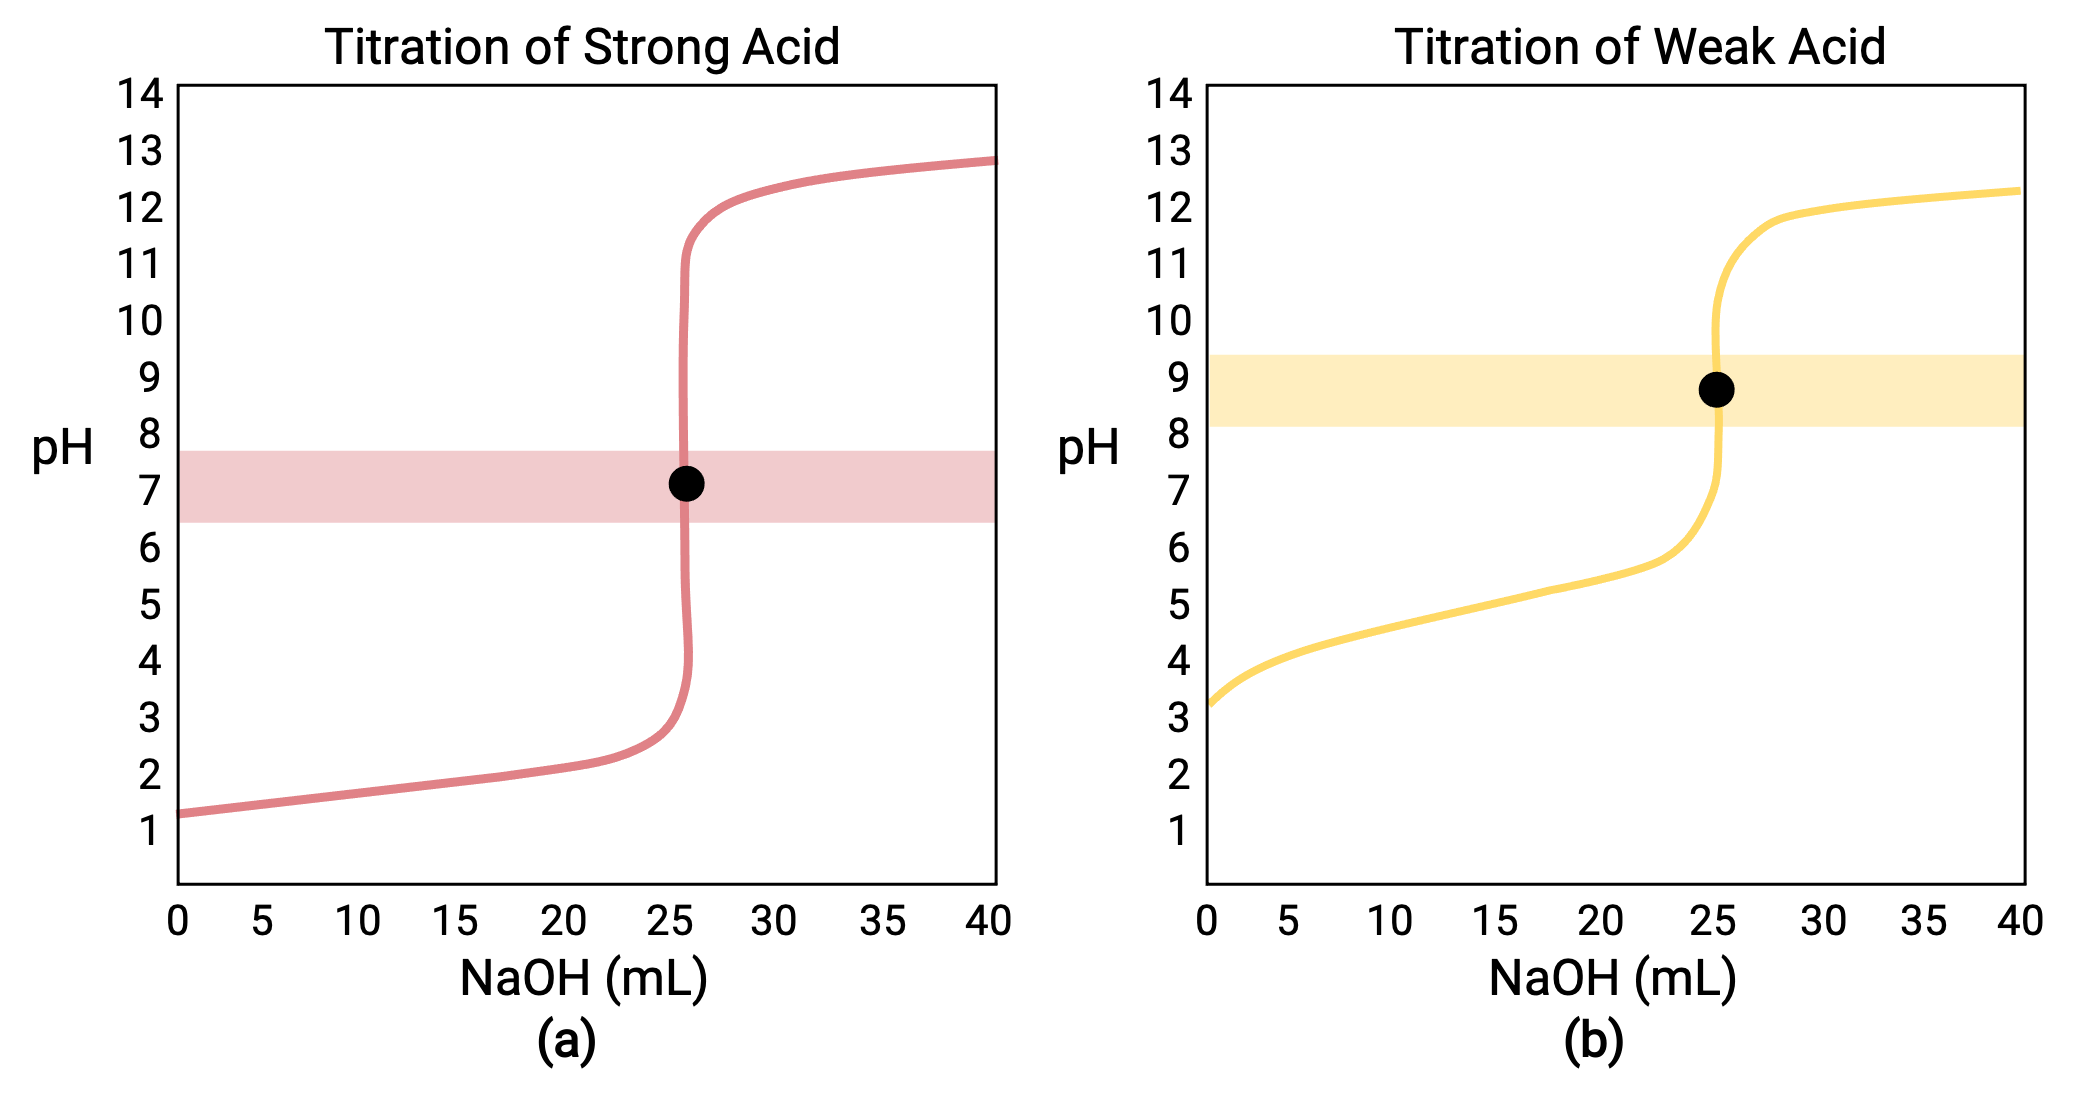
Figure 1 (a) The titration curve for the titration of 25.00 mL of 0.100 M HCl (strong acid) with 0.100 M NaOH (strong base) has an equivalence point of 7.00 pH. (b)The titration curve for the titration of 25.00 mL of 0.100 M acetic acid (weak acid) with 0.100 M NaOH (strong base) has an equivalence point of 8.72 pH.
The titration of a strong or weak base with a strong acid has a similar S-shaped curve; however, the curve is inverted as the pH will start in the basic region and decrease with the addition of the strong acid. The titration of weak acid or base can also be used to determine the Ka or Kb, respectively.
The four stages of a titration:
- Initial state (added titrant volume = 0 mL): pH is determined by the acid being titrated; because the two acid samples are equally concentrated, the weak acid will exhibit a greater initial pH
- Pre-equivalence point (0 mL < V < 25 mL): solution pH increases gradually and the acid is consumed by reaction with added titrant; composition includes unreacted acid and the reaction product, its conjugate base
- Equivalence point (V = 25 mL): a drastic rise in pH is observed as the solution composition transitions from acidic to either neutral (for the strong acid sample) or basic (for the weak acid sample), with pH determined by ionization of the conjugate base of the acid
- Post-equivalence point (V > 25 mL): pH is determined by the amount of excess strong base titrant added; since both samples are titrated with the same titrant, both titration curves appear similar at this stage.
This text is adapted from Openstax, Chemistry 2e, Section 14.7: Acid-base Titrations.